Tallgrass Creek Senior Living Community
Nursing Home & Independent Living · Overland Park, KS
CMS overall rating Info CMS (the Centers for Medicare & Medicaid Services) is the federal agency that rates nursing home quality. Its Overall Rating runs from 1 to 5 stars, combining health inspections, staffing, and quality measures, with inspections weighted most heavily.

Tallgrass Creek Senior Living Community

Nursing Home & Independent Living · Overland Park, KS
CMS overall rating Info CMS (the Centers for Medicare & Medicaid Services) is the federal agency that rates nursing home quality. Its Overall Rating runs from 1 to 5 stars, combining health inspections, staffing, and quality measures, with inspections weighted most heavily.
Calculator: See prices in your area
Tallgrass Creek Senior Living Community accepts Medicare and private pay.

Overview of Tallgrass Creek Senior Living Community

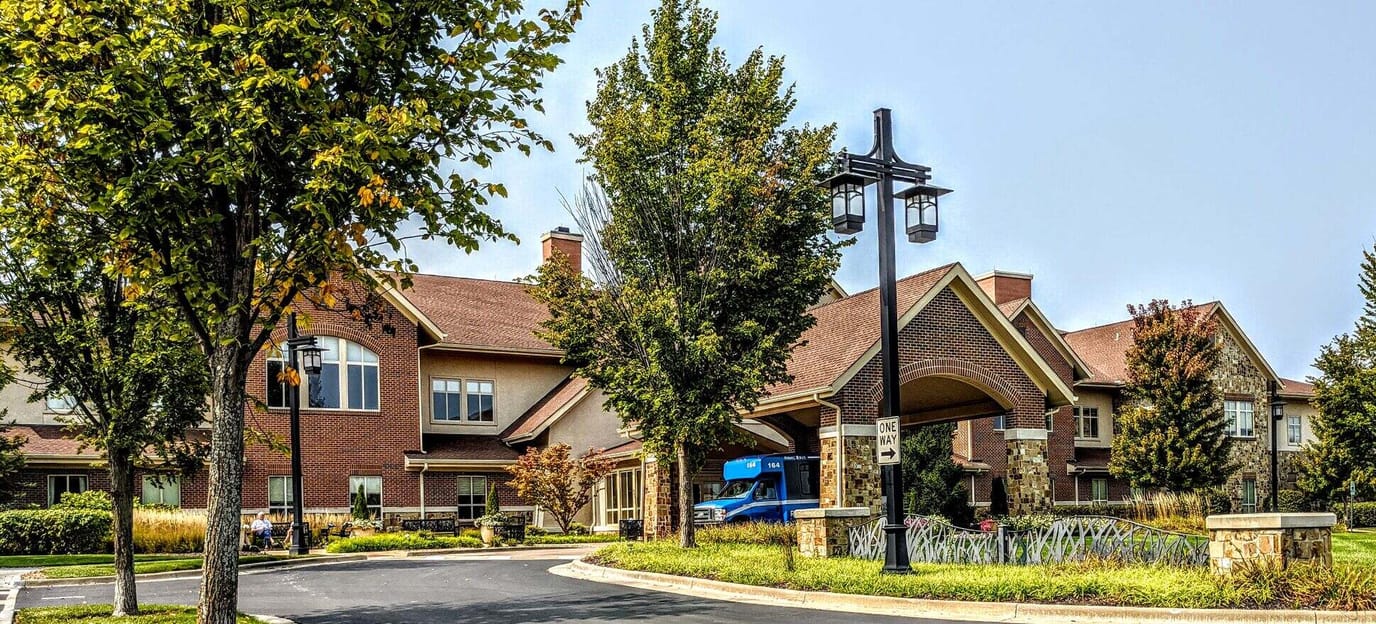
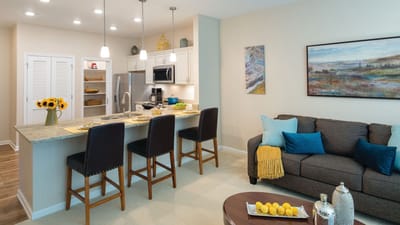
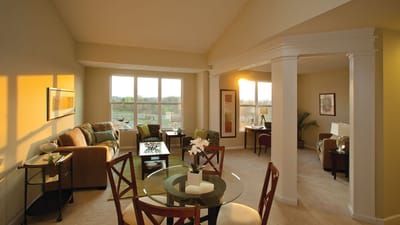
Experience the best of your golden years at Tallgrass Creek Senior Living Community, an astounding community in Overland Park, KS, offering independent living. With beautifully furnished and spacious one- and two-bedroom floor plans, the community strives to improve residents’ living experiences. A kind team also helps with chores and maintenance to ensure they have a worry-free living.

With cozy communal spaces and wellness opportunities, residents have more opportunities to gain meaningful experiences. Residents have various options for dining, with multiple dining venues that offer distinct dining options to satisfy their dietary needs and preferences. Amenities include a swimming pool, a fitness center, a theater room, a concierge, a library, and beautifully maintained amenities, creating the ideal setting for residents to relax and enjoy their retirement.

(913) 897-2700

Quality ratings

Measured by Centers for Medicare & Medicaid Services (CMS)

Overall rating Info The Overall CMS Rating combines results from health inspections, staffing levels and quality measures. Health inspections carry the most weight. Staffing and quality scores can increase or decrease the final rating based on performance compared to state and national standards.
▲ 72.9% Above KS avg. ▲ 72.9% Above KS avg.KS average: 2.9Click the badge to see the full State ranking.Click here to see the full State ranking.
Health Inspection Info Based on the results of the facility's three most recent standard inspections and any complaint investigations. CMS reviews the number, scope, and severity of deficiencies, with more recent findings weighted more heavily.
▲ 81.0% Above KS avg. ▲ 81.0% Above KS avg.KS average: 2.8Click the badge to see the full State ranking.Click here to see the full State ranking.
Staffing Info Measures average nursing staff hours per resident per day, including Registered Nurses (RNs) and total nursing staff. Ratings are adjusted based on the level of care residents require and are compared to state and national benchmarks.
▲ 44.6% Above KS avg. ▲ 44.6% Above KS avg.KS average: 3.5Click the badge to see the full State ranking.Click here to see the full State ranking.
Quality Measures Info Based on clinical and physical health indicators reported to CMS, such as hospital readmissions, falls, pressure ulcers, and improvements in mobility. These measures reflect how well residents' health needs are being managed.
▲ 29.4% Above KS avg. ▲ 29.4% Above KS avg.KS average: 3.1Click the badge to see the full State ranking.Click here to see the full State ranking.

Staffing hours breakdown

Info Daily nursing hours per resident by staff type, reported to CMS. Higher is generally better — compare this facility to state and national averages to see where staffing stands.

Hours per resident per day — compared to Kansas state averages

Total nursing care / resident Info Total adjusted nursing hours per resident per day, combining RN, LPN, and aide time. CMS adjusts this for case-mix so facilities can be fairly compared.
5h 6m per day
This facility Kansas avg (4h 38m per day)
vs Kansas avg
+10%

0 of 6 metrics below state avg

Standout metric Physical Therapist is +124% above state avg
Staff typeHours / Day / Residentvs state avg
Registered Nurse (RN) Info RNs hold the highest nursing license and can assess residents, interpret test results, and direct care plans. More RN hours per day often signals stronger clinical oversight and faster response to health changes. 1h 18m per day ▲ 83% State avg: 42m per day · National avg: 41m per day
LPN / LVN Info Licensed Practical Nurses (LPNs) or Licensed Vocational Nurses (LVNs) deliver routine hands-on care — medication administration, wound dressing, and monitoring vital signs. They work under RN supervision and make up a large share of daily bedside care. 1h 0m per day ▲ 52% State avg: 40m per day · National avg: 52m per day
Nurse Aide Info Certified Nurse Aides (CNAs) provide the most direct day-to-day assistance: bathing, dressing, feeding, and mobility. Nurse aide hours are typically the largest staffing category and directly affect residents' quality of life. 2h 43m per day ■ Avg State avg: 2h 41m per day · National avg: 2h 20m per day
Weekend Total Nursing Info Combined nursing hours (RN + LPN + Nurse Aide) per resident per day on weekends. Staffing often drops on weekends — this figure reveals whether the facility maintains adequate coverage outside of weekday hours. 4h 26m per day ▲ 22% State avg: 3h 38m per day · National avg: 3h 27m per day
Physical Therapist Info Hours per resident per day provided by licensed Physical Therapists (PTs) or PT Assistants. PT services help residents recover mobility after injury or illness and are especially important for post-acute (short-stay) rehabilitation. 6m per day ▲ 124% State avg: 2m per day · National avg: 4m per day
Weekend RN Info Registered nurse hours specifically on weekends. Facilities sometimes reduce RN presence on Saturdays and Sundays — a low weekend RN figure compared to weekday hours can indicate reduced clinical oversight when most administrative staff are absent. 42m per day ▲ 43% State avg: 29m per day · National avg: 29m per day

Capacity and availability

Avg. Length of Stay
157 days
Bed community size
116-bed community Rank #29 / 224Bed count — State benchmarkedThis home is ranked 29th out of 224 homes in Kansas. Shows this facility's certified or reported bed count compared to other Kansas facilities. Larger communities may offer more amenities, programs, and on-site services for residents and families.Rankings are based only on facilities in Kansas that report data for that category. Facilities without available data are excluded from the ranking.Click the rank badge to see the full State ranking.Click here to see the full State ranking.
A larger shared setting that may offer more common spaces and organized community services.
Walk Score
Walk Score: 75 / 100 Rank #39 / 363Walk Score — State benchmarkedThis home is ranked 39th out of 363 homes in Kansas. Shows how walkable this facility's neighborhood is compared to the average Walk Score across Kansas facilities. Higher scores benefit residents, families, and staff.Rankings are based only on facilities in Kansas that report data for that category. Facilities without available data are excluded from the ranking.Click the rank badge to see the full State ranking.Click here to see the full State ranking.
Very walkable. Most errands can be accomplished on foot, and many essentials are within a short walk.

About this community

Occupancy

Occupancy rate
96%
Higher than the Kansas average: 79.5%
Occupied beds
111 / 116
Average occupied beds in Kansas homes 50 beds

License Details

Facility TypeNursing Facility | Residential Health Care Facility | Assisted Living Facility
StatusActive
CountyJohnson
License Number175541

Ownership & Operating Entity

Tallgrass Creek Senior Living Community is administered by Sonya Martin.

OwnerREDWOOD-ERC KANSAS LLC

Type Of Units

Assisted Living
42 units
Residential
30 units
NF (Nursing Facility)
44 units
SNF/NF (Combined)
44 units
Total beds
116 units

Contact Tallgrass Creek Senior Living Community

Inspection History

In Kansas, the Department for Aging and Disability Services, Survey and Certification Commission performs the unannounced inspections required for facility licensing and federal certification.

Inspection Scorecard Info This scorecard compares key inspection, citation, and complaint metrics at this facility against the Kansas state average. Metrics rated ≥15% worse than average are highlighted in red; those ≥15% better are highlighted in green.

Overall vs. KS average 0 Worse No metrics in this bucket. 1 Better Metrics better than Kansas average:
• Total inspections (56% below)
Latest Inspection December 22, 2025

Inspections Info State inspections evaluate whether the facility meets health and safety standards.

This FacilityKS Averagevs. KS Avg
Total inspections Info Combined count of all routine and focused inspections. Excludes complaint investigations. 1432 This facility has 56% fewer total inspections than a typical Kansas nursing home (14 vs. KS avg 32).↓ 56% better

Health Inspection History

Inspections since 2021
Total health inspections 4

Kansas average 4.5


Last Health inspection on May 2024

Total health citations
17

Kansas average 26.9

Citations per inspection
4.25

Kansas average 6.07


Health citations are formal notices following inspections when they fail to comply with safety and care standards.

9 of 17 citations resulted from standard inspections; 1 of 17 resulted from complaint investigations; and 7 of 17 came from combined inspections (standard and complaint).

Breakdown of citation severity (last 5 years)
Critical health citations
1
11% worse than Kansas average

Kansas average: 0.9


Serious health citations
0
100% better than Kansas average

Kansas average: 0.9

1 critical citation Kansas average: 0.9

0 serious citations Kansas average: 0.9

16 moderate citations Kansas average: 24.6

0 minor citations Kansas average: 0.5
Citations history (last 5 years)
Infection Control moderate citation May 08, 2024
Corrected

Nutrition moderate citation May 08, 2024
Corrected

Nutrition moderate citation May 08, 2024
Corrected

Nutrition moderate citation May 08, 2024
Corrected

Staffing Data

Reporting period: October 1 – December 31, 2025 (Q4 2025). Source: CMS Payroll-Based Journal report.

Total staff 103
Employees 99
Contractors 4
Staff to resident ratio 2.58 : 1
15% more staff per resident than Kansas average
Kansas average ratio: 2.24 : 1 Kansas average ratio: 2.24 : 1See full Kansas ranking
Avg staff/day 31
Average shift 7.7 hours
0% compared with Kansas average
Kansas average: 7.7 hours Kansas average shift: 7.7 hoursSee full Kansas ranking
Total staff hours (quarter) 21,941

Nursing staff breakdown

Q4 2025 · Oct 1 – Dec 31 More info This data comes from the CMS Payroll-Based Journal report covering October 1 – December 31, 2025.
Registered Nurse

Manages medical care and health needs.

RN Staff Info All 9 RN Staff are full-time employees. No contractors work on this role. 9
Average shift length Info Average shift length. Calculated as total hours divided by days worked and average staff per day. 9 hours
Licensed Practical Nurse

Assists with medical care and medications.

LPN Staff Info All 11 LPN Staff are full-time employees. No contractors work on this role. 11
Average shift length Info Average shift length. Calculated as total hours divided by days worked and average staff per day. 9 hours
Certified Nursing Assistant

Helps with daily care and mobility.

CNA Staff Info All 40 CNA Staff are full-time employees. No contractors work on this role. 40
Average shift length Info Average shift length. Calculated as total hours divided by days worked and average staff per day. 8.6 hours

Contractor staffing

Q4 2025 · Oct 1 – Dec 31 More info This data comes from the CMS Payroll-Based Journal report covering October 1 – December 31, 2025.

Total hours from contractors

1.8%

403 contractor hours this quarter

Occupational Therapy Assistant: 3 Mental Health Service Worker: 1

Staff by category

Q4 2025 · Oct 1 – Dec 31 More info This data comes from the CMS Payroll-Based Journal report covering October 1 – December 31, 2025.
Certified Nursing Assistant400407,36592100%8.6
Licensed Practical Nurse110113,49692100%9
Registered Nurse9092,35792100%9
Medication Aide/Technician100102,08292100%7.4
Clinical Nurse Specialist4041,7526470%8
Other Dietary Services Staff4048528997%6.7
Physical Therapy Assistant4046646571%6.1
Administrator1014565762%8
Dietitian1014565762%8
Occupational Therapy Aide1014245358%8
Nurse Practitioner1013924953%8
Qualified Social Worker3033856267%4.5
Mental Health Service Worker0113764751%8
Respiratory Therapy Technician7073226166%4.1
Speech Language Pathologist1012904852%6
Medical Director1011324448%3
Dental Services Staff1011121415%8
Occupational Therapy Assistant033282628%1
40 Certified Nursing Assistant
% of Days 100%
11 Licensed Practical Nurse
% of Days 100%
9 Registered Nurse
% of Days 100%
10 Medication Aide/Technician
% of Days 100%
4 Clinical Nurse Specialist
% of Days 70%
4 Other Dietary Services Staff
% of Days 97%
4 Physical Therapy Assistant
% of Days 71%
1 Administrator
% of Days 62%
1 Dietitian
% of Days 62%
1 Occupational Therapy Aide
% of Days 58%
1 Nurse Practitioner
% of Days 53%
3 Qualified Social Worker
% of Days 67%
1 Mental Health Service Worker
% of Days 51%
7 Respiratory Therapy Technician
% of Days 66%
1 Speech Language Pathologist
% of Days 52%
1 Medical Director
% of Days 48%
1 Dental Services Staff
% of Days 15%
3 Occupational Therapy Assistant
% of Days 28%

Penalties and fines

Includes penalties issued in 2023

Federal penalties imposed by CMS for regulatory violations, including civil money penalties (fines) and denials of payment for new Medicare/Medicaid admissions.

Source: CMS Penalties Database (Data as of Jan 2026)

Total fines amount $7K
83% lower than Kansas average

Kansas average: $44K

Number of fines 1
59% fewer fines than Kansas average

Kansas average: 2.4

Payment Denials Info Serious action where Medicare and/or Medicaid temporarily stops payments for new residents until issues are fixed. 0
100% fewer payment denials than Kansas average

Kansas average: 0.3

Fines amount comparison
This facility $7K
Kansas average $44K
Penalty History

Penalties are imposed by CMS for violations of federal nursing home regulations.

1 penalty in the past 3 years

Oct 16, 2023 · $7K

Civil Money Penalty Info Fines imposed for noncompliance, which can be assessed per day or per instance of violation. Oct 16, 2023
$7K

Last updated: Jan 2026

Quality of care over time

These measures show how residents usually do over time at this home, based on health outcomes and preventive care.

High-risk clinical events score Info A composite score based on pressure ulcers, falls with injury, weight loss, walking ability decline, and activities of daily living decline. 13.2
26% worse than Kansas average

Kansas average: 10.5

Functional decline score Info A composite score based on activities of daily living decline, walking ability decline, and incontinence. 25.0
20% worse than Kansas average

Kansas average: 20.7

Long-stay resident measures
Need for Help with Daily Activities Increased Info Percent of long-stay residents whose need for help with daily activities has increased 18.4%
In line with Kansas average

Kansas average: 19.0%

Walking Ability Worsened Info Percent of long-stay residents whose ability to move independently worsened 34.4%
77% worse than Kansas average

Kansas average: 19.4%

Low Risk Residents with Bowel/Bladder Incontinence Info Percent of low risk long-stay residents who lose control of their bowels or bladder 22.1%
7% better than Kansas average

Kansas average: 23.8%

Falls with Major Injury Info Percent of long-stay residents experiencing one or more falls with major injury 6.4%
46% worse than Kansas average

Kansas average: 4.4%

High Risk Residents with Pressure Ulcers Info Percent of long-stay high risk residents with pressure ulcers 5.7%
23% worse than Kansas average

Kansas average: 4.6%

Urinary Tract Infection Info Percent of long-stay residents with a urinary tract infection 2.1%
32% better than Kansas average

Kansas average: 3.1%

Lost Too Much Weight Info Percent of long-stay residents who lose too much weight 1.2%
76% better than Kansas average

Kansas average: 5.1%

Depressive Symptoms Info Percent of long-stay residents who have depressive symptoms 0.0%
100% better than Kansas average

Kansas average: 5.2%

Antipsychotic Use Info Percent of long-stay residents who received an antipsychotic medication 5.7%
66% better than Kansas average

Kansas average: 16.9%

Pneumococcal Vaccine Info Percent of long-stay residents assessed and appropriately given the pneumococcal vaccine 98.6%
7% better than Kansas average

Kansas average: 91.9%

Influenza Vaccine Info Percent of long-stay residents assessed and appropriately given the seasonal influenza vaccine 100.0%
5% better than Kansas average

Kansas average: 95.5%

Short-stay resident measures
Pneumococcal Vaccine Info Percent of short-stay residents assessed and appropriately given the pneumococcal vaccine 87.6%
16% better than Kansas average

Kansas average: 75.6%

Antipsychotic medication increase Info Percent of short-stay residents who newly received an antipsychotic medication 4.9%
126% worse than Kansas average

Kansas average: 2.2%

Influenza Vaccine Info Percent of short-stay residents assessed and appropriately given the seasonal influenza vaccine 94.9%
29% better than Kansas average

Kansas average: 73.5%

Breakdown by payment type

Medicare

41% of new residents, usually for short-term rehab.

Typical stay 26 days

Private pay

59% of new residents, often for short stays.

Typical stay 8 - 9 months

Facility Characteristics

Source: CMS Long-Term Care Facility Characteristics (Data as of Jan 2026)

Total residents 40
Medicare
5
12.5% of residents
Private pay or other
35
87.5% of residents
Programs & Services
Residents Group

Residents meet regularly to discuss policies, care quality, and activities

CCRC

Part of a Continuing Care Retirement Community offering multiple care levels

Active Resident Council

Organized group of residents that meets regularly to discuss facility policies, quality of life, and activities.

Finances and operations

Based on CMS SNF Cost Report for fiscal year ending in 12/2023.

Privately-owned community
Operated by a single business entity.
Net patient revenue Info Net patient revenue — what the home actually collects for resident care, after contractual allowances, bad debt and discounts are subtracted from its gross charges (CMS cost report, Worksheet G-3). It covers resident care only; money the home earns from other sources is shown separately as "Other income."
$7.6M
Net patient income Info Net patient income: net patient revenue minus the home's total operating expenses. A positive figure means it earns more from resident care than it spends to deliver it; a negative figure means the opposite. It excludes non-operating "other income."
-$50.4M
Privately-owned community Operated by a single business entity.
Net patient revenue Info Net patient revenue — what the home actually collects for resident care, after contractual allowances, bad debt and discounts are subtracted from its gross charges (CMS cost report, Worksheet G-3). It covers resident care only; money the home earns from other sources is shown separately as "Other income."
$7.6M
Net patient income Info Net patient income: net patient revenue minus the home's total operating expenses. A positive figure means it earns more from resident care than it spends to deliver it; a negative figure means the opposite. It excludes non-operating "other income."
-$50.4M
Other income Info Money the home earns outside of resident care — such as investments, grants, rentals and other non-operating sources (CMS cost report, Worksheet G-3). It is tracked separately from net patient revenue: it is not part of that figure, and it is not included in net patient income.
$50.1M
Payroll costs Info Staff salaries plus wage-related costs — benefits such as payroll taxes, health insurance and retirement — from the home's own accounting records (CMS cost report, Worksheet A). Contract or agency labor is counted separately, under other operating costs.
$19.5M 257.3% of net patient revenue Info Payroll as a share of revenue: staff salaries and wage-related benefits divided by net patient revenue. A higher figure means more of each revenue dollar goes to staff pay.
Other operating costs Info Everything it costs to run the home apart from payroll — food, utilities, supplies, maintenance, contract labor and administration. Calculated as total operating expense minus payroll (staff salaries and wage-related benefits).
$38.5M
Total costs Info The home's total operating expense for the year — all the costs of running it, salaries included (CMS cost report, Worksheet G-3).
$58.0M

What does this home offer?

Housing options icon

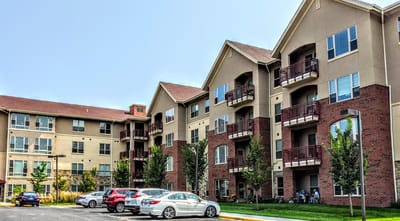
Housing Options: 1 Bed / 2 Bed

Building type icon
Building type icon

Building Type: Mid-rise

Social and recreational activities icon

Social and Recreational Activities

Exercise program icon

Exercise Programs

Swimming pool icon
Swimming pool icon

Swimming Pool

Who this home usually serves

TYPE OF STAY

Mix of rehab and long-term care

This home supports both short-term rehab and long-term care, with residents staying for a wide range of durations.

Most new residents arrive under private pay (59% of admissions), and a typical private pay stay runs around 8 - 9 months.

Admissions
92 total

Coverage residents most often arrive under.

Medicare 41%
Private pay 59%
Discharges
98 total

Coverage residents most often leave under.

Medicare 42%
Private pay 56%
Medicaid 2%

Places of interest near Tallgrass Creek Senior Living Community

Address 7.3 miles from city center Info Estimated distance in miles from Overland Park's city center to Tallgrass Creek Senior Living Community's address, calculated via Google Maps.

Calculate Travel Distance to Tallgrass Creek Senior Living Community

Add your location

Address

Compare Nursing Homes around Overland Park

5 facilities compared · CMS & KS Dept. of Health data

Tallgrass Creek Senior Living Community
NH
IL
Overland Park (Metcalf Avenue)
116
Facility 116
KS AVG 69
Rank #29 / 224
95.8% +21%5.09 -14%+10%$7.4k174.3138-
75
Facility 75
KS AVG 46
Rank #39 / 363
Adam Dickson$7.6M$19.5M257.3%175541
Village Shalom Inc
NH
AL
IL
MC
RC
Overland Park (6850)
66
Facility 66
KS AVG 69
Rank #87 / 224
98.5% +24%6.86 -48%+48%$16.2k328.0255-
22
Facility 22
KS AVG 46
Rank #299 / 363
Michael Abrams$22.7M$10.7M47%175441
Delmar Gardens of Overland Park
NH
AL
IL
MC
Overland Park (South Lakes)
120
Facility 120
KS AVG 69
Rank #24 / 224
67.5% -15%3.31 -65%-29%$23.3k5317.7181-
92
Facility 92
KS AVG 46
Rank #1 / 363
Tammy Conekin$9.9M$6.9M69.7%175182
Colonial Village Overland Park
NH
AL
IL
MC
Overland Park
82
Facility 82
KS AVG 69
Rank #56 / 224
84.1% +6%4.73 -36%+2%$0289.3137-
45
Facility 45
KS AVG 46
Rank #199 / 363
Dan Chik$10.0M$3.5M35.3%175560
ManorCare Health Services-Overland Park
NH
AL
IL
Overland Park
140
Facility 140
KS AVG 69
Rank #11 / 224
86.5% +9%3.79 -37%-18%$59.7k567.04112-
35
Facility 35
KS AVG 46
Rank #240 / 363
-$6.5M$3.6M55.3%175180

Financial Assistance for
Nursing Home in Kansas

Tallgrass Creek Senior Living Community is located in Overland Park, Kansas.
Here are the financial assistance programs available to residents in Kansas.

Get Financial aid guidance

Frail Elderly Waiver

Kansas Medicaid FE Waiver

Age 65+
General Kansas resident, Medicaid-eligible, nursing home- level care need.
Income Limits (2025) ~$2,829/month 300% FBR, individual
Asset Limits $2,000 (individual), $3,000 (couple).
KS

Requires care level assessment.

Benefits
Personal care (5-7 hours/day) Respite (240 hours/year) Adult day care (~$60/day) Home aides

Senior Care Act

Kansas SCA

Age 60+
General Kansas resident, at risk of nursing home.
Income Limits ~$1,800/month individual, varies
Asset Limits $2,000 individual
KS

Limited funding; waitlists common.

Benefits
In-home care (3-5 hours/week) Respite (up to 10 days/year) Homemaker services

Medicare Savings Program (MSP)

Kansas Medicare Savings Program

Age 65+ or disabled
General Kansas resident, Medicare Part A/B.
Income Limits (2025) ~$2,510/month (QMB), ~$3,380/month (SLMB), ~$3,598/month (QI)—individual.
Asset Limits $9,430 (individual), $14,130 (couple).
KS

Three tiers; no waitlist.

Benefits
Covers Part B premiums ($174.70/month) Deductibles ($240/year) Copays (~20%)

National Family Caregiver Support Program (NFCSP) Respite

Kansas NFCSP Respite Care

Age
General Caregivers of 60+ needing care or 55+ caregivers of others; Kansas resident; functional needs (2+ ADLs).
Income Limits (2025) Prioritizes ~$24,980/year (individual); no strict cap.
Asset Limits Not assessed; need-based.
KS

11 AAAs; prioritizes low-income, rural caregivers.

Benefits
Respite (4-6 hours/week or 5 days/year) Adult day care ($60/day) Caregiver training

VA Aid and Attendance (A&A) and Housebound Benefits

Kansas VA Aid and Attendance/Housebound

Age 65+ or disabled veteran/spouse
General Kansas resident, wartime service, need for ADL help (A&A) or homebound.
Income Limits (2025) Net income < ~$1,984/month (veteran with dependent, A&A); pension offsets income.
Asset Limits ~$155,356 net worth limit
KS

High veteran demand in rural/urban areas.

Benefits
Cash (~$1,433-$2,642/month veteran, ~$951-$1,318 spouse) for care costs (e.g., in-home, assisted living)

Frequently Asked Questions about Tallgrass Creek Senior Living Community

What neighborhood is Tallgrass Creek Senior Living Community in?

Tallgrass Creek Senior Living Community is in the Metcalf Avenue neighborhood of Overland Park.

Who is the owner of Tallgrass Creek Senior Living Community?

The legal owner and operator of Tallgrass Creek Senior Living Community is Redwood-Erc Kansas Llc.

Is Tallgrass Creek Senior Living Community in a walkable area?

Tallgrass Creek Senior Living Community has a walk score of 75. Very walkable. Most errands can be accomplished on foot, and many essentials are within a short walk.

What is the license number of Tallgrass Creek Senior Living Community?

According to KS state health department records, Tallgrass Creek Senior Living Community's license number is 175541.

What is the occupancy rate at Tallgrass Creek Senior Living Community?

Tallgrass Creek Senior Living Community's occupancy is 96%.

Who is the administrator of Tallgrass Creek Senior Living Community?

Sonya Martin is the administrator of Tallgrass Creek Senior Living Community.

How many beds does Tallgrass Creek Senior Living Community have?

Tallgrass Creek Senior Living Community has 116 beds.

Guides for Better Senior Living

Care Cost Calculator: See Prices in Your Area

Nursing Home Data Explorer

Don’t Wait Too Long: 7 Red Flag Signs Your Parent Needs Assisted Living Now

The True Cost of Assisted Living in 2025 – And How Families Are Paying For It

Understanding Senior Living Costs: Pricing Models, Discounts & Financial Assistance