Explore Open Rooms

1 Contact details
2 What type of senior care service are you looking for?
3 What budget do you have in mind for senior care?
4 How soon do you need to find care?
5 Additional details

Thank you for your interest!

Our team will be in touch shortly to help with next steps.

Nursing Home

The Gables on Pelham

Nursing Home

The Gables on Pelham

1306 Pelham Rd, Greenville, SC 29615 View map
Overview of The Gables on Pelham

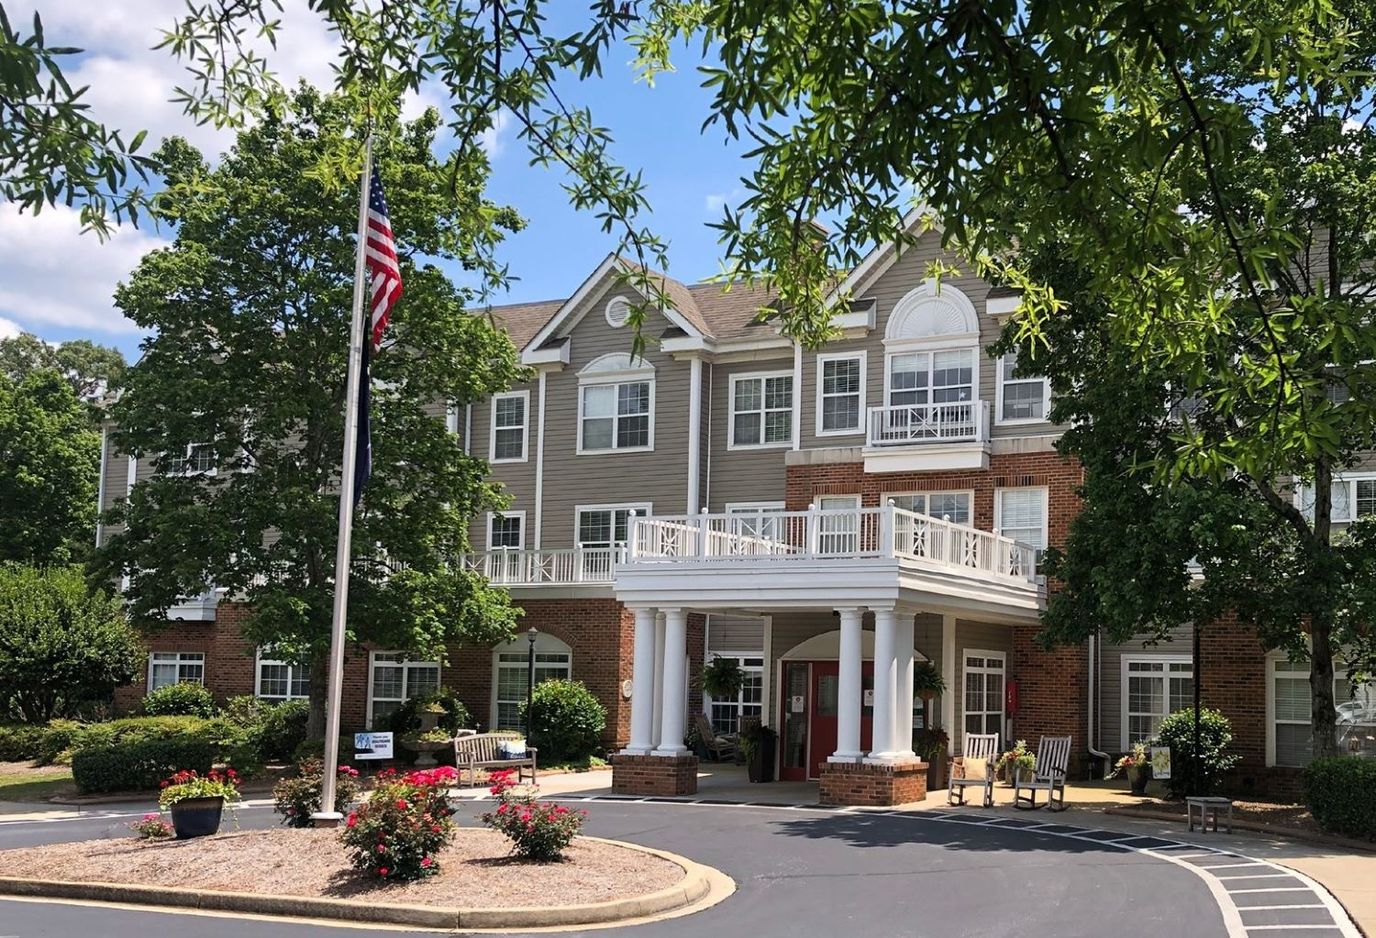
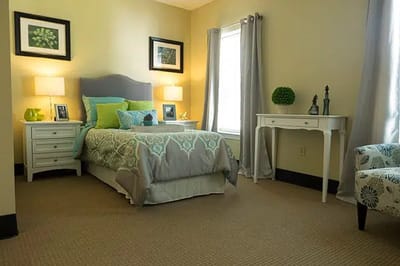
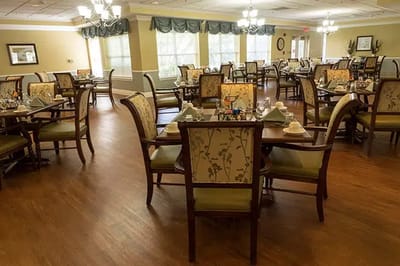
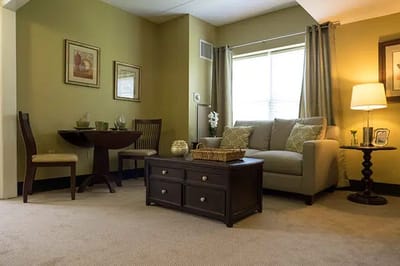
The Gables on Pelham is one of the trusted assisted senior living communities in the city– offering assisted living, memory care, and skilled nursing. They understand that an enriching senior living experience begins with the right lifestyle that reinvents the meaning of senior care. The home-like community enriches and encourages all residents to still live freely on their own terms while receiving the necessary support. The Gables is a home that honors your trust in them; they ensure that seniors are given the utmost level of care and respect.

The vibrant home offers a list of services that include 24-hour nursing supervision, transportation, housekeeping, medication management, an emergency call response system in every room, and cozy outdoor and indoor common areas. Other activities include movie nights, fitness classes, and other scheduled social events. 

(864) 286-6600

Quality ratings

Measured by Centers for Medicare & Medicaid Services (CMS)

Overall rating Info The Overall CMS Rating combines results from health inspections, staffing levels and quality measures. Health inspections carry the most weight. Staffing and quality scores can increase or decrease the final rating based on performance compared to state and national standards.
1/5
South Carolina average: 2.9/5
Health Inspection Info Based on the results of the facility's three most recent standard inspections and any complaint investigations. CMS reviews the number, scope, and severity of deficiencies, with more recent findings weighted more heavily.
1/5
South Carolina average: 2.7/5
Staffing Info Measures average nursing staff hours per resident per day, including Registered Nurses (RNs) and total nursing staff. Ratings are adjusted based on the level of care residents require and are compared to state and national benchmarks.
3/5
South Carolina average: 3.0/5
Quality Measures Info Based on clinical and physical health indicators reported to CMS, such as hospital readmissions, falls, pressure ulcers, and improvements in mobility. These measures reflect how well residents' health needs are being managed.
2/5
South Carolina average: 3.5/5

Nursing care per resident

Info This shows how many total hours of nursing staff time are available per resident each day. Higher numbers usually mean more staff support.
3h 53m per day

This home provides 5% less nursing time per resident than the South Carolina average.

South Carolina average: 4h 5m per day

Staffing hours breakdown

Info Hours of care per resident per day, broken down by staff type. Data from CMS Medicare.
Staff type Facility State avg National avg
Registered Nurse (RN) Info Registered nurse hours per resident per day. 37m per day 38m per day 41m per day
Nurse Aide Info Nurse aide hours per resident per day. 2h 27m per day 2h 13m per day 2h 21m per day
Total Nursing (Weekend) Info Total number of nurse staff hours per resident per day on weekends. 3h 56m per day 3h 20m per day 3h 26m per day
Physical Therapist Info Physical therapist staff hours per resident per day. 2m per day 5m per day 4m per day
RN (Weekend) Info Registered nurse hours per resident per day on weekends. 18m per day 24m per day 29m per day

Capacity and availability

Medium-capacity home

Offers a balance of services and community atmosphere.

Total beds 119

This home usually has availability

Lower occupancy suggests more openings may be available.

Lower demand than the South Carolina average
Occupancy rate 72.2%
Residents per day (avg) 28
Occupancy rate
72.2%
Residents per day (avg)
28

Who this home usually serves

TYPE OF STAY

Mix of rehab and long-term care

This home supports both short-term rehab and long-term care, with residents staying for a wide range of durations.

Breakdown by payment type

Medicare

46% of new residents, usually for short-term rehab.

Typical stay 1 - 2 months

Private pay

54% of new residents, often for short stays.

Typical stay 7 months

Finances and operations

Privately-owned community
Operated by a business corporation.
Home revenue
$8.3M
Surplus of revenue
$0
Privately-owned community Operated by a business corporation.
Home revenue
$8,260,698.00
Surplus of revenue
$0.00
Payroll costs Info The portion of the home's budget spent on staff, including nurses, caregivers, and other employees who support care and operations.
$4.0M
48.4% of revenue
Other operating costs Info All remaining costs needed to run the home, such as food, utilities, building maintenance, supplies and administrative expenses.
$4.3M
Total costs $8.3M
Bed community size
119-bed community
A larger shared setting that may offer more common spaces and organized community services.
Walk Score
Walk Score: 14 / 100
Car-dependent. Most errands require a car, with limited nearby walkable options.

About this community

Occupancy

Occupancy rate
72%
In line with South Carolina average
Occupied beds
86 / 119
Average residents 90 per day

License details

Facility type
Community Residential Care Facilities
Status Active
Expiration May 31, 2026
County: Greenville

Additional licensing details

License number: CRC-2398

Ownership & operating entity

The Gables on Pelham is legally operated by GABLES ON PELHAM RETIREMENT LLC, and administrated by PRICE, MEGHAM.

Ownership type: Limited Liability

Care Services

Offers Alzheimer's Care
Dedicated Alzheimer's Unit

Contact Information

Types of Care at The Gables on Pelham

Assisted Living Memory Care Nursing Home
Contact The Gables on Pelham

Inspection History

In South Carolina, the Department of Public Health, Bureau of Healthcare Quality conducts unannounced inspections to ensure care providers meet all health and safety codes.

4 visits/inspections

2 visits/inspections triggered by complaints

1 routine inspections

Results

3 with issues

1 without issues

Latest inspection

Date:July 24, 2025
Type:Routine

10 deficiencies

Deficiencies indicate regulatory issues. A higher number implies the facility had several areas requiring improvement.

Health Inspection History

Inspections
Total health inspections 3

South Carolina average 3.9


Last Health inspection on Jul 2025

Total health citations 10

South Carolina average 13.7

Citations per inspection
3.33

South Carolina average 3.44


Health citations are formal notices following inspections when they fail to comply with safety and care standards.

7 of 10 citations resulted from standard inspections; and 3 of 10 resulted from complaint investigations.

Breakdown of citation severity (last 3 years)
Critical Health citations More info 2
100% worse than South Carolina average

South Carolina average: 1


Serious Health citations More info 0
100% better than South Carolina average

South Carolina average: 0.3

2 critical citations More info South Carolina average: 1

0 serious citations More info South Carolina average: 0.3

8 moderate citations More info South Carolina average: 12.3

0 minor citations More info South Carolina average: 0.1
Citations history (last 3 years)
Infection Control moderate citation Info Issues related to preventing and controlling infections, including hygiene practices and safety protocols. Jul 24, 2025
Corrected

Nutrition moderate citation Info Issues related to food quality, meal service, and resident's nutritional needs. Jul 24, 2025
Corrected

Pharmacy moderate citation Info Issues related to medication management, including how drugs are stored, administered, and monitored. Jul 24, 2025
Corrected

Resident Rights moderate citation Info Issues related to resident's rights, including dignity, privacy, and the ability to make decisions about their care. Jul 24, 2025
Corrected

Compare Nursing Homes around Greenville The information below is reported by the South Carolina Department of Public Health, Bureau of Healthcare Quality.

5 facilities compared · CMS & SC Dept. of Health data · Updated Mar 2026

Cherrydale Post Acute
NH

Nursing Home Licensed facility providing 24/7 skilled nursing care for residents with complex, ongoing medical needs. Staffed by RNs, LPNs, and CNAs. Inspected and star-rated annually by CMS. Accepts Medicare (short-term rehab) and Medicaid (long-term care).

AL

Assisted Living A licensed, long-term care setting for seniors or individuals with disabilities who need help with daily activities — like bathing, dressing, and medication management — but not 24-hour skilled nursing. Offers housing, meals, and around-the-clock support while aiming to maximize resident independence.

GREENVILLE
132
87.7%
+7%
3.08
+52%
-23%
1
8
2
127
-
Sc Master Tenant, Llc
$6,1M
$1,8M
28.9%
425106
-
Greenville Post Acute
NH

Nursing Home Licensed facility providing 24/7 skilled nursing care for residents with complex, ongoing medical needs. Staffed by RNs, LPNs, and CNAs. Inspected and star-rated annually by CMS. Accepts Medicare (short-term rehab) and Medicaid (long-term care).

AL

Assisted Living A licensed, long-term care setting for seniors or individuals with disabilities who need help with daily activities — like bathing, dressing, and medication management — but not 24-hour skilled nursing. Offers housing, meals, and around-the-clock support while aiming to maximize resident independence.

GREENVILLE
132
93.7%
+14%
3.59
+22%
-10%
1
19
0
126
-
Stanger, Brock
$18,3M
$5,1M
28%
425042
-
The Gables on Pelham
AL

Assisted Living A licensed, long-term care setting for seniors or individuals with disabilities who need help with daily activities — like bathing, dressing, and medication management — but not 24-hour skilled nursing. Offers housing, meals, and around-the-clock support while aiming to maximize resident independence.

MC

Memory Care Secured, specialized care for people living with Alzheimer's or dementia. Staff trained in cognitive impairment, with higher staff-to-resident ratios and an environment designed to reduce confusion and wandering risk.

NH

Nursing Home Licensed facility providing 24/7 skilled nursing care for residents with complex, ongoing medical needs. Staffed by RNs, LPNs, and CNAs. Inspected and star-rated annually by CMS. Accepts Medicare (short-term rehab) and Medicaid (long-term care).

Greenville
45
72.2%
-12%
3.88
-42%
-3%
2
10
2
28
14
Fsl Senior Living Ventures, Llc
$8,2M
$4,0M
48.5%
425373
-
Kauhale Pettigru
-
NH

Nursing Home Licensed facility providing 24/7 skilled nursing care for residents with complex, ongoing medical needs. Staffed by RNs, LPNs, and CNAs. Inspected and star-rated annually by CMS. Accepts Medicare (short-term rehab) and Medicaid (long-term care).

AL

Assisted Living A licensed, long-term care setting for seniors or individuals with disabilities who need help with daily activities — like bathing, dressing, and medication management — but not 24-hour skilled nursing. Offers housing, meals, and around-the-clock support while aiming to maximize resident independence.

GREENVILLE
115
-
-
-
-
-
-
-
-
0
0
0
-
-
-
-
-
-
-
-
Linville Court at The Cascades Verdae
-
AL

Assisted Living A licensed, long-term care setting for seniors or individuals with disabilities who need help with daily activities — like bathing, dressing, and medication management — but not 24-hour skilled nursing. Offers housing, meals, and around-the-clock support while aiming to maximize resident independence.

MC

Memory Care Secured, specialized care for people living with Alzheimer's or dementia. Staff trained in cognitive impairment, with higher staff-to-resident ratios and an environment designed to reduce confusion and wandering risk.

NH

Nursing Home Licensed facility providing 24/7 skilled nursing care for residents with complex, ongoing medical needs. Staffed by RNs, LPNs, and CNAs. Inspected and star-rated annually by CMS. Accepts Medicare (short-term rehab) and Medicaid (long-term care).

Greenville
44
-
-
-
-
-
-
-
-
0
0
0
-
8
Cascades Nursing Llc
-
-
-
-
1 bed

Places of interest near The Gables on Pelham

Address 5.8 miles from city center — 0.91 miles to nearest hospital (GHS Children's Hospital Pediatric Endocrinology)

Address 1306 Pelham Rd, Greenville, SC 29615

Calculate Travel Distance to The Gables on Pelham

Add your location

Address

Staffing Data (Q2 2025)

This data corresponds to Q2 2025 and is based on CMS Payroll-Based Journal.

Total staff 54
Employees 46
Contractors 8
Staff to resident ratio 0:0
100% worse than South Carolina average

South Carolina average ratio: 1.80:1

Avg staff/day 17
Average shift 7.4 hours
6% worse than South Carolina average

South Carolina average: 7.9 hours

Total staff hours (quarter) 11,447
Nursing staff breakdown
Registered Nurse

Manages medical care and health needs.

Total count 3
Average shift length Info Average shift length. Calculated as total hours divided by days worked and average staff per day. 8.1 hours

No contractors work on this role.

Licensed Practical Nurse

Assists with medical care and medications.

Total count 15
Average shift length Info Average shift length. Calculated as total hours divided by days worked and average staff per day. 9.5 hours

No contractors work on this role.

Certified Nursing Assistant

Helps with daily care and mobility.

Total count 21
Average shift length Info Average shift length. Calculated as total hours divided by days worked and average staff per day. 6.9 hours

No contractors work on this role.

Contractor staffing

Total hours from contractors

3.6%

415 contractor hours this quarter

Physical Therapy Aide: 2 Medical Director: 1 Occupational Therapy Assistant: 1 Respiratory Therapy Technician: 1 Qualified Social Worker: 1 Speech Language Pathologist: 1 Physical Therapy Assistant: 1
Staff by category
Certified Nursing Assistant210215,43891100%6.9
Licensed Practical Nurse150153,37691100%9.5
Nurse Practitioner1015126470%8
Clinical Nurse Specialist2025046268%8
Administrator1014966268%8
Registered Nurse3033984549%8.1
Dental Services Staff1011762224%8
Other Dietary Services Staff1011281719%7.5
Qualified Social Worker0111182123%5.6
Medical Director011862224%3.9
Physical Therapy Aide022672224%2.9
Speech Language Pathologist011652224%3
Respiratory Therapy Technician011432123%2.1
Physical Therapy Assistant011181213%1.5
Occupational Therapy Assistant0111855%3.5
Medication Aide/Technician101511%5
21 Certified Nursing Assistant
% of Days 100%
15 Licensed Practical Nurse
% of Days 100%
1 Nurse Practitioner
% of Days 70%
2 Clinical Nurse Specialist
% of Days 68%
1 Administrator
% of Days 68%
3 Registered Nurse
% of Days 49%
1 Dental Services Staff
% of Days 24%
1 Other Dietary Services Staff
% of Days 19%
1 Qualified Social Worker
% of Days 23%
1 Medical Director
% of Days 24%
2 Physical Therapy Aide
% of Days 24%
1 Speech Language Pathologist
% of Days 24%
1 Respiratory Therapy Technician
% of Days 23%
1 Physical Therapy Assistant
% of Days 13%
1 Occupational Therapy Assistant
% of Days 5%
1 Medication Aide/Technician
% of Days 1%

Quality of care over time

These measures show how residents usually do over time at this home, based on health outcomes and preventive care.

High-risk clinical events score Info A composite score based on pressure ulcers, falls with injury, weight loss, walking ability decline, and activities of daily living decline. 15.2
74% worse than South Carolina average

South Carolina average: 8.7

Functional decline score Info A composite score based on activities of daily living decline, walking ability decline, and incontinence. 26.0
68% worse than South Carolina average

South Carolina average: 15.5

Long-stay resident measures
Average South Carolina avg: 4.0 Info CMS star rating based on long-stay quality measure performance. 5 stars = significantly above average, 1 star = significantly below average.
Need for Help with Daily Activities Increased Info Percent of long-stay residents whose need for help with daily activities has increased 34.8%
166% worse than South Carolina average

South Carolina average: 13.1%

Low Risk Residents with Bowel/Bladder Incontinence Info Percent of low risk long-stay residents who lose control of their bowels or bladder 17.3%
In line with South Carolina average

South Carolina average: 17.0%

Falls with Major Injury Info Percent of long-stay residents experiencing one or more falls with major injury 4.9%
65% worse than South Carolina average

South Carolina average: 3.0%

High Risk Residents with Pressure Ulcers Info Percent of long-stay high risk residents with pressure ulcers 1.8%
71% better than South Carolina average

South Carolina average: 6.1%

Urinary Tract Infection Info Percent of long-stay residents with a urinary tract infection 3.4%
106% worse than South Carolina average

South Carolina average: 1.6%

Lost Too Much Weight Info Percent of long-stay residents who lose too much weight 19.2%
212% worse than South Carolina average

South Carolina average: 6.2%

Depressive Symptoms Info Percent of long-stay residents who have depressive symptoms 1.9%
31% better than South Carolina average

South Carolina average: 2.8%

Antipsychotic Use Info Percent of long-stay residents who received an antipsychotic medication 16.4%
13% worse than South Carolina average

South Carolina average: 14.5%

Pneumococcal Vaccine Info Percent of long-stay residents assessed and appropriately given the pneumococcal vaccine 95.1%
5% better than South Carolina average

South Carolina average: 90.5%

Hospitalizations per 1,000 days Info Number of hospitalizations per 1,000 long-stay resident days. 1.34
34% better than South Carolina average

South Carolina average: 2.03

ED visits per 1,000 days Info Number of outpatient emergency department visits per 1,000 long-stay resident days. 1.32
31% better than South Carolina average

South Carolina average: 1.91

Short-stay resident measures
Significantly below average South Carolina avg: 3.4 Info CMS star rating based on short-stay quality measure performance. 5 stars = much above average, 1 star = much below average.
Pneumococcal Vaccine Info Percent of short-stay residents assessed and appropriately given the pneumococcal vaccine 93.6%
18% better than South Carolina average

South Carolina average: 79.5%

Antipsychotic medication increase Info Percent of short-stay residents who newly received an antipsychotic medication 5.6%
230% worse than South Carolina average

South Carolina average: 1.7%

Influenza Vaccine Info Percent of short-stay residents assessed and appropriately given the seasonal influenza vaccine 92.1%
18% better than South Carolina average

South Carolina average: 78.0%

Re-hospitalized after SNF stay Info Percentage of short-stay residents who were re-hospitalized after their nursing home admission. 29.4%
19% worse than South Carolina average

South Carolina average: 24.7%

Emergency department visits Info Percentage of short-stay residents who had an outpatient emergency department visit. 18.7%
33% worse than South Carolina average

South Carolina average: 14.1%

Falls with major injury Info Percentage of SNF residents who experience falls with major injury during their stay. 9.0%
1068% worse than South Carolina average

South Carolina average: 0.8%

Ability to care for self at discharge Info Percentage of residents at or above expected ability to care for themselves at discharge. 54.2%
In line with South Carolina average

South Carolina average: 53.7%

Successful return to home or community Info Rate of successful return to home or community from a skilled nursing facility. 42.6%
16% worse than South Carolina average

South Carolina average: 50.6%

Penalties and fines

Federal penalties imposed by CMS for regulatory violations, including civil money penalties (fines) and denials of payment for new Medicare/Medicaid admissions.

Source: CMS Penalties Database (Data as of Jan 2026)

Total fines amount $11K
67% lower than South Carolina average

South Carolina average: $34K

Number of fines 2
18% fewer fines than South Carolina average

South Carolina average: 2.4

Payment Denials Info Serious action where Medicare and/or Medicaid temporarily stops payments for new residents until issues are fixed. 0
100% fewer payment denials than South Carolina average

South Carolina average: 0.1

Fines amount comparison
This facility $11K
South Carolina average $34K
Penalty History

Penalties are imposed by CMS for violations of federal nursing home regulations.

Civil Money Penalty Info Fines imposed for noncompliance, which can be assessed per day or per instance of violation. Feb 10, 2025
$6K
Civil Money Penalty Info Fines imposed for noncompliance, which can be assessed per day or per instance of violation. Feb 10, 2025
$6K

Last updated: Jan 2026

Guides for Better Senior Living

Care Cost Calculator: See Prices in Your Area

Nursing Home Data Explorer

Don’t Wait Too Long: 7 Red Flag Signs Your Parent Needs Assisted Living Now

The True Cost of Assisted Living in 2025 – And How Families Are Paying For It

Understanding Senior Living Costs: Pricing Models, Discounts & Financial Assistance

Financial Aid for South Carolina Seniors

Get financial aid guidance

Community Long Term Care (CLTC)

SC Medicaid CLTC

Age 65+ or disabled, South Carolina resident, Medicaid-eligible, nursing home-level care need.

~$2,829/month (300% FBR, individual).

$2,000 (individual), $3,000 (couple).

High rural demand; waitlists possible.

South Carolina Respite Care Program

SC NFCSP Respite

Caregiver of someone 60+ (or with dementia), South Carolina resident.

No strict limit; prioritizes low-income.

Not applicable.

Limited slots; rural/urban balance.

Medicare Savings Program (MSP)

South Carolina Medicare Savings Program

Age 65+ or disabled, SC resident, Medicare Part A/B.

~$2,510/month (QMB), ~$3,380/month (SLMB), ~$3,598/month (QI)—individual.

$9,430 (individual), $14,130 (couple).

Three tiers; includes Extra Help for Part D; no waitlist.

Low-Income Home Energy Assistance Program (LIHEAP)

South Carolina LIHEAP

Age 60+ prioritized, SC resident, low-income household.

~$3,970/month (individual, 185% FPL).

Not assessed; income-focused.

Covers gas, electric, oil; emergency aid via ECAP (~$500 max).

Senior Community Service Employment Program (SCSEP)

South Carolina SCSEP

Age 55+, unemployed, low-income, SC resident.

~$1,983/month (125% FPL).

Not specified; income-focused.

Priority for veterans, rural residents; Goodwill/AARP partnership.

VA Aid and Attendance (A&A) and Housebound Benefits

South Carolina VA Aid and Attendance/Housebound

Age 65+ or disabled veteran/spouse, SC resident, wartime service, need for ADL help (A&A) or homebound.

Net income < ~$1,984/month (veteran with dependent, A&A); pension offsets income.

~$155,356 (net worth limit).

High veteran population; supports rural/urban care needs.

Senior Farmers’ Market Nutrition Program (SFMNP)

South Carolina SFMNP

Age 60+, SC resident, low-income.

~$2,322/month (individual, 185% FPL).

Not assessed.

Vouchers (~$50/season); serves ~20,000 annually via 10 AAAs.

Homestead Exemption Program

South Carolina Homestead Exemption

Age 65+ (or disabled/blind), SC resident 1+ year, homeowner.

None; tax-based eligibility.

Not assessed; home-focused.

Saves ~$500-$1,000/year avg.; applies to primary residence.

Elderly Simplified Application Project (ESAP)

South Carolina ESAP (SNAP for Seniors)

Age 60+, SC resident, no earned income, not on SCCAP.

~$1,732/month (133% FPL, individual).

$4,250 (individual, higher than standard SNAP).

Simplified process; serves ~50,000 seniors annually.

Tour Icon
Planning a tour? Check our touring checklist.
Chat Icon
Thinking of living here? We can help you speak to a current resident