


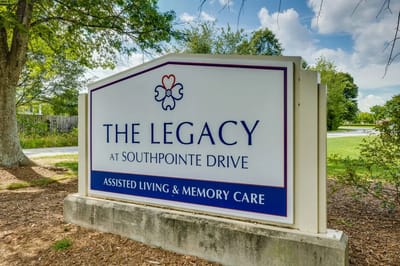
The Legacy at Southpointe Drive
Assisted Living, Nursing Home & Memory Care · Greenville, SC
The Legacy at Southpointe Drive
Assisted Living, Nursing Home & Memory Care · Greenville, SC
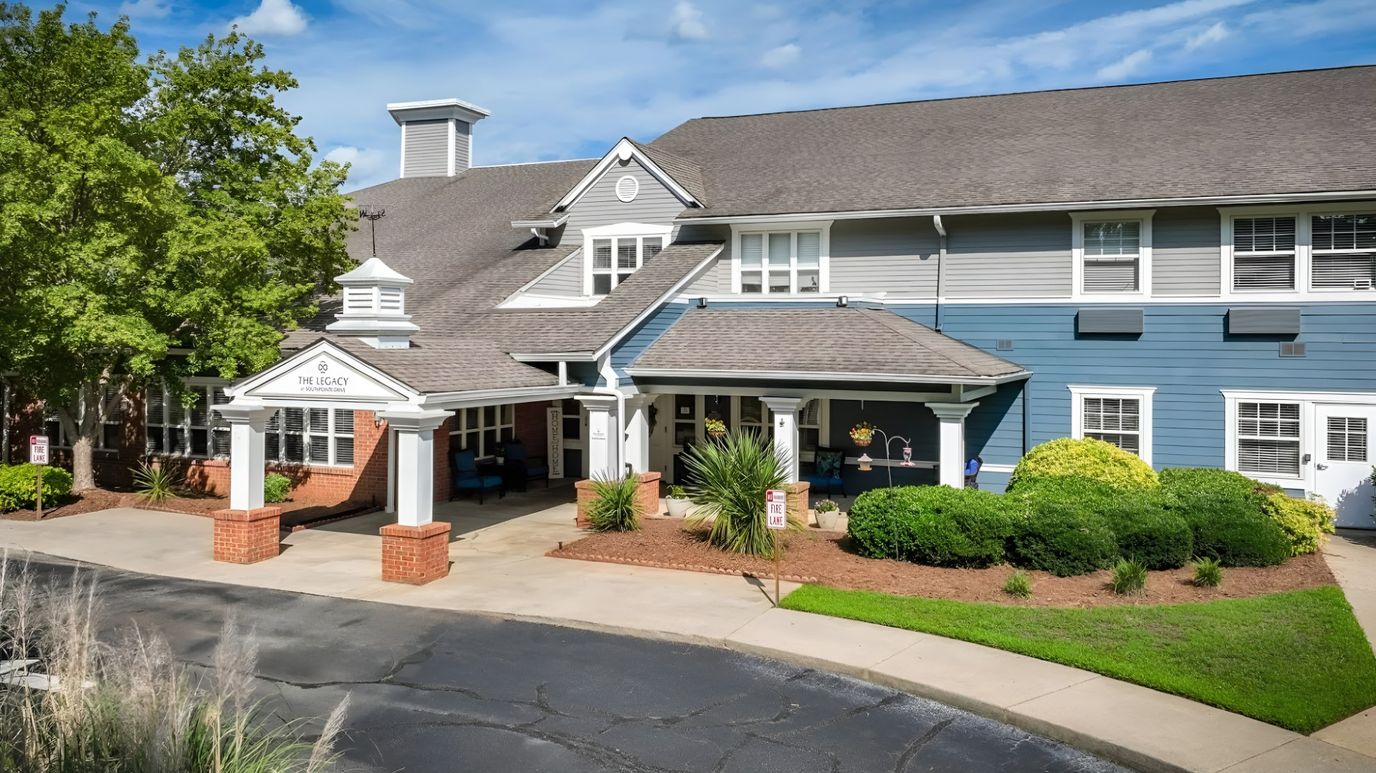
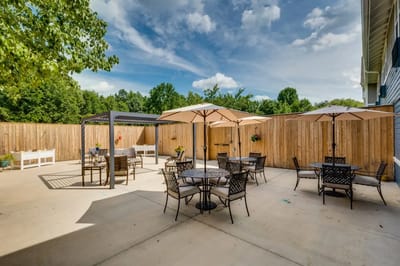
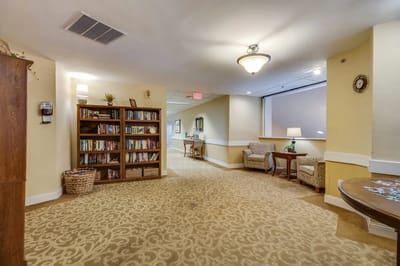
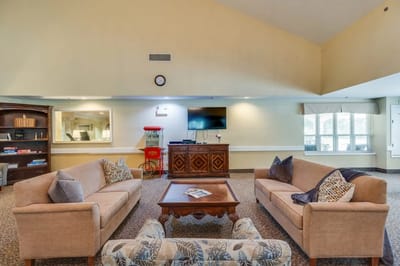
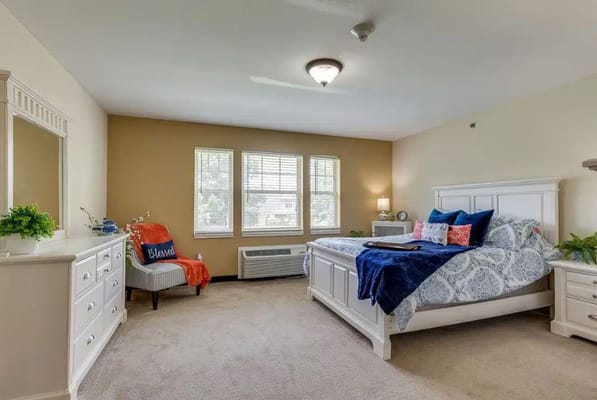
In the very heart of the vibrant Greenville community, The Legacy at Southpointe Drive sits as an awe-inspiring and luxurious assisted living and memory care community that promises to deliver the ultimate care experience for its residents. Basked in a serene residential environment, this community offers the perfect balance of personal freedom and intentional care that guarantees a remarkable stay for its guests. The spacious, cozy, and well-appointed rooms create an inviting and warm atmosphere that residents will surely find irresistible. With the reliable emergency response system that we have in place, residents are assured of their safety at all times.
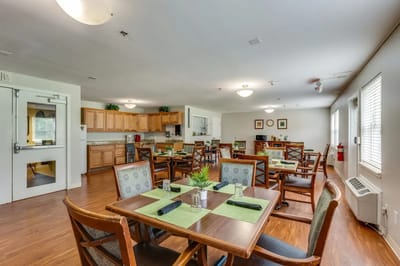
Their dedicated staff provides housekeeping, laundry, and maintenance services, ensuring that residents are relieved of any mundane chores and can focus on the more enjoyable aspects of life. With seasonal menus available, seniors are spoilt for choice, and their reliable transportation services to physician, dental, therapy, specialist, and optometrist appointments take away any worries that residents may have. At The Legacy at Southpointe Drive, they create harmonious living space that perfectly reflects the tastes and preferences of its residents.
110-bed community Rank #90 / 307Bed count — State benchmarkedThis home is ranked 90th out of 307 homes in South Carolina for bed count. Shows this facility's certified or reported bed count compared to other South Carolina facilities. Larger communities may offer more amenities, programs, and on-site services for residents and families.Facilities with the same value for a metric share the same rank. Rankings are based only on facilities in South Carolina that report data for that category. Facilities without available data are excluded from the ranking.Click the rank badge to see the full State ranking.Click here to see the full State ranking.
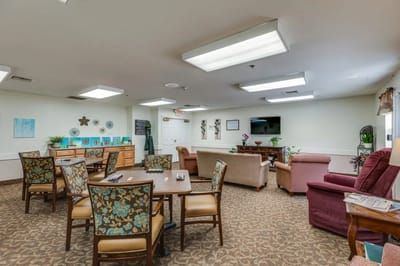
A larger shared setting that may offer more common spaces and organized community services.
Walk Score: 55 / 100 Rank #28 / 230Walk Score — State benchmarkedThis home is ranked 28th out of 230 homes in South Carolina for walk score. Shows how walkable this facility's neighborhood is compared to the average walk score across South Carolina facilities. Higher scores benefit residents, families, and staff.Facilities with the same value for a metric share the same rank. Rankings are based only on facilities in South Carolina that report data for that category. Facilities without available data are excluded from the ranking.Click the rank badge to see the full State ranking.Click here to see the full State ranking.
Moderately walkable. Some errands can be accomplished on foot, with a mix of nearby amenities.
About this community
Facility TypeHl- Community Residential Care Facility
StatusActive
ExpirationNovember 30, 2026
CountyGreenville
License NumberCRC-2108
Business TypeLimited Liability
The Legacy at Southpointe Drive is legally operated by Navion Southpointe Operations LLC, and administered by Hollie Bailey.
Ownership TypeLimited Liability
Dedicated Alzheimer's Unit
What does this home offer?
Pets Allowed
Housing Options: Studio / 1 Bed / 2 Bed
Building Type: 2-story
Transportation Services
Fitness and Recreation
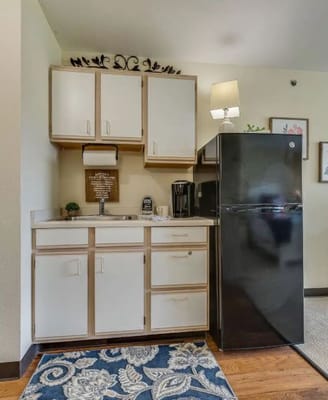
Type of Rooms Available

1 / 4
Studio
1
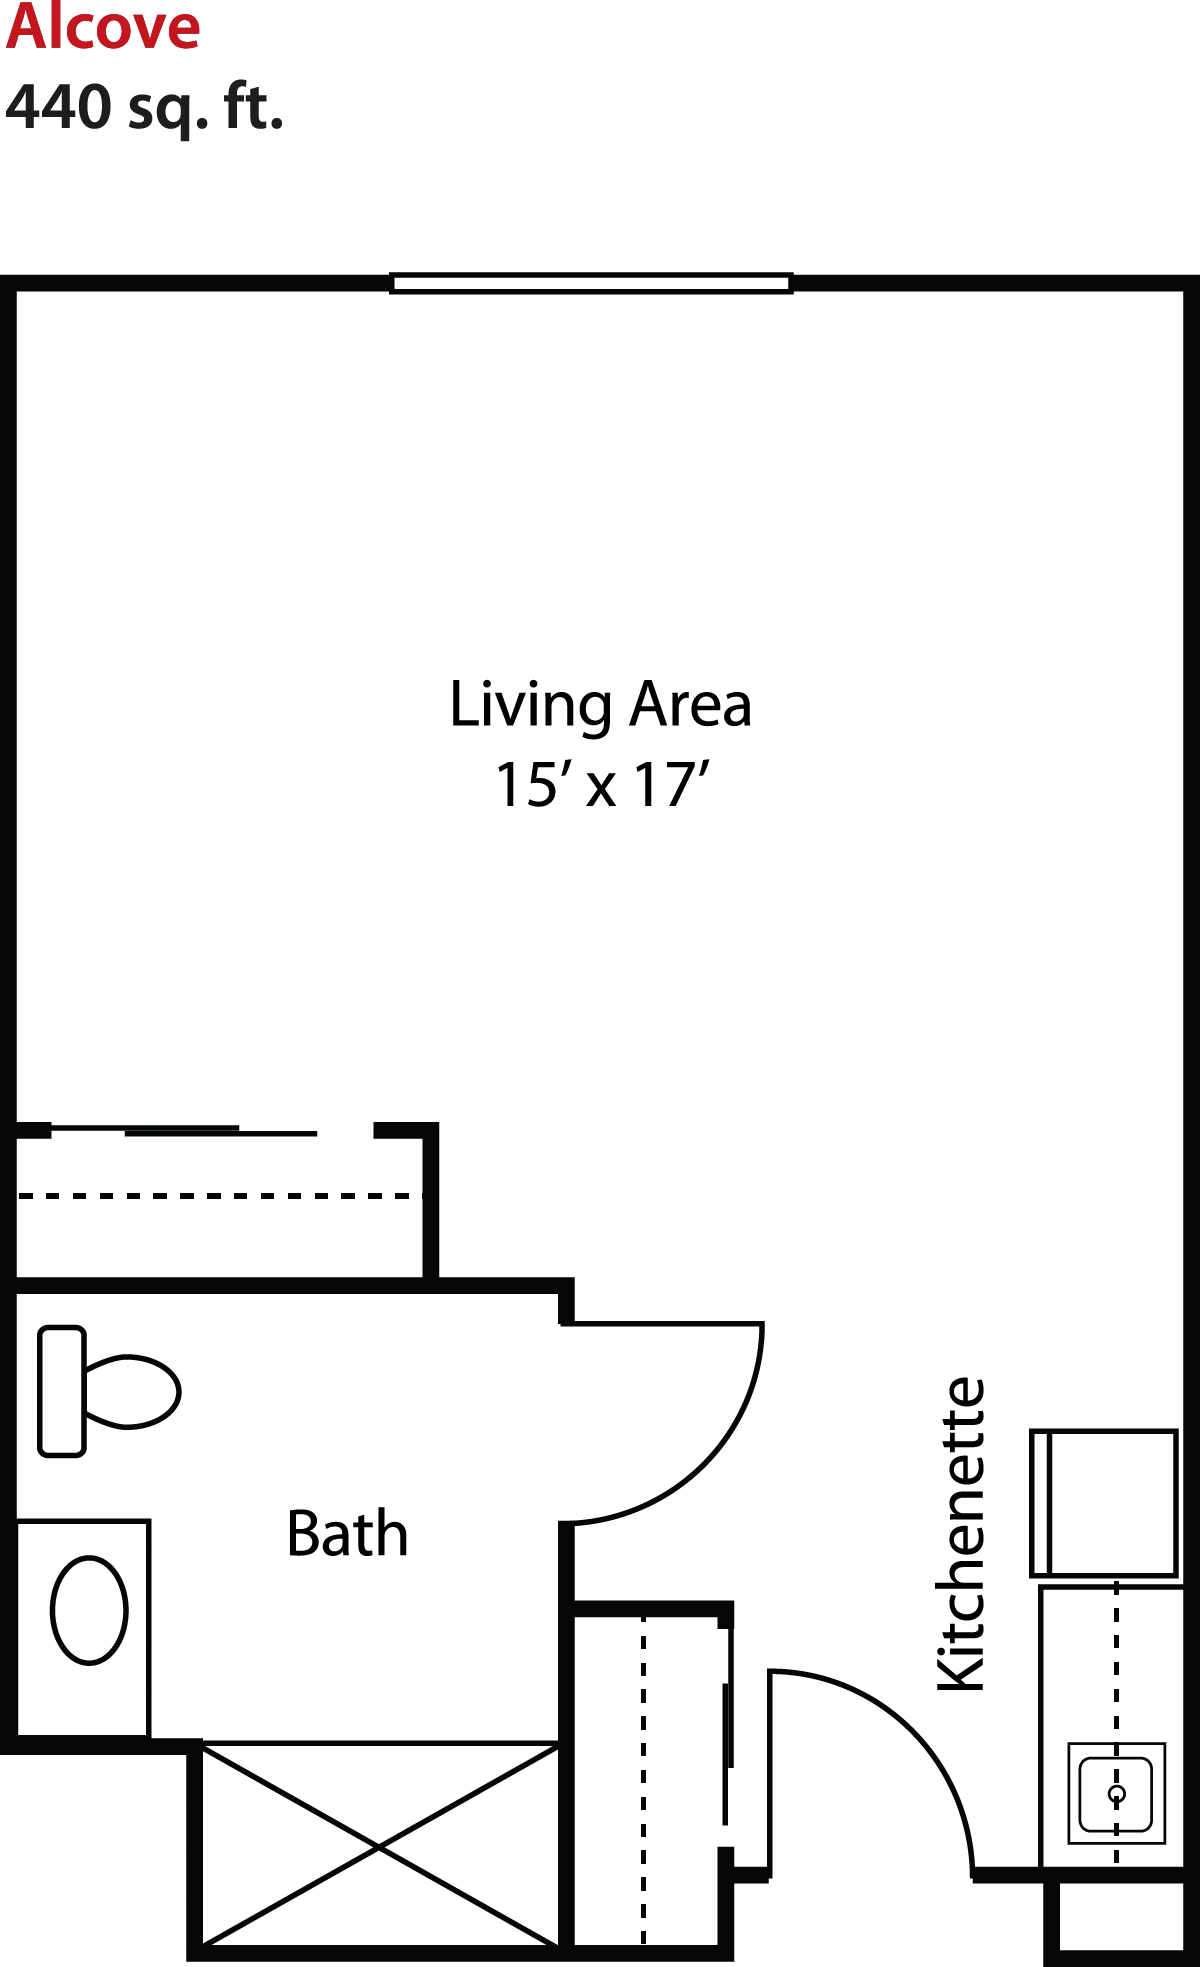
Living Spaces & Floor Plans for The Legacy at Southpointe Drive
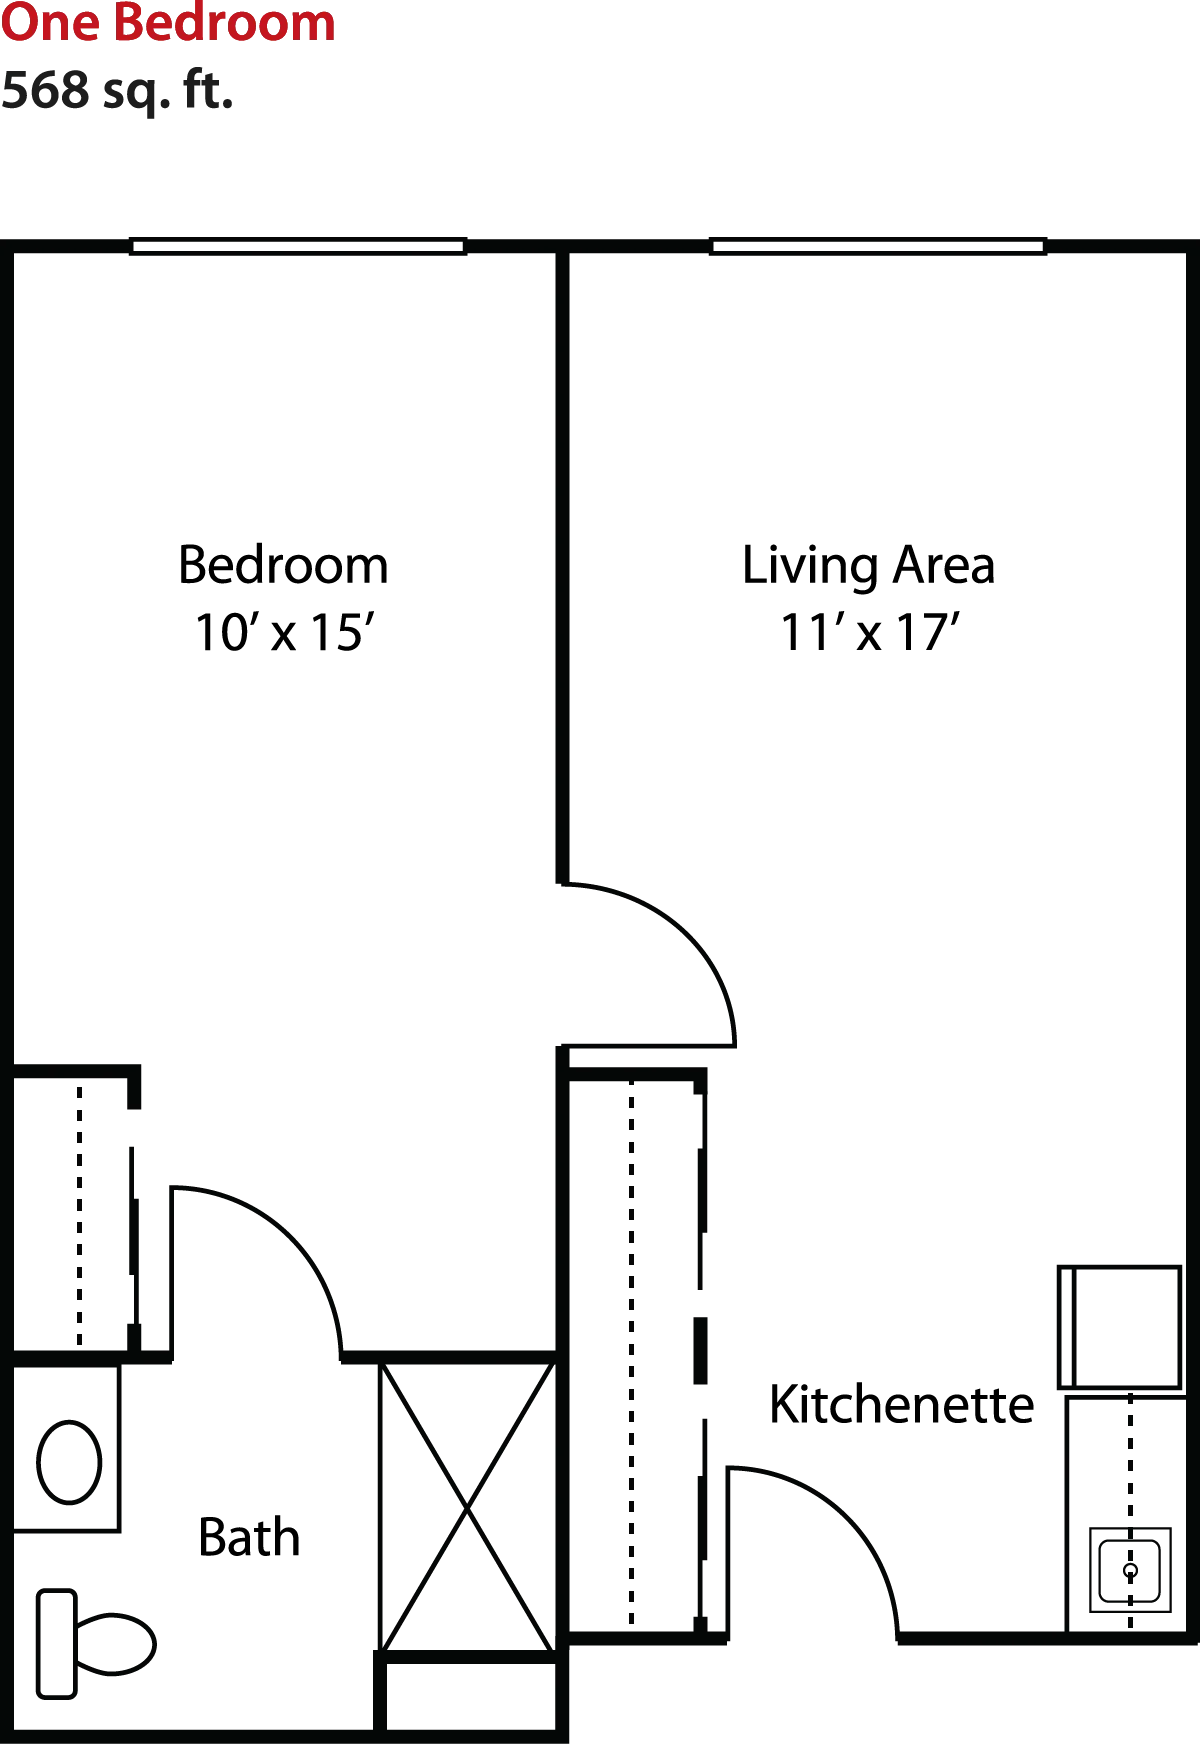
1 Bedroom
Studio
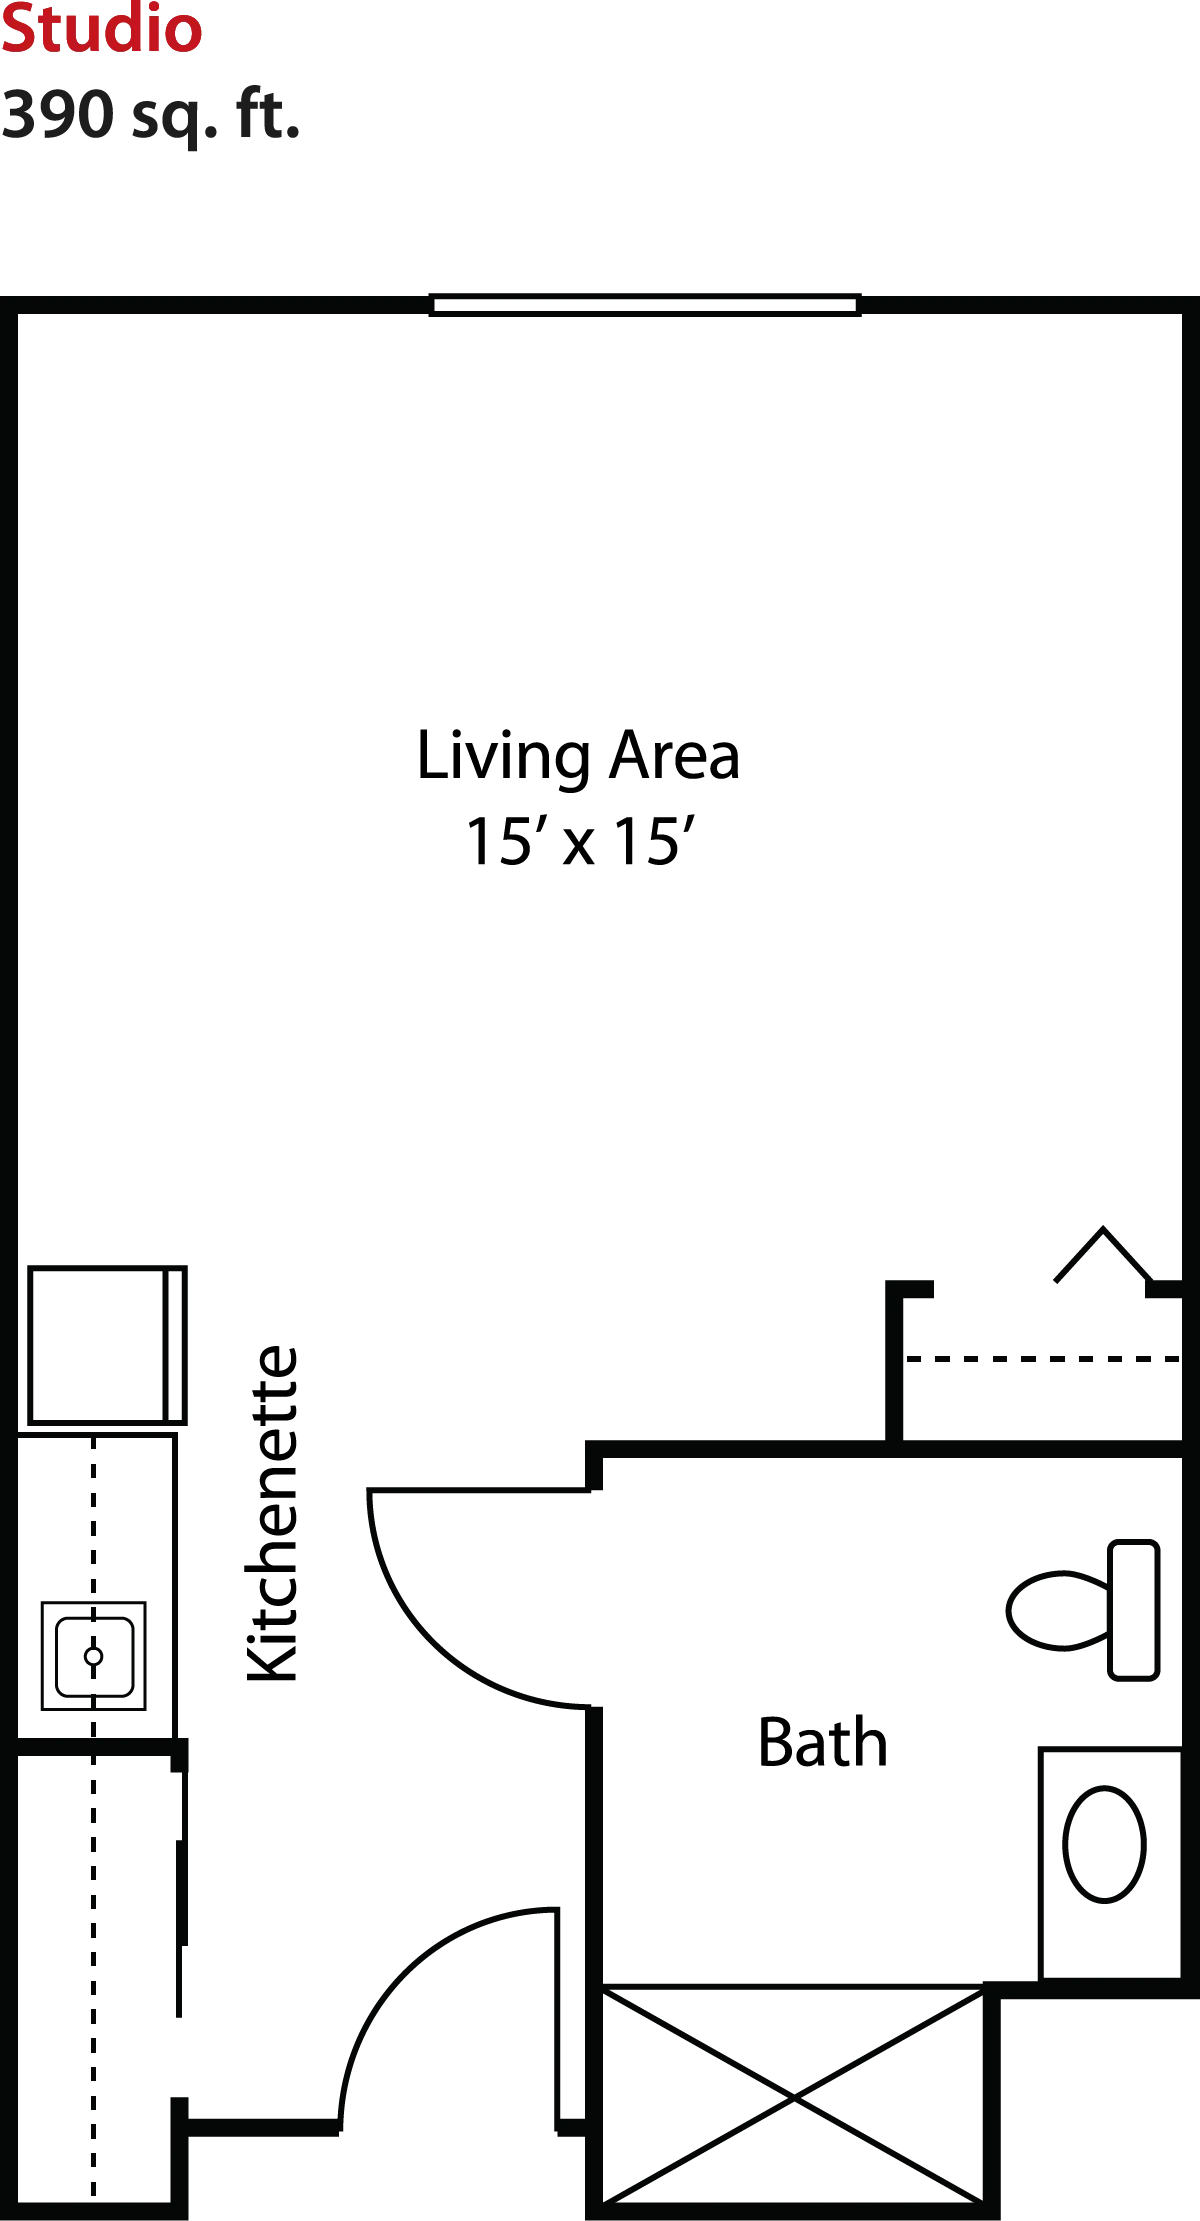
Studio

2 bedroom
Places of interest near The Legacy at Southpointe Drive
![]() 8.0 miles from city center
8.0 miles from city center
![]() Estimated distance in miles from Greenville's city center to The Legacy at Southpointe Drive's address, calculated via Google Maps.
Estimated distance in miles from Greenville's city center to The Legacy at Southpointe Drive's address, calculated via Google Maps.
Calculate Travel Distance to The Legacy at Southpointe Drive
Add your location
Compare Assisted Living around Greenville
Info below is compiled from CMS reports & the SC Dept. of Public Health (DPH), senior community websites & trusted data sources such as Walk Score & BBB.
Communities are listed from highest to lowest based on our ranking methodology.
| Linville Court at The Cascades Verdae | AL IL MC NH SNF | Greenville (Cascades Verdae) | 44
Facility
44
SC AVG
90
Rank
#271 / 307 |
92.3%
Facility
92.3%
SC AVG
84.8
Rank
#41 / 94 | +9% | 6.16
Facility
6.16
SC AVG
4.00
Rank
#5 / 118 | +3% | +54% | $0
Facility
$0
SC AVG
$34.8k
Rank
#1 / 120 | 6
Facility
6
SC AVG
13.7
Rank
#20 / 119 | 2.0
Facility
2.0
SC AVG
3.4
Rank
#14 / 119 | 1 | 41 | - |
8
Facility
8
SC AVG
32
Rank
#196 / 230 | Banyan Greenville LLC | $7.4MFiscal year ending 12/2023
Facility
$7.4MFiscal year ending 12/2023
SC AVG
$13.0M
Rank
#8 / 121 | $7.0MFiscal year ending 12/2023
Facility
$7.0MFiscal year ending 12/2023
SC AVG
$5.4M
Rank
#37 / 121 | 94.6%Fiscal year ending 12/2023
Facility
94.6%Fiscal year ending 12/2023
SC AVG
44%
Rank
#119 / 121 | 425392 | ||||
| Rolling Green Village Assisted Living Facility | AL IL MC NH SNF | Greenville | 52
Facility
52
SC AVG
90
Rank
#241 / 307 | - | - | 7.49
Facility
7.49
SC AVG
4.00
Rank
#2 / 118 | +18% | +87% | $0
Facility
$0
SC AVG
$34.8k
Rank
#1 / 120 | 5
Facility
5
SC AVG
13.7
Rank
#14 / 119 | 1.7
Facility
1.7
SC AVG
3.4
Rank
#11 / 119 | 2 | 18 | A+ | - | Rolling Green Village | $24.4MFiscal year ending 12/2023
Facility
$24.4MFiscal year ending 12/2023
SC AVG
$13.0M
Rank
#14 / 121 | $10.9MFiscal year ending 12/2023
Facility
$10.9MFiscal year ending 12/2023
SC AVG
$5.4M
Rank
#9 / 121 | 44.7%Fiscal year ending 12/2023
Facility
44.7%Fiscal year ending 12/2023
SC AVG
44%
Rank
#62 / 121 | 425160 | ||||
| The Gables on Pelham | AL MC NH SNF | Greenville (Pelham Road) | 119
Facility
119
SC AVG
90
Rank
#73 / 307 | - | - | 3.88
Facility
3.88
SC AVG
4.00
Rank
#55 / 118 | -85% | -3% | $11.2k
Facility
$11.2k
SC AVG
$34.8k
Rank
#81 / 120 | 10
Facility
10
SC AVG
13.7
Rank
#49 / 119 | 3.3
Facility
3.3
SC AVG
3.4
Rank
#64 / 119 | 2 | 32 | - |
14
Facility
14
SC AVG
32
Rank
#176 / 230 | Fsl Senior Living Ventures, LLC | $7.5MFiscal year ending 12/2023
Facility
$7.5MFiscal year ending 12/2023
SC AVG
$13.0M
Rank
#104 / 121 | $4.5MFiscal year ending 12/2023
Facility
$4.5MFiscal year ending 12/2023
SC AVG
$5.4M
Rank
#93 / 121 | 60.1%Fiscal year ending 12/2023
Facility
60.1%Fiscal year ending 12/2023
SC AVG
44%
Rank
#22 / 121 | 425373 | ||||
| Greenville Post Acute | AL MC NH RC SNF | Greenville | 132
Facility
132
SC AVG
90
Rank
#37 / 307 |
96.4%
Facility
96.4%
SC AVG
84.8
Rank
#11 / 94 | +14% | 3.59
Facility
3.59
SC AVG
4.00
Rank
#76 / 118 | -22% | -10% | $5.8k
Facility
$5.8k
SC AVG
$34.8k
Rank
#60 / 120 | 19
Facility
19
SC AVG
13.7
Rank
#99 / 119 | 6.3
Facility
6.3
SC AVG
3.4
Rank
#115 / 119 | - | 127 | - | - | Brock Stanger | $13.1MFiscal year ending 12/2023
Facility
$13.1MFiscal year ending 12/2023
SC AVG
$13.0M
Rank
#35 / 121 | $6.2MFiscal year ending 12/2023
Facility
$6.2MFiscal year ending 12/2023
SC AVG
$5.4M
Rank
#48 / 121 | 47%Fiscal year ending 12/2023
Facility
47%Fiscal year ending 12/2023
SC AVG
44%
Rank
#92 / 121 | 425042 |
Financial Assistance for
Assisted Living in South Carolina
The Legacy at Southpointe Drive is located in Greenville, South Carolina.
Here are the financial assistance programs available to residents in South Carolina.
Frequently Asked Questions about The Legacy at Southpointe Drive
What neighborhood is The Legacy at Southpointe Drive in?
The Legacy at Southpointe Drive is in the Mauldin neighborhood of Greenville.
Who is the owner of The Legacy at Southpointe Drive?
The Legacy at Southpointe Drive is legally operated by Navion Southpointe Operations LLC, and administered by Hollie Bailey.
Is The Legacy at Southpointe Drive in a walkable area?
The Legacy at Southpointe Drive has a walk score of 55. Moderately walkable. Some errands can be accomplished on foot, with a mix of nearby amenities.
What is the license number of The Legacy at Southpointe Drive?
According to SC state health department records, The Legacy at Southpointe Drive's license number is CRC-2108.
When does The Legacy at Southpointe Drive's license expire?
According to SC state health department records, The Legacy at Southpointe Drive's license expires on November 30, 2026.
Are pets allowed at The Legacy at Southpointe Drive?
Yes, The Legacy at Southpointe Drive allows residents to bring their pets.
What is the best email address for The Legacy at Southpointe Drive?
The team at The Legacy at Southpointe Drive can be reached at HOLLIE.BAILEY@NAVIONSL.COM.
Guides for Better Senior Living
Care Cost Calculator: See Prices in Your Area
Nursing Home Data Explorer
Don’t Wait Too Long: 7 Red Flag Signs Your Parent Needs Assisted Living Now
The True Cost of Assisted Living in 2025 – And How Families Are Paying For It
Understanding Senior Living Costs: Pricing Models, Discounts & Financial Assistance
Updated on
