


Total staff
154
Employees
99
Contractors
55

The Lodge at Bear Creek occupies a single-story facility at 3729 Ira E. Woods Avenue in Grapevine, serving a mixed-acuity population across short-term rehabilitation and long-term care. Currently housing 67 residents in a 100-bed structure, the community reports occupancy of 68.8%; notably above the Texas average of 63.5%.
Admissions are split heavily toward private pay (52%) and Medicare short-stay rehabilitation (39%), and an average stay of just over 79 days.
The operator, Grapevine Nursing and Rehab Center, LLC, reported gross revenue of $9.36 million in 2023 after years of operating losses, achieving financial breakeven following a 18.6-percentage-point occupancy rebound from 2022.
Regulatory performance and quality outcomes create a complicated picture.
The facility’s 3-star overall CMS rating sits marginally above the Texas average, but health inspection scores trail state performance by 27.6%. This reflects two recent federal penalties: a substantial $66,000 civil money penalty assessed in October 2024 and a $7,000 penalty in October 2023, indicating current-year regulatory stress.
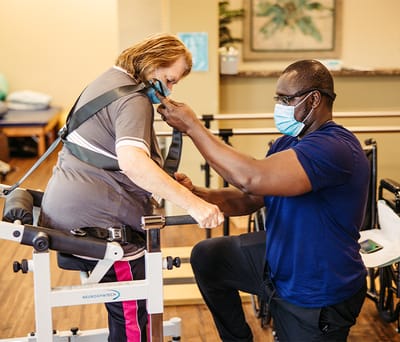
Staffing averages 2 hours 52 minutes of nursing per resident per day, roughly 21% below the Texas average and approaching the threshold signaling inadequate care. Yet the facility invests heavily in rehabilitation: physical therapy reaches 15 minutes per resident daily, 275% above state average.
Long-stay residents show concerning patterns. Functional decline scores rank 47% worse than state average, and 28.2% experienced increased dependence for daily activities (75% worse). Pressure ulcers affected 7.5% of high-risk residents (70% worse), and UTI incidence at 1.4% was 73% worse than average.
Short-stay rehabilitation outcomes, by contrast, excel: 60% of residents successfully returned home or community (19% better than state), and emergency department visits dropped to 7.1% of discharges (41% better). The facility recorded zero major-injury falls in long-stay residents, a genuine care safety achievement.
The facility’s compliance record and staffing adequacy are at odds with its strong short-term rehabilitation focus and improving occupancy, suggesting recent regulatory violations may have addressed operational gaps beneath a well-performing rehab service.
Staffing hours
![]() Daily nursing hours per resident by staff type, reported to CMS. Higher is generally better — compare this facility to state and national averages to see where staffing stands.
Daily nursing hours per resident by staff type, reported to CMS. Higher is generally better — compare this facility to state and national averages to see where staffing stands.
Hours per resident per day vs Texas averages
Total nursing care
![]() This home is ranked 212th out of 233 homes in Texas for nurse hours. Total adjusted nursing hours per resident per day, combining RN, LPN, and aide time. CMS adjusts this for case-mix so facilities can be fairly compared.
This home is ranked 212th out of 233 homes in Texas for nurse hours. Total adjusted nursing hours per resident per day, combining RN, LPN, and aide time. CMS adjusts this for case-mix so facilities can be fairly compared.
2h 52m
21% below state avg3 of 6 metrics below state avg
Reporting period: October 1 – December 31, 2025 (Q4 2025). Source: CMS Payroll-Based Journal report.
Manages medical care and health needs.
Assists with medical care and medications.
Helps with daily care and mobility.
Total hours from contractors
900 contractor hours this quarter
| Certified Nursing Assistant | 33 | 19 | 52 | 8,527 | 92 | 100% | 7.1 |
| Licensed Practical Nurse | 17 | 26 | 43 | 4,101 | 92 | 100% | 8 |
| Registered Nurse | 14 | 2 | 16 | 2,931 | 92 | 100% | 8.7 |
| Medication Aide/Technician | 7 | 6 | 13 | 1,672 | 92 | 100% | 11.8 |
| Physical Therapy Aide | 6 | 0 | 6 | 1,637 | 70 | 76% | 7.6 |
| Respiratory Therapy Technician | 3 | 0 | 3 | 1,437 | 72 | 78% | 7.4 |
| Clinical Nurse Specialist | 2 | 0 | 2 | 688 | 64 | 70% | 8 |
| Nurse Practitioner | 2 | 0 | 2 | 651 | 60 | 65% | 8 |
| Speech Language Pathologist | 4 | 0 | 4 | 598 | 67 | 73% | 6.9 |
| Qualified Social Worker | 3 | 0 | 3 | 515 | 68 | 74% | 7.5 |
| Administrator | 1 | 0 | 1 | 512 | 64 | 70% | 8 |
| Physical Therapy Assistant | 1 | 0 | 1 | 496 | 62 | 67% | 8 |
| Dietitian | 1 | 0 | 1 | 496 | 62 | 67% | 8 |
| Mental Health Service Worker | 2 | 0 | 2 | 440 | 55 | 60% | 8 |
| Qualified Activities Professional | 1 | 0 | 1 | 380 | 65 | 71% | 5.8 |
| RN Director of Nursing | 1 | 0 | 1 | 144 | 18 | 20% | 8 |
| Medical Director | 0 | 2 | 2 | 38 | 4 | 4% | 9.5 |
| Feeding Assistant | 1 | 0 | 1 | 10 | 8 | 9% | 1.2 |
Includes penalties issued in 2023-2024
Federal penalties imposed by CMS for regulatory violations, including civil money penalties (fines) and denials of payment for new Medicare/Medicaid admissions.
Source: CMS Penalties Database (Data as of Jan 2026)
Texas average: $80K
Texas average: 2.5
Texas average: 0.2
Penalties are imposed by CMS for violations of federal nursing home regulations.
2 penalties in the past 3 years
Multiple penalties were reported in the last 3 years.
Last updated: Jan 2026
These measures show how residents usually do over time at this home, based on health outcomes and preventive care.
Texas average: 8.6
Texas average: 16.0
Texas average: 16.2%
Texas average: 16.2%
Texas average: 15.7%
Texas average: 3.2%
Texas average: 4.4%
Texas average: 0.8%
Texas average: 3.5%
Texas average: 2.9%
Texas average: 7.9%
Texas average: 97.3%
Texas average: 97.9%
Texas average: 2.13
Texas average: 2.07
Texas average: 90.4%
Texas average: 1.4%
Texas average: 88.0%
Texas average: 25.9%
Texas average: 12.0%
Texas average: 0.8%
Texas average: 53.7%
Texas average: 50.6%
Quality measures are calculated from Minimum Data Set (MDS) assessments. For most measures, lower percentages indicate better care quality.
39% of new residents, usually for short-term rehab.
52% of new residents, often for short stays.
9% of new residents, often for long-term daily care.
Source: CMS Long-Term Care Facility Characteristics (Data as of Jan 2026)
Residents meet regularly to discuss policies, care quality, and activities
Organized group of residents that meets regularly to discuss facility policies, quality of life, and activities.
Data sourced from CMS Long-Term Care Facility Characteristics quarterly report. Payer mix reflects the current resident census by primary payment source.
Historical financial and operational data for The Lodge at Bear Creek from 2017–2023, based on CMS SNF Cost Reports.
Key figures below are for fiscal year ending in 12/2023.
Based on CMS SNF Cost Report for fiscal year ending in 12/2023.
No pets allowed
Building Type: Single-story
This home supports both short-term rehab and long-term care, with residents staying for a wide range of durations.
Most new residents arrive under private pay (52% of admissions), and a typical private pay stay runs around 1 - 2 months.
Coverage residents most often arrive under.
Coverage residents most often leave under.
![]() 3.4 miles from city center
3.4 miles from city center
![]() Estimated distance in miles from Grapevine's city center to The Lodge at Bear Creek's address, calculated via Google Maps.
— 2.45 miles to nearest hospital (Baylor Scott & White Medical Center - Grapevine)
Estimated distance in miles from Grapevine's city center to The Lodge at Bear Creek's address, calculated via Google Maps.
— 2.45 miles to nearest hospital (Baylor Scott & White Medical Center - Grapevine)
Add your location
The Lodge at Bear Creek is located in Grapevine, Texas.
Here are the financial assistance programs available to residents in Texas.
The Lodge at Bear Creek has a walk score of 42. Somewhat walkable. A few nearby services may be reachable on foot, but most trips require transportation.
The Lodge at Bear Creek's occupancy is 68.8%.
No, The Lodge at Bear Creek has a no-pet policy.
The Lodge at Bear Creek is registered as a for-profit.
Yes — there are 15 photos of The Lodge at Bear Creek in the photo gallery on this page.
The Lodge at Bear Creek is located at 3729 Ira E. Wds Ave, Grapevine, TX 76051.
(817) 527-7500 will put you in contact with the team at The Lodge at Bear Creek.
Care Cost Calculator: See Prices in Your Area
Nursing Home Data Explorer
Don’t Wait Too Long: 7 Red Flag Signs Your Parent Needs Assisted Living Now
The True Cost of Assisted Living in 2025 – And How Families Are Paying For It
Understanding Senior Living Costs: Pricing Models, Discounts & Financial Assistance


