The Orchards Michigan – Wayne

Assisted Living · Wayne County, MI
CMS overall rating Info The Overall CMS Rating is scored from 1 to 5 stars and combines results from health inspections, staffing levels, and quality measures. Health inspections carry the most weight. Staffing and quality scores can increase or decrease the final rating based on performance compared to state and national standards.
The Orchards Michigan – Wayne

Assisted Living in Wayne County

CMS overall rating Info The Overall CMS Rating is scored from 1 to 5 stars and combines results from health inspections, staffing levels, and quality measures. Health inspections carry the most weight. Staffing and quality scores can increase or decrease the final rating based on performance compared to state and national standards.
Calculator: See prices in your area
The Orchards Michigan – Wayne accepts Medicare, Medicaid, and private pay.

Overview of The Orchards Michigan – Wayne

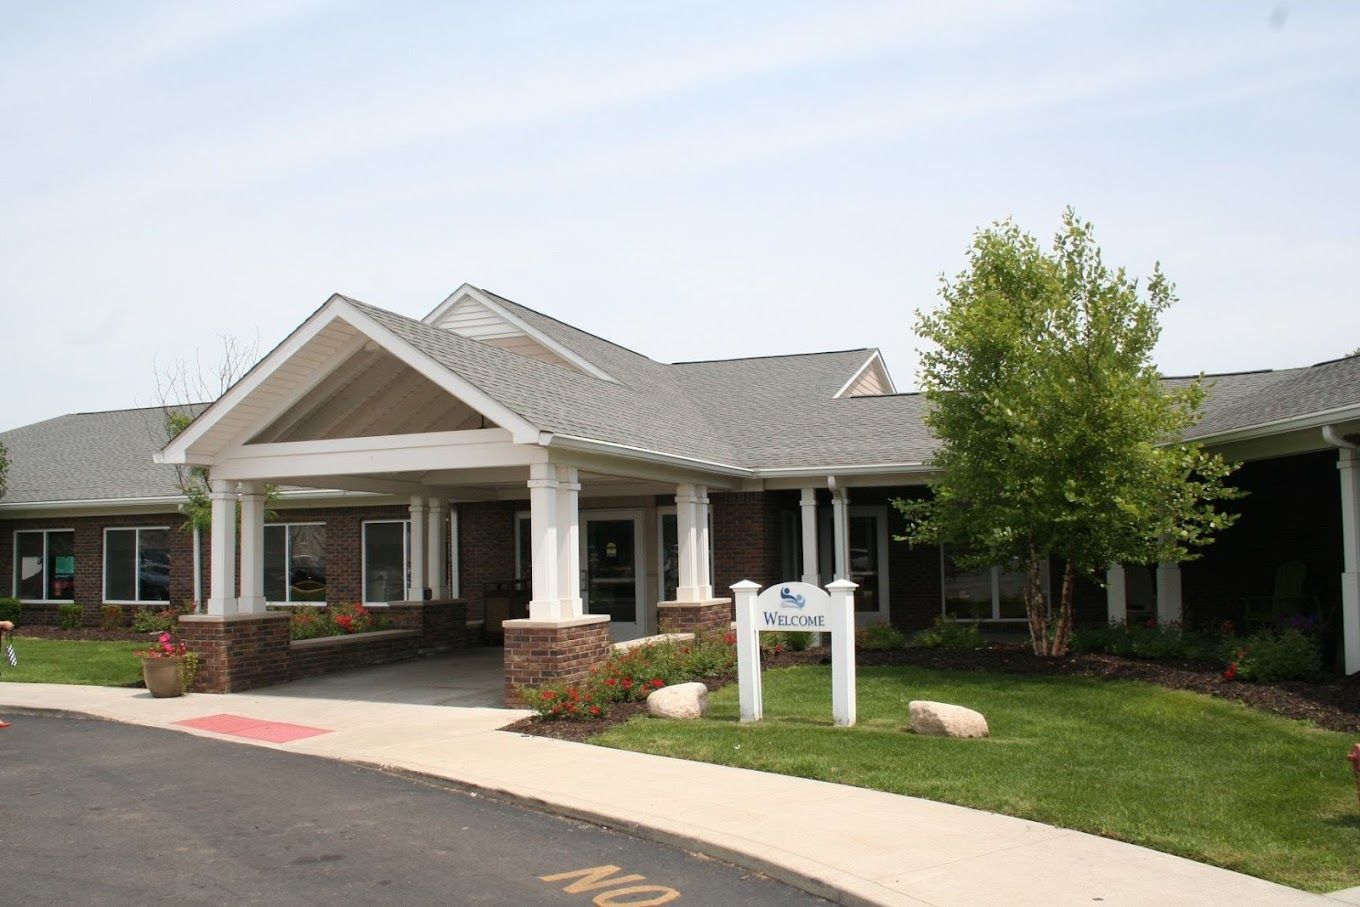
Set in the peaceful neighborhood of Wayne, MI, the Orchard Michigan – Wayne is an enticing senior living community offering assisted living and memory care services. This community adheres to a person-centered care philosophy towards its residents. Here, residents can choose from a wide array of accommodations tailored to their needs and preferences. With a trained and compassionate team, this community renders round-the-clock care and assistance matched with on-the-go physician services with medical director oversight.

Offering above-and-beyond amenities and services, residents can enjoy restaurant-style menu and dining, housekeeping and laundry, and medication management. Meet new friends through its diverse socialization and life enrichment programs such as art classes, card games, and community service activities. At the Orchard Michigan – Wayne, seniors can enjoy a wondrous living experience.

(734) 729-4436

Quality ratings

Measured by Centers for Medicare & Medicaid Services (CMS)

Overall rating Info The Overall CMS Rating combines results from health inspections, staffing levels and quality measures. Health inspections carry the most weight. Staffing and quality scores can increase or decrease the final rating based on performance compared to state and national standards.
▼ 36.3% Below MI avg.
Health Inspection Info Based on the results of the facility's three most recent standard inspections and any complaint investigations. CMS reviews the number, scope, and severity of deficiencies, with more recent findings weighted more heavily.
▼ 29.3% Below MI avg.
Staffing Info Measures average nursing staff hours per resident per day, including Registered Nurses (RNs) and total nursing staff. Ratings are adjusted based on the level of care residents require and are compared to state and national benchmarks.
▼ 14.2% Below MI avg.
Quality Measures Info Based on clinical and physical health indicators reported to CMS, such as hospital readmissions, falls, pressure ulcers, and improvements in mobility. These measures reflect how well residents' health needs are being managed.
▼ 20.2% Below MI avg.

Staffing hours breakdown

Info Daily nursing hours per resident by staff type, reported to CMS. Higher is generally better — compare this facility to state and national averages to see where staffing stands.

Hours per resident per day — compared to Michigan state averages

Total nursing care / resident Info This home is ranked 51st out of 94 homes in Michigan.

Total adjusted nursing hours per resident per day, combining RN, LPN, and aide time. CMS adjusts this for case-mix so facilities can be fairly compared.
3h 53m per day
Rank #51 / 94Nurse hours — state benchmarkedThis home is ranked 51st out of 94 homes in Michigan.Shows adjusted nurse hours per resident per day benchmarked to the Michigan average, with a ranking across 94 Michigan SNFs. More hours mean more direct care. The national average is about 3.5 hrs; below 3.0 is a red flag.
This facility Michigan avg (4h 18m per day)
vs Michigan avg
-10%

1 of 1 metrics below state avg

Staff typeHours / dayvs state avg
Total Nursing (Weekend) Info Combined nursing hours (RN + LPN + Nurse Aide) per resident per day on weekends. Staffing often drops on weekends — this figure reveals whether the facility maintains adequate coverage outside of weekday hours. 2h 55m per day ▼ 17% State avg: 3h 31m per day · National avg: 3h 26m per day

Capacity and availability

This home usually has availability

Occupancy lower than 85% suggests more openings may be available.

Lower occupancy than the Michigan average: 75.8%
Occupancy rate 68.1% Rank #56 / 96Occupancy rate — state benchmarkedThis home is ranked 56th out of 96 homes in Michigan.Shows this facility's occupancy rate versus the Michigan average, with its statewide rank out of 96. Higher occupancy signals strong local demand and financial stability.
Avg. Length of Stay 112 days
Occupancy rate
68.1% Rank #56 / 96Occupancy rate — state benchmarkedThis home is ranked 56th out of 96 homes in Michigan.Shows this facility's occupancy rate versus the Michigan average, with its statewide rank out of 96. Higher occupancy signals strong local demand and financial stability.
Avg. Length of Stay
112 days

Who this home usually serves

TYPE OF STAY

Mix of rehab and long-term care

This home supports both short-term rehab and long-term care, with residents staying for a wide range of durations.

Breakdown by payment type

Medicare

18% of new residents, usually for short-term rehab.

Typical stay 1 - 2 months

Private pay

44% of new residents, often for short stays.

Typical stay 3 - 4 months

Medicaid

38% of new residents, often for long-term daily care.

Typical stay 4 - 5 months

Finances and operations

Privately-owned community
Operated by a single business entity.
Home revenue
$14.3M
Operating loss
-$317.7K
Privately-owned community Operated by a single business entity.
Home revenue
$14.3M Rank #50 / 95Revenue — state benchmarkedThis home is ranked 50th out of 95 homes in Michigan.Shows this facility's annual revenue compared to the Michigan SNF average. Higher revenue generally means more resources for staffing and capital — read alongside Payroll %.
Operating loss
-$317.7K
Payroll costs Info The portion of the home's budget spent on staff, including nurses, caregivers, and other employees who support care and operations. Rank #39 / 95Payroll — state benchmarkedThis home is ranked 39th out of 95 homes in Michigan.Shows total annual staff payroll benchmarked to the Michigan average. Higher payroll investment relative to peers often signals better staffing and less reliance on cheaper contract labor.
$7.4M
51.4% of revenue Rank #25 / 95Payroll % — state benchmarkedThis home is ranked 25th out of 95 homes in Michigan.Shows payroll as a percentage of revenue versus the Michigan average. Well-run SNFs often land around 55–65%. Below 25% may signal understaffing or heavy agency use — read with Staffing ratings.
Other operating costs Info All remaining costs needed to run the home, such as food, utilities, building maintenance, supplies and administrative expenses.
$7.3M
Total costs $14.7M
Walk Score
Walk Score: 7 / 100 Rank #65 / 70Walk Score — state benchmarkedThis home is ranked 65th out of 70 homes in Michigan.Shows how walkable this facility's neighborhood is compared to the average Walk Score across Michigan SNFs. Higher scores benefit residents, families, and staff.
Car-dependent. Most errands require a car, with limited nearby walkable options.

What does this home offer?

Pets allowed icon
Pets allowed icon

Pets Allowed: Yes, Pets Allowed

Building type icon
Building type icon

Building Type: Single-story

Transportation services icon

Transportation Services

Fitness and recreation icon

Fitness and Recreation

Types of Care at The Orchards Michigan – Wayne

Assisted Living

Contact The Orchards Michigan – Wayne

Health Inspection History

Inspections
Total health inspections 7

Michigan average 6.5


Last Health inspection on Jul 2025

Total health citations
37 Rank #66 / 96Health citations — state benchmarkedThis home is ranked 66th out of 96 homes in Michigan.Shows this facility's total health deficiency citations benchmarked to the Michigan state average, with a ranking across all 96 MI SNFs. Lower citation counts earn a better rank.

Michigan average 33.5

Citations per inspection
5.29 Rank #61 / 96Citations per inspection — state benchmarkedThis home is ranked 61st out of 96 homes in Michigan.Shows average deficiency citations per CMS inspection for this facility versus the Michigan mean across 96 SNFs with citation data. Lower is better.

Michigan average 5.18


Health citations are formal notices following inspections when they fail to comply with safety and care standards.

29 of 37 citations resulted from standard inspections; 6 of 37 resulted from complaint investigations; and 2 of 37 came from combined inspections (standard and complaint).

Breakdown of citation severity (last 4 years)
Critical Health citations More info
1
233% worse than Michigan average

Michigan average: 0.3


Serious Health citations More info 0
100% better than Michigan average

Michigan average: 1.9

1 critical citation More info Michigan average: 0.3

0 serious citations More info Michigan average: 1.9

35 moderate citations More info Michigan average: 30.8

1 minor citation More info Michigan average: 0.5
Citations history (last 4 years)
Pharmacy moderate citation Info Issues related to medication management, including how drugs are stored, administered, and monitored. Jul 02, 2025
Corrected

Nutrition moderate citation Info Issues related to food quality, meal service, and resident's nutritional needs. Nov 06, 2024
Corrected

Abuse/Neglect moderate citation Info Issues related to protecting resident's from harm, including abuse, neglect, or mistreatment. Oct 03, 2024
Corrected

Quality of Care critical citation Info Issues related to how well residents receive appropriate treatment and support for their medical and daily care needs. Oct 03, 2024
Corrected

Financial Assistance for
Assisted Living in Michigan

The Orchards Michigan – Wayne is located in Wayne, Michigan.
Here are the financial assistance programs available to residents in Michigan.

Get Financial aid guidance

MI Choice Waiver

Michigan Medicaid MI Choice Waiver

Age 65+ or disabled
General Michigan resident, Medicaid- eligible, nursing home-level care need.
Income Limits (2025) ~$2,829/month 300% FBR, individual
Asset Limits $2,000 (individual), $3,000 (couple).
MI

Delivered through regional waiver agents; waitlists possible.

Benefits
Personal care (5-7 hours/day) Respite care (240 hours/year) Home modifications ($1,500 avg.) Adult day care ($65/day)

Home Help Program

Michigan Home Help

Age 65+ or disabled
General Michigan resident, Medicaid- eligible or low-income.
Income Limits ~$1,732/month individual, Medicaid threshold
Asset Limits $2,000 individual
MI

Can hire family caregivers; less intensive than waiver.

Benefits
Personal care (up to 60 hours/month) Homemaker services Respite (varies)

Program of All-Inclusive Care for the Elderly (PACE)

Michigan PACE

Age 55+
General Michigan resident, nursing home-level care need, safe with PACE support.
Income Limits (2025) ~$2,829/month (Medicaid-eligible); private pay option available.
Asset Limits $2,000 (individual), $3,000 (couple).
MI

16 PACE centers (e.g., Ingham, Wayne counties); expanding slowly.

Benefits
Personal care (5-7 hours/day) Medical care Meals Transportation Therapy Respite

Medicare Savings Program (MSP)

Michigan Medicare Savings Program

Age 65+ or disabled
General Michigan resident, Medicare Part A/B.
Income Limits (2025) ~$2,510/month (QMB), ~$3,380/month (SLMB), ~$3,598/month (QI)—individual.
Asset Limits $9,430 (individual), $14,130 (couple).
MI

Three tiers; no waitlist; includes Extra Help for Part D.

Benefits
Covers Part B premiums ($174.70/month) Deductibles ($240/year) Copays (~20%)

National Family Caregiver Support Program (NFCSP) Respite

Michigan NFCSP Respite Care

Age
General Caregivers of 60+ needing care or 55+ caregivers of others; Michigan resident; functional needs (2+ ADLs).
Income Limits (2025) Prioritizes ~$24,980/year (individual); no strict cap.
Asset Limits Not assessed; need-based.
MI

16 AAAs; prioritizes low-income, rural caregivers.

Benefits
Respite (4-6 hours/week or 5 days/year) Adult day care ($60/day) Caregiver training

Senior Community Service Employment Program (SCSEP)

Michigan SCSEP

Age 55+
General unemployed, low-income, Michigan resident.
Income Limits (2025) ~$1,983/month 125% FPL
Asset Limits Not specified; income-focused.
MI

Priority for veterans, rural residents; Operation ABLE partnership.

Benefits
Paid training (~20 hours/week at ~$7.25/hour) Job placement

VA Aid and Attendance (A&A) and Housebound Benefits

Michigan VA Aid and Attendance/Housebound

Age 65+ or disabled veteran/spouse
General Michigan resident, wartime service, need for ADL help (A&A) or homebound.
Income Limits (2025) Net income < ~$1,984/month (veteran with dependent, A&A); pension offsets income.
Asset Limits ~$155,356 net worth limit
MI

High veteran demand in urban/rural areas.

Benefits
Cash (~$1,433-$2,642/month veteran, ~$951-$1,318 spouse) for care costs

Places of interest near The Orchards Michigan – Wayne

Address 2.0 miles from city center Info Estimated distance in miles from Wayne's city center to The Orchards Michigan – Wayne's address, calculated via Google Maps.

Calculate Travel Distance to The Orchards Michigan – Wayne

Add your location

Address

Staffing Data (Q2 2025)

This data corresponds to Q2 2025 and is based on CMS Payroll-Based Journal.

Total staff 130
Employees 124
Contractors 6
Staff to resident ratio 1.17:1
33% worse than Michigan average

Michigan average ratio: 1.75:1

Avg staff/day 50
Average shift 8.7 hours
10% better than Michigan average

Michigan average: 7.9 hours

Total staff hours (quarter) 39,532
Nursing staff breakdown
Registered Nurse

Manages medical care and health needs.

Total count 9
Average shift length Info Average shift length. Calculated as total hours divided by days worked and average staff per day. 11.5 hours

No contractors work on this role.

Licensed Practical Nurse

Assists with medical care and medications.

Total count 30
Average shift length Info Average shift length. Calculated as total hours divided by days worked and average staff per day. 9.3 hours

No contractors work on this role.

Certified Nursing Assistant

Helps with daily care and mobility.

Total count 61
Average shift length Info Average shift length. Calculated as total hours divided by days worked and average staff per day. 9.2 hours

No contractors work on this role.

Contractor staffing

Total hours from contractors

1.6%

620 contractor hours this quarter

Clinical Nurse Specialist: 1 Mental Health Service Worker: 1 Feeding Assistant: 1 Occupational Therapy Aide: 1 Medical Director: 1 Occupational Therapy Assistant: 1
Staff by category
Certified Nursing Assistant6106118,97091100%9.2
Licensed Practical Nurse3003010,72891100%9.3
Other Dietary Services Staff9092,15891100%6.1
Clinical Nurse Specialist4151,9666875%8.5
Registered Nurse9091,7838998%11.5
Mental Health Service Worker1125546167%8.9
Feeding Assistant0115206571%8
Nurse Practitioner1015126470%8
Dietitian1015006066%8.3
Administrator1014886167%8
Physical Therapy Aide2024156369%6.5
Occupational Therapy Aide1123283640%8.8
Speech Language Pathologist1013066167%5
Qualified Social Worker1012074145%5.1
Physical Therapy Assistant202623640%1.7
Occupational Therapy Assistant0113233%10.5
Medical Director011589%0.7
61 Certified Nursing Assistant
% of Days 100%
30 Licensed Practical Nurse
% of Days 100%
9 Other Dietary Services Staff
% of Days 100%
5 Clinical Nurse Specialist
% of Days 75%
9 Registered Nurse
% of Days 98%
2 Mental Health Service Worker
% of Days 67%
1 Feeding Assistant
% of Days 71%
1 Nurse Practitioner
% of Days 70%
1 Dietitian
% of Days 66%
1 Administrator
% of Days 67%
2 Physical Therapy Aide
% of Days 69%
2 Occupational Therapy Aide
% of Days 40%
1 Speech Language Pathologist
% of Days 67%
1 Qualified Social Worker
% of Days 45%
2 Physical Therapy Assistant
% of Days 40%
1 Occupational Therapy Assistant
% of Days 3%
1 Medical Director
% of Days 9%

Facility Characteristics

Source: CMS Long-Term Care Facility Characteristics (Data as of Jan 2026)

Total residents 111
Medicare
7
6.3% of residents
Medicaid
97
87.4% of residents
Private pay or other
7
6.3% of residents
Programs & Services
Residents Group

Residents meet regularly to discuss policies, care quality, and activities

Active Resident Council

Organized group of residents that meets regularly to discuss facility policies, quality of life, and activities.

Quality of care over time

These measures show how residents usually do over time at this home, based on health outcomes and preventive care.

High-risk clinical events score Info A composite score based on pressure ulcers, falls with injury, weight loss, walking ability decline, and activities of daily living decline. 12.8
52% worse than Michigan average

Michigan average: 8.4

Functional decline score Info A composite score based on activities of daily living decline, walking ability decline, and incontinence. 21.6
32% worse than Michigan average

Michigan average: 16.3

Long-stay resident measures
Average Michigan avg: 4.1 Info CMS star rating based on long-stay quality measure performance. 5 stars = significantly above average, 1 star = significantly below average.
Need for Help with Daily Activities Increased Info Percent of long-stay residents whose need for help with daily activities has increased 20.4%
63% worse than Michigan average

Michigan average: 12.5%

Walking Ability Worsened Info Percent of long-stay residents whose ability to move independently worsened 26.3%
72% worse than Michigan average

Michigan average: 15.3%

Low Risk Residents with Bowel/Bladder Incontinence Info Percent of low risk long-stay residents who lose control of their bowels or bladder 17.9%
15% better than Michigan average

Michigan average: 21.0%

Falls with Major Injury Info Percent of long-stay residents experiencing one or more falls with major injury 4.0%
27% worse than Michigan average

Michigan average: 3.2%

High Risk Residents with Pressure Ulcers Info Percent of long-stay high risk residents with pressure ulcers 4.8%
16% better than Michigan average

Michigan average: 5.7%

Urinary Tract Infection Info Percent of long-stay residents with a urinary tract infection 1.3%
24% better than Michigan average

Michigan average: 1.7%

Lost Too Much Weight Info Percent of long-stay residents who lose too much weight 8.3%
47% worse than Michigan average

Michigan average: 5.7%

Depressive Symptoms Info Percent of long-stay residents who have depressive symptoms 0.6%
85% better than Michigan average

Michigan average: 3.9%

Antipsychotic Use Info Percent of long-stay residents who received an antipsychotic medication 24.2%
62% worse than Michigan average

Michigan average: 15.0%

Pneumococcal Vaccine Info Percent of long-stay residents assessed and appropriately given the pneumococcal vaccine 98.5%
In line with Michigan average

Michigan average: 94.9%

Influenza Vaccine Info Percent of long-stay residents assessed and appropriately given the seasonal influenza vaccine 100.0%
5% better than Michigan average

Michigan average: 95.0%

Hospitalizations per 1,000 days Info Number of hospitalizations per 1,000 long-stay resident days. 1.93
11% worse than Michigan average

Michigan average: 1.74

ED visits per 1,000 days Info Number of outpatient emergency department visits per 1,000 long-stay resident days. 0.94
39% better than Michigan average

Michigan average: 1.54

Short-stay resident measures
Below average Michigan avg: 3.3 Info CMS star rating based on short-stay quality measure performance. 5 stars = much above average, 1 star = much below average.
Pneumococcal Vaccine Info Percent of short-stay residents assessed and appropriately given the pneumococcal vaccine 81.9%
In line with Michigan average

Michigan average: 82.5%

Antipsychotic medication increase Info Percent of short-stay residents who newly received an antipsychotic medication 0.5%
65% better than Michigan average

Michigan average: 1.4%

Influenza Vaccine Info Percent of short-stay residents assessed and appropriately given the seasonal influenza vaccine 72.1%
9% worse than Michigan average

Michigan average: 79.5%

Re-hospitalized after SNF stay Info Percentage of short-stay residents who were re-hospitalized after their nursing home admission. 27.3%
13% worse than Michigan average

Michigan average: 24.2%

Emergency department visits Info Percentage of short-stay residents who had an outpatient emergency department visit. 10.7%
7% better than Michigan average

Michigan average: 11.5%

Falls with major injury Info Percentage of SNF residents who experience falls with major injury during their stay. 2.8%
261% worse than Michigan average

Michigan average: 0.8%

Ability to care for self at discharge Info Percentage of residents at or above expected ability to care for themselves at discharge. 40.6%
24% worse than Michigan average

Michigan average: 53.7%

Successful return to home or community Info Rate of successful return to home or community from a skilled nursing facility. 49.0%
In line with Michigan average

Michigan average: 50.6%

Penalties and fines

Federal penalties imposed by CMS for regulatory violations, including civil money penalties (fines) and denials of payment for new Medicare/Medicaid admissions.

Source: CMS Penalties Database (Data as of Jan 2026)

Total fines amount $9K
88% lower than Michigan average

Michigan average: $76K

Number of fines 1
51% fewer fines than Michigan average

Michigan average: 2.0

Payment Denials Info Serious action where Medicare and/or Medicaid temporarily stops payments for new residents until issues are fixed. 0
100% fewer payment denials than Michigan average

Michigan average: 0.8

Fines amount comparison
This facility $9K
Michigan average $76K
Penalty History

Penalties are imposed by CMS for violations of federal nursing home regulations.

1 penalty in the past 3 years

Oct 3, 2024 · $9K

Civil Money Penalty Info Fines imposed for noncompliance, which can be assessed per day or per instance of violation. Oct 3, 2024
$9K

Last updated: Jan 2026

Compare Assisted Living around Wayne County The information below is reported by the Michigan Department of Licensing and Regulatory Affairs (LARA).

Filter by care type
The Orchards Michigan – Wayne
AL

Assisted Living A licensed, long-term care setting for seniors or individuals with disabilities who need help with daily activities — like bathing, dressing, and medication management — but not 24-hour skilled nursing. Offers housing, meals, and around-the-clock support while aiming to maximize resident independence.

NH

Nursing Home Licensed facility providing 24/7 skilled nursing care for residents with complex, ongoing medical needs. Staffed by RNs, LPNs, and CNAs. Inspected and star-rated annually by CMS. Accepts Medicare (short-term rehab) and Medicaid (long-term care).

Wayne179Yes 7 -------
Cedarbrook of Northville
AL

Assisted Living A licensed, long-term care setting for seniors or individuals with disabilities who need help with daily activities — like bathing, dressing, and medication management — but not 24-hour skilled nursing. Offers housing, meals, and around-the-clock support while aiming to maximize resident independence.

Plymouth (Plymouth Charter Township)96No 42 -12A+351.715700 N. Haggerty Road Llc
Glen Abbey Assisted Living & Memory Care
AL

Assisted Living A licensed, long-term care setting for seniors or individuals with disabilities who need help with daily activities — like bathing, dressing, and medication management — but not 24-hour skilled nursing. Offers housing, meals, and around-the-clock support while aiming to maximize resident independence.

MC

Memory Care Secured, specialized care for people living with Alzheimer's or dementia. Staff trained in cognitive impairment, with higher staff-to-resident ratios and an environment designed to reduce confusion and wandering risk.

Canton (North Lotz Road)64Yes 13 -39A+7101.4Lotz Road Opco Llc
Heart To Home Residential Assisted Living
AL

Assisted Living A licensed, long-term care setting for seniors or individuals with disabilities who need help with daily activities — like bathing, dressing, and medication management — but not 24-hour skilled nursing. Offers housing, meals, and around-the-clock support while aiming to maximize resident independence.

Belleville (Roulo)14No 0 Private / Semi-Private Rooms1-3-0.0Heart To Home Llc
The Westland House
AL

Assisted Living A licensed, long-term care setting for seniors or individuals with disabilities who need help with daily activities — like bathing, dressing, and medication management — but not 24-hour skilled nursing. Offers housing, meals, and around-the-clock support while aiming to maximize resident independence.

Westland-No 34 --A+----

Guides for Better Senior Living

Care Cost Calculator: See Prices in Your Area

Nursing Home Data Explorer

Don’t Wait Too Long: 7 Red Flag Signs Your Parent Needs Assisted Living Now

The True Cost of Assisted Living in 2025 – And How Families Are Paying For It

Understanding Senior Living Costs: Pricing Models, Discounts & Financial Assistance

Frequently Asked Questions about The Orchards Michigan – Wayne

Is The Orchards Michigan – Wayne in a walkable area?

The Orchards Michigan – Wayne has a walk score of 7. Car-dependent. Most errands require a car, with limited nearby walkable options.

What is the address of The Orchards Michigan – Wayne?

The Orchards Michigan – Wayne is located at 4427 Venoy Rd, Wayne, MI 48184, United States.

What is the phone number of The Orchards Michigan – Wayne?

(734) 729-4436 will put you in contact with the team at The Orchards Michigan – Wayne.

Is The Orchards Michigan – Wayne Medicare or Medicaid certified?

Yes — The Orchards Michigan – Wayne is a CMS-certified provider of Medicare and Medicaid.

Explore Open Rooms
1 Contact details
2 What type of senior care service are you looking for?
3 What budget do you have in mind for senior care?
4 How soon do you need to find care?
5 Additional details

Thank you for your interest!

Our team will be in touch shortly to help with next steps.