The Peaks, A Senior Living Community
Nursing Home, Independent Living, Assisted Living, Memory Care & Respite Care · Flagstaff, AZ
CMS overall rating Info CMS (the Centers for Medicare & Medicaid Services) is the federal agency that rates nursing home quality. Its Overall Rating runs from 1 to 5 stars, combining health inspections, staffing, and quality measures, with inspections weighted most heavily.

The Peaks, A Senior Living Community

Nursing Home, Independent Living, Assisted Living, Memory Care & Respite Care · Flagstaff, AZ
CMS overall rating Info CMS (the Centers for Medicare & Medicaid Services) is the federal agency that rates nursing home quality. Its Overall Rating runs from 1 to 5 stars, combining health inspections, staffing, and quality measures, with inspections weighted most heavily.
Calculator: See prices in your area
The Peaks, A Senior Living Community accepts Medicare, Medicaid, and private pay.

Overview of The Peaks, a Senior Living Community

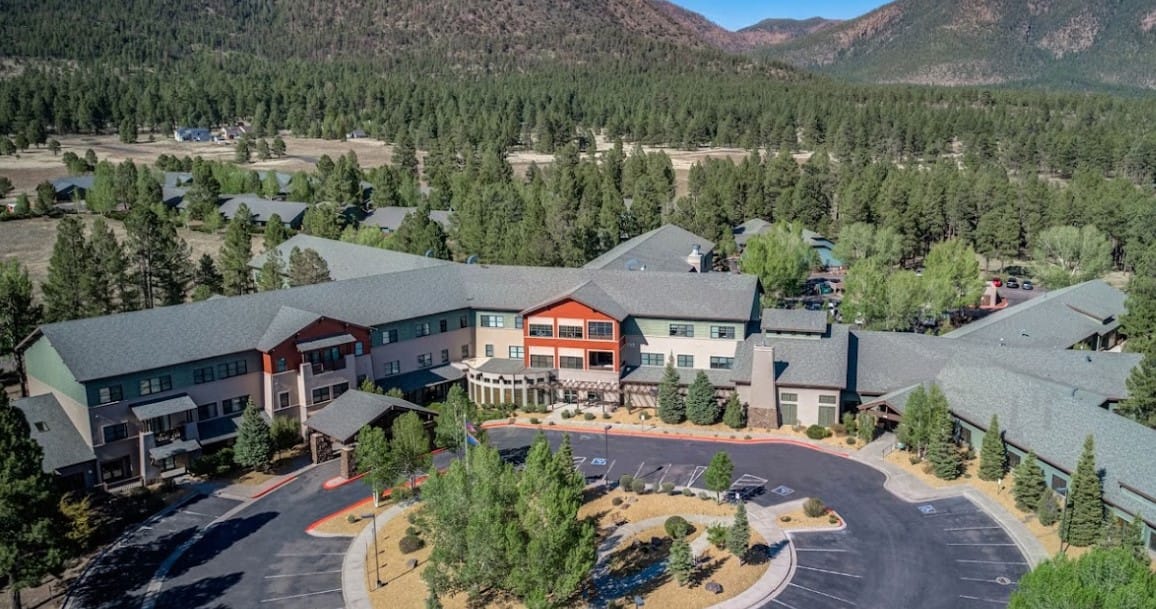
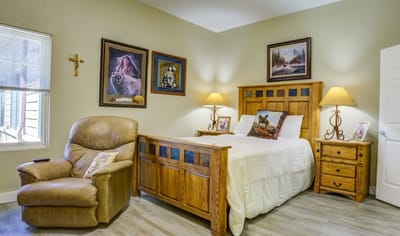
Serving the area of Flagstaff, AZ, The Peaks, a Senior Living Community is a compassionate senior living community that aims to provide a healthy aging lifestyle. The community offers bungalow living, independent living, assisted living, and memory care to accommodate residents’ ever-changing needs. Residences here are equipped with convenient features and services like housekeeping and maintenance for residents’ convenience.

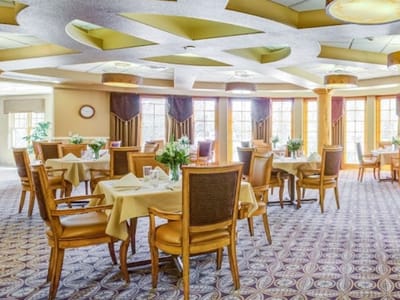
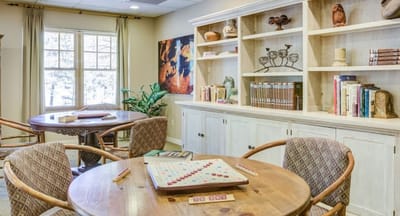
Cozy common areas, fun activities, and amenities like a salon, fitness center, pool, spa, and library are offered to keep residents stimulated and entertained. Chef-inspired meals are served restaurant-style, giving residents an enjoyable dining experience. With 24-hour team members and emergency call systems, residents here enjoy a comfortable life within a safe and secure setting.

(928) 774-7106

Quality ratings

Measured by Centers for Medicare & Medicaid Services (CMS)

Overall rating Info The Overall CMS Rating combines results from health inspections, staffing levels and quality measures. Health inspections carry the most weight. Staffing and quality scores can increase or decrease the final rating based on performance compared to state and national standards.
▼ 42.0% Below AZ avg. ▼ 42.0% Below AZ avg.Click the badge to see the full State ranking.Click here to see the full State ranking.
Health Inspection Info Based on the results of the facility's three most recent standard inspections and any complaint investigations. CMS reviews the number, scope, and severity of deficiencies, with more recent findings weighted more heavily.
▼ 28.3% Below AZ avg. ▼ 28.3% Below AZ avg.Click the badge to see the full State ranking.Click here to see the full State ranking.
Staffing Info Measures average nursing staff hours per resident per day, including Registered Nurses (RNs) and total nursing staff. Ratings are adjusted based on the level of care residents require and are compared to state and national benchmarks.
▲ 15.6% Above AZ avg. ▲ 15.6% Above AZ avg.Click the badge to see the full State ranking.Click here to see the full State ranking.
Quality Measures Info Based on clinical and physical health indicators reported to CMS, such as hospital readmissions, falls, pressure ulcers, and improvements in mobility. These measures reflect how well residents' health needs are being managed.
▼ 13.4% Below AZ avg. ▼ 13.4% Below AZ avg.Click the badge to see the full State ranking.Click here to see the full State ranking.

Staffing hours breakdown

Info Daily nursing hours per resident by staff type, reported to CMS. Higher is generally better — compare this facility to state and national averages to see where staffing stands.

Hours per resident per day — compared to Arizona state averages

Total nursing care / resident Info This home is ranked 22nd out of 72 homes in Arizona for nurse hours. Total adjusted nursing hours per resident per day, combining RN, LPN, and aide time. CMS adjusts this for case-mix so facilities can be fairly compared.
4h 10m per day
Rank #22 / 72Nurse hours — State benchmarkedThis home is ranked 22nd out of 72 homes in Arizona for nurse hours. Shows adjusted nurse hours per resident per day benchmarked to the Arizona average, with a ranking across 72 Arizona SNFs. More hours mean more direct care. The national average is about 3.5 hrs; below 3.0 is a red flag.Click the rank badge to see the full State ranking.Click here to see the full State ranking.
This facility Arizona avg (4h 11m per day)
vs Arizona avg
+0%

0 of 1 metrics below state avg

Standout metric Weekend Total Nursing is +10% above state avg
Staff typeHours / Day / Residentvs state avg
Weekend Total Nursing Info Combined nursing hours (RN + LPN + Nurse Aide) per resident per day on weekends. Staffing often drops on weekends — this figure reveals whether the facility maintains adequate coverage outside of weekday hours. 3h 59m per day ▲ 10% State avg: 3h 37m per day · National avg: 3h 25m per day

Capacity and availability

Avg. Length of Stay
36 days
Bed community size
92-bed community Rank #150 / 529Bed count — State benchmarkedThis home is ranked 150th out of 529 homes in Arizona for bed count. Shows this facility's certified or reported bed count compared to other Arizona SNFs. Larger communities may offer more amenities, programs, and on-site services for residents and families.Click the rank badge to see the full State ranking.Click here to see the full State ranking.
A larger shared setting that may offer more common spaces and organized community services.
Years in operation
25 years in operation Rank #53 / 531Years in operation — State benchmarkedThis home is ranked 53rd out of 531 homes in Arizona for years in operation. Shows how long this facility has been in operation compared to other Arizona SNFs. Longer operating histories may benefit residents, families, and staff.Click the rank badge to see the full State ranking.Click here to see the full State ranking.
A longer operating history, which may indicate experience navigating regulations and delivering ongoing care.
Walk Score
Walk Score: 5 / 100 Rank #742 / 819Walk Score — State benchmarkedThis home is ranked 742nd out of 819 homes in Arizona for walk score. Shows how walkable this facility's neighborhood is compared to the average Walk Score across Arizona SNFs. Higher scores benefit residents, families, and staff.Click the rank badge to see the full State ranking.Click here to see the full State ranking.
Car-dependent. Most errands require a car, with limited nearby walkable options.
BBB Rating
BBB Rating: A+ (Not Accredited)
An independent rating from the Better Business Bureau based on factors such as complaint history, transparency, and business practices.
How BBB ratings work

About this community

License Details

Facility TypeAssisted Living Center
StatusActive
IssuanceDecember 4, 2000
ExpirationJuly 31, 2026
License NumberAL2532C
QualificationHealth Care

Ownership & Operating Entity

The Peaks, A Senior Living Community is administrated by Gary Olson.

OwnerNORTHERN ARIZONA SENIOR LIVING COMMUNITY, L.L.C.

Contact The Peaks, A Senior Living Community

Inspection History

In Arizona, the Department of Health Services, Bureau of Long Term Care Licensing performs regular onsite inspections and investigates complaints for all licensed residential and nursing facilities.

Since 2022 · 4 years of data 33 deficiencies 13 complaints 15 inspections
Inspection Score Info A composite 0–100 score combining this facility's inspections, citations, complaints, and enforcement actions relative to the Arizona state average. The score below shows how many points this facility sits above or below the typical Arizona nursing home score (the benchmark); higher is better.

17 points below the Arizona average for nursing homes (82/100)

Inspection score: 65 out of 100. Letter grade D. 17 points below the Arizona average for nursing homes (82/100)

Inspection Scorecard Info This scorecard compares key inspection, citation, and complaint metrics at this facility against the Arizona state average. Metrics rated ≥15% worse than average are highlighted in red; those ≥15% better are highlighted in green.

Since 2022 vs. Arizona state average
Overall vs. AZ average 7 Worse Metrics worse than Arizona average:
• Total deficiencies (267% above)
• Deficiencies per year (261% above)
• Deficiencies per inspection (22% above)
• Enforcement actions (11% above)
• Total inspections (200% above)
• Total complaints (117% above)
• Complaints per year (120% above)
0 Better No metrics in this bucket.
Latest Inspection November 3, 2025 Complaint No deficiencies

Deficiencies Info Deficiencies are formal regulatory issues recorded during state inspections.

This FacilityAZ Averagevs. AZ Avg
Total deficiencies Info Formal regulatory issues recorded by inspectors across all inspection types. 339 This facility has 267% more total deficiencies than a typical Arizona nursing home (33 vs. AZ avg 9).↑ 267% worse Rank #489 / 500 Total deficiencies — State benchmarked This home is ranked 489th out of 500 homes in Arizona. Shows this facility's deficiencies compared to the Arizona average among 500 comparable communities in the ranking pool.
Deficiencies per year Info Average deficiencies per year since 2022. 8.32.3 This facility has 261% more deficiencies per year than a typical Arizona nursing home (8.3 vs. AZ avg 2.3).↑ 261% worse
Deficiencies per inspection Info Average deficiencies per inspection. 2.21.8 This facility has 22% more deficiencies per inspection than a typical Arizona nursing home (2.2 vs. AZ avg 1.8).↑ 22% worse Rank #442 / 500 Deficiencies per inspection — State benchmarked This home is ranked 442nd out of 500 homes in Arizona. Shows this facility's deficiencies per inspection compared to the Arizona average among 500 comparable communities in the ranking pool.
Enforcement actions Info Formal penalties or interventions imposed by Arizona regulators — directed plans of correction, civil monetary penalties, denial of payment, or appointment of temporary management. 10.9 This facility has 11% more enforcement actions than a typical Arizona nursing home (1 vs. AZ avg 0.9).↑ 11% worse

Inspections Info State inspections evaluate whether the facility meets health and safety standards.

This FacilityAZ Averagevs. AZ Avg
Total inspections Info Combined count of all routine and focused inspections. Excludes complaint investigations. 155 This facility has 200% more total inspections than a typical Arizona nursing home (15 vs. AZ avg 5).↑ 200% worse

Complaints & Investigations Info Complaints are formal concerns filed by residents, families, or staff. Investigations are on-site follow-ups.

This FacilityAZ Averagevs. AZ Avg
Total complaints Info Formal expressions of concern made by residents, families, or staff. 136 This facility has 117% more total complaints than a typical Arizona nursing home (13 vs. AZ avg 6).↑ 117% worse Rank #467 / 500 Total complaints — State benchmarked This home is ranked 467th out of 500 homes in Arizona. Shows this facility's complaint-related visits compared to the Arizona average among 500 comparable communities in the ranking pool.
Complaints per year Info Average complaints per year since 2022. 3.31.5 This facility has 120% more complaints per year than a typical Arizona nursing home (3.3 vs. AZ avg 1.5).↑ 120% worse

Inspection Reports Summary Info An editor-reviewed summary of the themes and findings across this facility's recent inspection reports.

  • The most recent inspection on November 4, 2025 found no deficiencies during the complaint investigation.
  • The July 10, 2025 complaint investigation found failure to timely report suspected abuse involving Resident #5.
  • The November 7, 2024 routine and complaint inspections found 12 deficiencies including medication errors (21.43% error rate), incomplete care plans, and failure to prevent and report resident abuse.

Health Inspection History

Inspections since 2022
Total health inspections 5

Arizona average 6.3


Last Health inspection on Jul 2025

Total health citations
28 Rank #49 / 76Health citations — State benchmarkedThis home is ranked 49th out of 76 homes in Arizona for health citations. Shows this facility's total health deficiency citations benchmarked to the Arizona State average, with a ranking across all 76 AZ SNFs. Lower citation counts earn a better rank.Click the rank badge to see the full State ranking.Click here to see the full State ranking.

Arizona average 23.2

Citations per inspection
5.6 Rank #69 / 76Citations per inspection — State benchmarkedThis home is ranked 69th out of 76 homes in Arizona for citations per inspection. Shows average deficiency citations per CMS inspection for this facility versus the Arizona mean across 76 SNFs with citation data. Lower is better.Click the rank badge to see the full State ranking.Click here to see the full State ranking.

Arizona average 3.82


Health citations are formal notices following inspections when they fail to comply with safety and care standards.

22 of 28 citations resulted from standard inspections; 2 of 28 resulted from complaint investigations; and 4 of 28 came from combined inspections (standard and complaint).

Breakdown of citation severity (last 4 years)
Critical health citations
0
100% better than Arizona average

Arizona average: 0.1


Serious health citations
1
67% worse than Arizona average

Arizona average: 0.6

0 critical citations Arizona average: 0.1

1 serious citation Arizona average: 0.6

26 moderate citations Arizona average: 22.3

1 minor citation Arizona average: 0.2
Citations history (last 4 years)
Abuse/Neglect moderate citation Jul 10, 2025
Corrected

Care Planning moderate citation Jan 29, 2025
Corrected

Abuse/Neglect moderate citation Nov 07, 2024
Corrected

Abuse/Neglect moderate citation Nov 07, 2024
Corrected

Staffing Data

Reporting period: October 1 – December 31, 2025 (Q4 2025). Source: CMS Payroll-Based Journal report.

Total staff 110
Employees 64
Contractors 46
Staff to resident ratio 2.89 : 1
61% more staff per resident than Arizona average
Arizona average ratio: 1.80 : 1 Arizona average ratio: 1.80 : 1See full Arizona ranking
Avg staff/day 29
Average shift 8.1 hours
5% worse than Arizona average
Arizona average: 8.5 hours Arizona average shift: 8.5 hoursSee full Arizona ranking
Total staff hours (quarter) 21,576

Nursing staff breakdown

Q4 2025 · Oct 1 – Dec 31 More info This data comes from the CMS Payroll-Based Journal report covering October 1 – December 31, 2025.
Registered Nurse

Manages medical care and health needs.

RN Staff Info 13 total: 6 full-time employees and 7 contractors. 13
Average shift length Info Average shift length. Calculated as total hours divided by days worked and average staff per day. 8.7 hours
Licensed Practical Nurse

Assists with medical care and medications.

LPN Staff Info 16 total: 4 full-time employees and 12 contractors. 16
Average shift length Info Average shift length. Calculated as total hours divided by days worked and average staff per day. 10.3 hours
Certified Nursing Assistant

Helps with daily care and mobility.

CNA Staff Info 51 total: 39 full-time employees and 12 contractors. 51
Average shift length Info Average shift length. Calculated as total hours divided by days worked and average staff per day. 8.8 hours

Contractor staffing

Q4 2025 · Oct 1 – Dec 31 More info This data comes from the CMS Payroll-Based Journal report covering October 1 – December 31, 2025.

Total hours from contractors

19.1%

4,113 contractor hours this quarter

Certified Nursing Assistant: 12 Licensed Practical Nurse: 12 Registered Nurse: 7 Occupational Therapy Aide: 4 Speech Language Pathologist: 3 Respiratory Therapy Technician: 3 Physical Therapy Assistant: 2 Qualified Social Worker: 1 Physical Therapy Aide: 1 Medical Director: 1

Staff by category

Q4 2025 · Oct 1 – Dec 31 More info This data comes from the CMS Payroll-Based Journal report covering October 1 – December 31, 2025.
Certified Nursing Assistant39125110,11792100%8.8
Licensed Practical Nurse412162,5369199%10.3
Registered Nurse67132,0889199%8.7
Clinical Nurse Specialist2029776571%8.3
Nurse Aide in Training4049565661%7.7
Other Dietary Services Staff3036648087%7.2
Speech Language Pathologist0335687480%6.9
Respiratory Therapy Technician0335216672%7.3
Mental Health Service Worker1015106470%8
Administrator1014886166%8
Nurse Practitioner1014645863%8
Dietitian1014365560%7.9
Physical Therapy Assistant0224156874%6.1
Qualified Activities Professional1013554751%7.6
Qualified Social Worker0112004852%4.2
Occupational Therapy Aide0441175863%1.6
Dental Services Staff101681213%5.6
Physical Therapy Aide011521718%3
Medical Director0114567%7.5
51 Certified Nursing Assistant
% of Days 100%
16 Licensed Practical Nurse
% of Days 99%
13 Registered Nurse
% of Days 99%
2 Clinical Nurse Specialist
% of Days 71%
4 Nurse Aide in Training
% of Days 61%
3 Other Dietary Services Staff
% of Days 87%
3 Speech Language Pathologist
% of Days 80%
3 Respiratory Therapy Technician
% of Days 72%
1 Mental Health Service Worker
% of Days 70%
1 Administrator
% of Days 66%
1 Nurse Practitioner
% of Days 63%
1 Dietitian
% of Days 60%
2 Physical Therapy Assistant
% of Days 74%
1 Qualified Activities Professional
% of Days 51%
1 Qualified Social Worker
% of Days 52%
4 Occupational Therapy Aide
% of Days 63%
1 Dental Services Staff
% of Days 13%
1 Physical Therapy Aide
% of Days 18%
1 Medical Director
% of Days 7%

Penalties and fines

Federal penalties imposed by CMS for regulatory violations, including civil money penalties (fines) and denials of payment for new Medicare/Medicaid admissions.

Source: CMS Penalties Database

No penalties in the past 3 years

No civil money penalties or payment denials were reported in the last 3 years.

Quality of care over time

These measures show how residents usually do over time at this home, based on health outcomes and preventive care.

High-risk clinical events score Info A composite score based on pressure ulcers, falls with injury, weight loss, walking ability decline, and activities of daily living decline. 8.0
5% worse than Arizona average

Arizona average: 7.6

Functional decline score Info A composite score based on activities of daily living decline, walking ability decline, and incontinence. 20.0
24% worse than Arizona average

Arizona average: 16.1

Long-stay resident measures
Need for Help with Daily Activities Increased Info Percent of long-stay residents whose need for help with daily activities has increased 7.7%
32% better than Arizona average

Arizona average: 11.2%

Low Risk Residents with Bowel/Bladder Incontinence Info Percent of low risk long-stay residents who lose control of their bowels or bladder 32.3%
55% worse than Arizona average

Arizona average: 20.8%

Falls with Major Injury Info Percent of long-stay residents experiencing one or more falls with major injury 1.8%
13% better than Arizona average

Arizona average: 2.1%

High Risk Residents with Pressure Ulcers Info Percent of long-stay high risk residents with pressure ulcers 16.4%
223% worse than Arizona average

Arizona average: 5.1%

Urinary Tract Infection Info Percent of long-stay residents with a urinary tract infection 1.9%
41% worse than Arizona average

Arizona average: 1.3%

Lost Too Much Weight Info Percent of long-stay residents who lose too much weight 6.0%
11% worse than Arizona average

Arizona average: 5.4%

Depressive Symptoms Info Percent of long-stay residents who have depressive symptoms 10.3%
130% worse than Arizona average

Arizona average: 4.5%

Antipsychotic Use Info Percent of long-stay residents who received an antipsychotic medication 13.8%
34% worse than Arizona average

Arizona average: 10.3%

Pneumococcal Vaccine Info Percent of long-stay residents assessed and appropriately given the pneumococcal vaccine 98.2%
In line with Arizona average

Arizona average: 97.2%

Influenza Vaccine Info Percent of long-stay residents assessed and appropriately given the seasonal influenza vaccine 100.0%
6% better than Arizona average

Arizona average: 94.6%

Short-stay resident measures
Pneumococcal Vaccine Info Percent of short-stay residents assessed and appropriately given the pneumococcal vaccine 90.8%
In line with Arizona average

Arizona average: 91.5%

Antipsychotic medication increase Info Percent of short-stay residents who newly received an antipsychotic medication 2.7%
160% worse than Arizona average

Arizona average: 1.0%

Influenza Vaccine Info Percent of short-stay residents assessed and appropriately given the seasonal influenza vaccine 93.1%
7% better than Arizona average

Arizona average: 87.3%

Breakdown by payment type

Medicare

40% of new residents, usually for short-term rehab.

Typical stay 21 days

Private pay

39% of new residents, often for short stays.

Typical stay 24 days

Medicaid

21% of new residents, often for long-term daily care.

Typical stay 2 - 3 months

Facility Characteristics

Source: CMS Long-Term Care Facility Characteristics (Data as of Jan 2026)

Total residents 38
Medicare
12
31.6% of residents
Medicaid
26
68.4% of residents
Programs & Services
Residents Group

Residents meet regularly to discuss policies, care quality, and activities

CCRC

Part of a Continuing Care Retirement Community offering multiple care levels

Active Resident Council

Organized group of residents that meets regularly to discuss facility policies, quality of life, and activities.

Finances and operations

Voluntary non-profit community
Home revenue
$12.9M
Operating deficit
-$1.8M
Voluntary non-profit community
Home revenue
$12.9M Rank #39 / 80Revenue — State benchmarkedThis home is ranked 39th out of 80 homes in Arizona for revenue. Shows this facility's annual revenue compared to the Arizona SNF average. Higher revenue generally means more resources for staffing and capital — read alongside Payroll %.Click the rank badge to see the full State ranking.Click here to see the full State ranking.
Operating deficit
-$1.8M
Payroll costs Info The portion of the home's budget spent on staff, including nurses, caregivers, and other employees who support care and operations. Rank #35 / 80Payroll — State benchmarkedThis home is ranked 35th out of 80 homes in Arizona for payroll. Shows total annual staff payroll benchmarked to the Arizona average. Higher payroll investment relative to peers often signals better staffing and less reliance on cheaper contract labor.Click the rank badge to see the full State ranking.Click here to see the full State ranking.
$7.7M
60% of revenue Rank #20 / 80Payroll % — State benchmarkedThis home is ranked 20th out of 80 homes in Arizona for payroll %. Shows payroll as a percentage of revenue versus the Arizona average. Well-run Arizona SNFs typically land around 58–71% — the top third Statewide. Below 25% may signal understaffing or heavy agency use — read with Staffing ratings.Click the rank badge to see the full State ranking.Click here to see the full State ranking.
Other operating costs Info All remaining costs needed to run the home, such as food, utilities, building maintenance, supplies and administrative expenses.
$7.0M
Total costs $14.7M

What does this home offer?

Pets allowed icon
Pets allowed icon

Pets Allowed

Housing options icon

Housing Options: Studio

Building type icon
Building type icon

Building Type: Two-story

Dining services icon

Three Meals Per Day

Fitness and recreation icon

Fitness and Recreation

Transportation services icon

Transportation Services

Who this home usually serves

TYPE OF STAY

Mostly short-term rehab stays

Most residents typically stay for a few weeks or months before returning home or moving on.

Places of interest near The Peaks, A Senior Living Community

Address 3.2 miles from city center Info Estimated distance in miles from Flagstaff's city center to The Peaks, A Senior Living Community's address, calculated via Google Maps.

Calculate Travel Distance to The Peaks, A Senior Living Community

Add your location

Address

Financial Assistance for
Nursing Home in Arizona

The Peaks, A Senior Living Community is located in Flagstaff, Arizona.
Here are the financial assistance programs available to residents in Arizona.

Get Financial aid guidance

Arizona Long Term Care System

ALTCS

Age 65+ or disabled
General Arizona resident, Medicaid-eligible, nursing home-level care need.
Income Limits (2025) ~$2,829/month 300% FBR, individual
Asset Limits $2,000 (individual), $3,000 (couple).
AZ

Covers tribal members; rural outreach.

Benefits
In-home care (6-8 hours/day) Assisted living Nursing home care Medical services Transportation (10 trips/month)

Non-Medical Home and Community Based Services

AZ DES Non-Medical HCBS

Age 60+
General Arizona resident, at risk of institutionalization.
Income Limits ~$2,000/month individual, varies
Asset Limits $10,000 individual
AZ

Limited funding; waitlists common.

Benefits
Homemaker services (3-5 hours/week) Respite care (up to 10 days/year) Adult day care (~$60/day)

Weatherization Assistance Program (WAP)

AZ WAP

Age 60+ priority
General Arizona resident, own/rent home, low-income.
Income Limits (2025) ~$2,510/month 200% of poverty level, individual
Asset Limits Not applicable; income-focused.
AZ

High demand in rural desert areas; limited annual funds.

Benefits
Insulation Weather stripping HVAC repairs (avg. $500-$1,000/year savings)

Section 202 Supportive Housing for the Elderly

AZ Section 202

Age 62+
General Arizona resident, very low income, able to live independently with support.
Income Limits (2025) ~$1,645/month 50% of area median income, individual, varies by county
Asset Limits $10,000 individual, excludes home if owned
AZ

Limited units; high demand in metro areas like Phoenix.

Benefits
Subsidized rent (30% of income, e.g., $300-$500/month) On-site services (housekeeping, transportation, ~$200/month value)

Arizona CARES Program

AZ CARES

Age
General Caregivers of Arizona residents 60+ needing help with 3+ daily activities; no caregiver age limit.
Income Limits No strict limit; cost-sharing above ~$2,500/month threshold.
Asset Limits Not applicable; need-based.
AZ

Focus on rural access; complements ALTCS respite.

Benefits
Respite care (up to 10 days/year) Counseling (4-6 sessions/year) Training (2-3 workshops/year) Supplies (~$200/year)

AZ DES Non-Medical Home and Community Based Services (HCBS)

AZ DES Non-Medical HCBS

Age 60+ or disabled
General Arizona resident, need assistance with daily activities, not eligible for Medicaid/ALTCS.
Income Limits Above Medicaid threshold but low-income ~$1,500-$2,500/month, varies by region
Asset Limits Not specified; income-driven eligibility.
AZ

Targets those ineligible for ALTCS; prioritizes rural and tribal areas.

Benefits
Homemaker services (3-5 hours/week) Personal care (limited hours) Respite care (up to 10 days/year) Transportation (~5 trips/month)

Frequently Asked Questions about The Peaks, A Senior Living Community

What neighborhood is The Peaks, A Senior Living Community in?

The Peaks, A Senior Living Community is in the Coyote Springs neighborhood of Flagstaff.

Who is the owner of The Peaks, A Senior Living Community?

The legal owner and operator of The Peaks, A Senior Living Community is Northern Arizona Senior Living Community, L.l.c..

Is The Peaks, A Senior Living Community in a walkable area?

The Peaks, A Senior Living Community has a walk score of 5. Car-dependent. Most errands require a car, with limited nearby walkable options.

What is the license number of The Peaks, A Senior Living Community?

According to AZ state health department records, The Peaks, A Senior Living Community's license number is AL2532C.

When does The Peaks, A Senior Living Community's license expire?

According to AZ state health department records, The Peaks, A Senior Living Community's license expires on July 31, 2026.

Who is the administrator of The Peaks, A Senior Living Community?

Gary Olson is the administrator of The Peaks, A Senior Living Community.

How many beds does The Peaks, A Senior Living Community have?

The Peaks, A Senior Living Community has 92 beds.

Guides for Better Senior Living

Care Cost Calculator: See Prices in Your Area

Nursing Home Data Explorer

Don’t Wait Too Long: 7 Red Flag Signs Your Parent Needs Assisted Living Now

The True Cost of Assisted Living in 2025 – And How Families Are Paying For It

Understanding Senior Living Costs: Pricing Models, Discounts & Financial Assistance

Explore Open Rooms
1 Contact details
2 What type of senior care service are you looking for?
3 What budget do you have in mind for senior care?
4 How soon do you need to find care?
5 Additional details

Thank you for your interest!

Our team will be in touch shortly to help with next steps.