


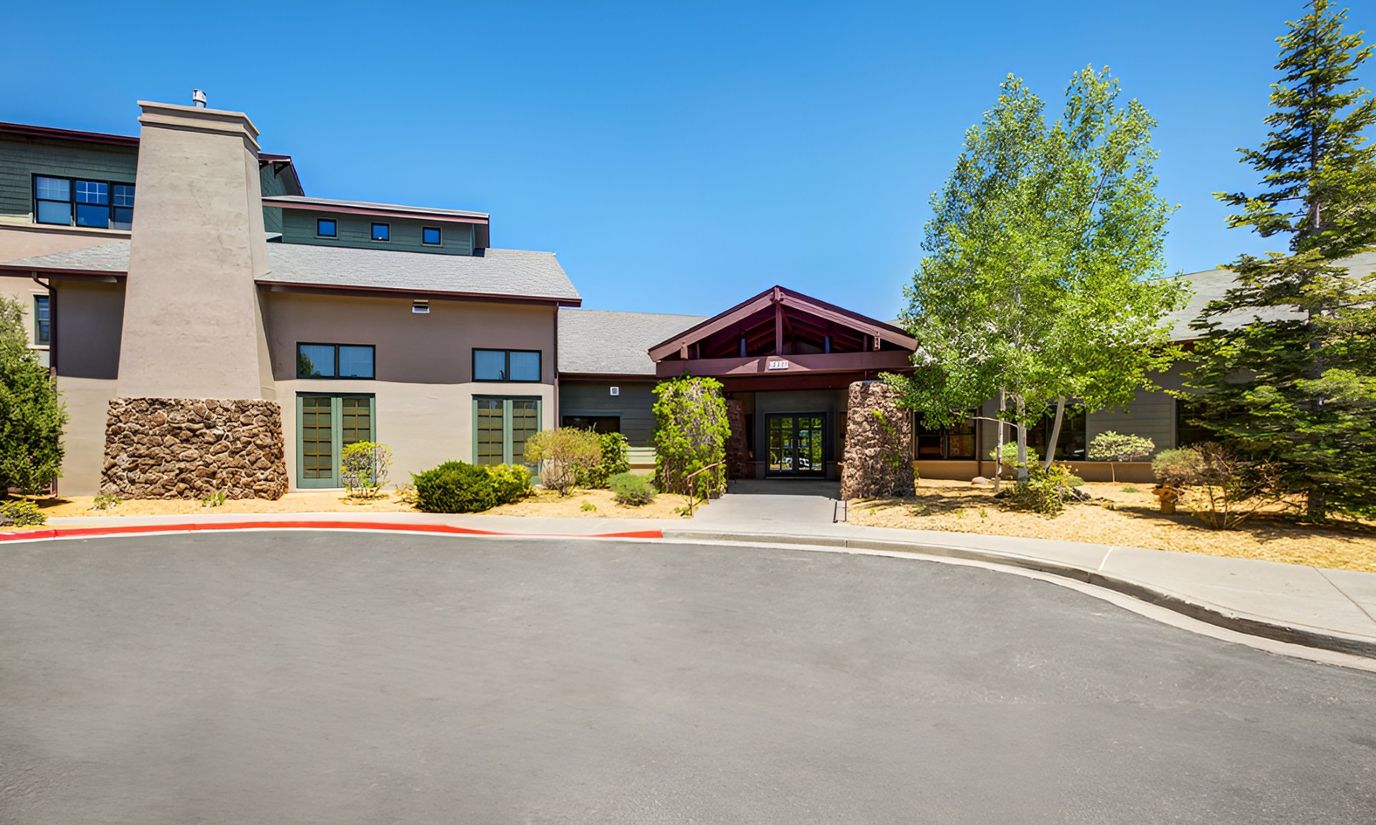
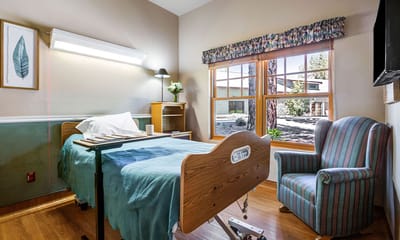

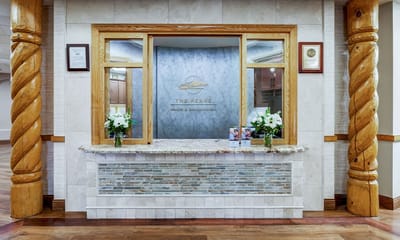
The Peaks Health & Rehabilitation
Nursing Home, Assisted Living, Hospice Care & Respite Care · Flagstaff, AZ
CMS overall rating Info CMS (the Centers for Medicare & Medicaid Services) is the federal agency that rates nursing home quality. Its Overall Rating runs from 1 to 5 stars, combining health inspections, staffing, and quality measures, with inspections weighted most heavily.

The Peaks Health & Rehabilitation

Nursing Home, Assisted Living, Hospice Care & Respite Care · Flagstaff, AZ
CMS overall rating Info CMS (the Centers for Medicare & Medicaid Services) is the federal agency that rates nursing home quality. Its Overall Rating runs from 1 to 5 stars, combining health inspections, staffing, and quality measures, with inspections weighted most heavily.
The Peaks Health & Rehabilitation accepts Medicare, Medicaid, and private pay.

Overview of The Peaks Health & Rehabilitation

The Peaks Health & Rehabilitation offers nursing home, assisted living, hospice care, and respite care in Flagstaff, Arizona. Nursing home care provides ongoing nursing support, while assisted living helps with bathing, dressing, medication, and other daily tasks as residents maintain their own living space. Hospice care centers on comfort and support at the end of life, and respite care offers a short stay when a usual caregiver needs time to travel or recover.

Respite care may suit a family needing temporary support while a primary caregiver is away or recovering. Payment options include Medicare, Medicaid, and private pay. Medicaid may help when savings are not enough for a long stay, while Medicare generally covers short term skilled care after a hospital stay rather than long term residence. Pets are allowed, so a resident may be able to keep a companion animal while living at the community.

Quality ratings

Measured by Centers for Medicare & Medicaid Services (CMS)

Overall rating Info The Overall CMS Rating combines results from health inspections, staffing levels and quality measures. Health inspections carry the most weight. Staffing and quality scores can increase or decrease the final rating based on performance compared to state and national standards.
▼ 39.7% Below AZ avg. ▼ 39.7% Below AZ avg.AZ average: 3.3Click the badge to see the full State ranking.Click here to see the full State ranking.
Health Inspection Info Based on the results of the facility's three most recent standard inspections and any complaint investigations. CMS reviews the number, scope, and severity of deficiencies, with more recent findings weighted more heavily.
▼ 27.8% Below AZ avg. ▼ 27.8% Below AZ avg.AZ average: 2.8Click the badge to see the full State ranking.Click here to see the full State ranking.
Staffing Info Measures average nursing staff hours per resident per day, including Registered Nurses (RNs) and total nursing staff. Ratings are adjusted based on the level of care residents require and are compared to state and national benchmarks.
▲ 31.7% Above AZ avg. ▲ 31.7% Above AZ avg.AZ average: 3.0Click the badge to see the full State ranking.Click here to see the full State ranking.
Quality Measures Info Based on clinical and physical health indicators reported to CMS, such as hospital readmissions, falls, pressure ulcers, and improvements in mobility. These measures reflect how well residents' health needs are being managed.
▼ 11.3% Below AZ avg. ▼ 11.3% Below AZ avg.AZ average: 4.5Click the badge to see the full State ranking.Click here to see the full State ranking.

Staffing hours Info Daily nursing hours per resident by staff type, reported to CMS. Higher is generally better — compare this facility to state and national averages to see where staffing stands.

Hours per resident per day vs Arizona averages

Rank #19 / 59Nurse hours — State benchmarkedThis nursing home is ranked 19th out of 59 nursing homes we track in Arizona for nurse hours. Shows adjusted nurse hours per resident per day benchmarked to the Arizona average, with a ranking across 59 Arizona facilities. More hours mean more direct care. The national average is about 3.5 hrs; below 3.0 is a red flag.Communities with the same value for a metric share the same rank. Rankings compare like with like: every nursing home we track in Arizona that reports data for that category. Nursing homes without available data are excluded, so the pool size varies from metric to metric.Click the rank badge to see the full State ranking.Click here to see the full State ranking.

Total nursing care Info This nursing home is ranked 19th out of 59 nursing homes we track in Arizona for nurse hours. Total adjusted nursing hours per resident per day, combining RN, LPN, and aide time. CMS adjusts this for case-mix so facilities can be fairly compared.

4h 26m

9% above state avg
Staff type
Hours / day / resident
vs state avg
Registered Nurse (RN) Info RNs hold the highest nursing license and can assess residents, interpret test results, and direct care plans. More RN hours per day often signals stronger clinical oversight and faster response to health changes.
1h 2m
+51% State avg: 41m per day · National avg: 42m per day
LPN / LVN Info Licensed Practical Nurses (LPNs) or Licensed Vocational Nurses (LVNs) deliver routine hands-on care — medication administration, wound dressing, and monitoring vital signs. They work under RN supervision and make up a large share of daily bedside care.
35m
−44% State avg: 1h 2m per day · National avg: 52m per day
Nurse Aide Info Certified Nurse Aides (CNAs) provide the most direct day-to-day assistance: bathing, dressing, feeding, and mobility. Nurse aide hours are typically the largest staffing category and directly affect residents' quality of life.
2h 49m
+25% State avg: 2h 15m per day · National avg: 2h 24m per day
Weekend Total Nursing Info Combined nursing hours (RN + LPN + Nurse Aide) per resident per day on weekends. Staffing often drops on weekends — this figure reveals whether the facility maintains adequate coverage outside of weekday hours.
3h 56m
+12% State avg: 3h 30m per day · National avg: 3h 31m per day
Physical Therapist Info Hours per resident per day provided by licensed Physical Therapists (PTs) or PT Assistants. PT services help residents recover mobility after injury or illness and are especially important for post-acute (short-stay) rehabilitation.
8m
+43% State avg: 6m per day · National avg: 4m per day
Weekend RN Info Registered nurse hours specifically on weekends. Facilities sometimes reduce RN presence on Saturdays and Sundays — a low weekend RN figure compared to weekday hours can indicate reduced clinical oversight when most administrative staff are absent.
33m
+14% State avg: 29m per day · National avg: 29m per day

1 of 6 metrics below state avg

By The Numbers

Community insights.

Bed count Info A smaller, more intimate setting that may offer a quieter environment and closer staff-resident interactions. 58

Smaller home · May offer a more intimate, personalized care environment.

Years of operating Info A longer operating history, which may indicate experience navigating regulations and delivering ongoing care. This is the number of years in operation under current management.
26 years
Walk Score Info Car-dependent. Most errands require a car, with limited nearby walkable options. Rank #82 / 84Walk Score — State benchmarkedThis nursing home is ranked 82nd out of 84 nursing homes we track in Arizona for walk score. Shows how walkable this facility's neighborhood is compared to the average walk score across Arizona facilities. Higher scores benefit residents, families, and staff.Communities with the same value for a metric share the same rank. Rankings compare like with like: every nursing home we track in Arizona that reports data for that category. Nursing homes without available data are excluded, so the pool size varies from metric to metric.Click the rank badge to see the full State ranking.Click here to see the full State ranking.
5 / 100
Residents per day (avg) Info The average number of residents living at this facility on a given day. CMS calculates this figure from the facility's Minimum Data Set (MDS) assessments and uses this value for other measures like Hours Per Resident Per Day (HPRD) and 5-Star Staffing rating.
42
Avg. Length of Stay Info Average number of days residents stay at this facility, based on CMS cost report data. Shorter stays often reflect post-acute or rehab care; longer stays reflect long-term care.
36 days

About this community

License Details

Facility TypeNursing Care Institution
StatusActive
IssuanceApril 7, 2000
ExpirationMarch 31, 2027
License NumberNCI-2515

Ownership & Operating Entity

The Peaks Health & Rehabilitation is administered by Gary Olson.

OwnerNorthern Arizona Senior Living Community, L.l.c.

Contact The Peaks Health & Rehabilitation

Inspection History

In Arizona, the Department of Health Services, Bureau of Long Term Care Licensing performs regular onsite inspections and investigates complaints for all licensed residential and nursing facilities.

The figures below cover inspections recorded through March 11, 2026.

ALM Inspection Grade

81 / 100 Based on state-published inspection data
How it compares

2 points below the Arizona average for state-licensed facilities (83/100)

Category breakdown

Deficiencies Typical

2.9 deficiencies per inspection (32 in 11 inspections) · 66% more than the typical state-licensed AZ facility (median: 1.8)

Enforcement Strong

0 enforcement actions · better than the typical state-licensed AZ facility (median: 1)

Inspection grade: 81 out of 100, letter grade B-.

Inspection Scorecard Info This scorecard compares key inspection, deficiency, and complaint metrics at this facility against the Arizona state average. Metrics rated ≥15% worse than average are highlighted in red; those ≥15% better are highlighted in green.

Overall vs. AZ average 2 Worse Metrics worse than Arizona average:
• Total deficiencies (220% above)
• Deficiencies per inspection (26% above)
1 Better Metrics better than Arizona average:
• Enforcement actions (100% below)

Deficiencies Info Deficiencies are formal regulatory issues recorded during state inspections.

This FacilityAZ Averagevs. AZ Avg
Total deficiencies Info Formal regulatory issues recorded by inspectors across all inspection types. 3210.0 This facility has 220% more total deficiencies than a typical Arizona nursing home (32 vs. AZ avg 10).↑ 220% worse
Deficiencies per inspection Info Average deficiencies per inspection. 2.92.3 This facility has 26% more deficiencies per inspection than a typical Arizona nursing home (2.9 vs. AZ avg 2.3).↑ 26% worse
Enforcement actions Info Formal penalties or interventions imposed by Arizona regulators — directed plans of correction, civil monetary penalties, denial of payment, or appointment of temporary management. 00.9 This facility has 100% fewer enforcement actions than a typical Arizona nursing home (0 vs. AZ avg 0.9).↓ 100% better

Inspections Info State inspections evaluate whether the facility meets health and safety standards.

This FacilityAZ Averagevs. AZ Avg
Total inspections Info Combined count of all inspections conducted at this facility. 115.0 This facility has had 120% more total inspections than the Arizona average (11 vs. AZ avg 5). More inspections can mean more regulatory scrutiny rather than worse care.↑ 120% more

Penalties and fines

Federal penalties imposed by CMS for regulatory violations, including civil money penalties (fines) and denials of payment for new Medicare/Medicaid admissions.

Source: CMS Penalties Database

No penalties in the past 3 years

No civil money penalties or payment denials were reported in the last 3 years.

Breakdown by payment type

Medicare

40% of new residents, usually for short-term rehab.

Typical stay 21 days

Private pay

39% of new residents, often for short stays.

Typical stay 24 days

Medicaid

21% of new residents, often for long-term daily care.

Typical stay 2 - 3 months

Finances and operations

Based on CMS SNF Cost Report for fiscal year ending in 12/2023.

Nonprofit
Net patient revenue Info Net patient revenue — what the home actually collects for resident care, after contractual allowances, bad debt and discounts are subtracted from its gross charges (CMS cost report, Worksheet G-3). It covers resident care only; money the home earns from other sources is shown separately as "Other income."
$12.2M
Net patient income Info Net patient income: net patient revenue minus the home's total operating expenses. A positive figure means it earns more from resident care than it spends to deliver it; a negative figure means the opposite. It excludes non-operating "other income."
-$2.2M
Nonprofit
Net patient revenue Info Net patient revenue — what the home actually collects for resident care, after contractual allowances, bad debt and discounts are subtracted from its gross charges (CMS cost report, Worksheet G-3). It covers resident care only; money the home earns from other sources is shown separately as "Other income."
$12.2M Rank #32 / 58Net patient revenue — State benchmarkedThis nursing home is ranked 32nd out of 58 nursing homes we track in Arizona. Shows this facility's net patient revenue compared to the Arizona average, among facilities reporting a recent fiscal year. Higher revenue generally means more resources for staffing and capital — read alongside Payroll %.Communities with the same value for a metric share the same rank. Rankings compare like with like: every nursing home we track in Arizona that reports data for that category. Nursing homes without available data are excluded, so the pool size varies from metric to metric.
Net patient income Info Net patient income: net patient revenue minus the home's total operating expenses. A positive figure means it earns more from resident care than it spends to deliver it; a negative figure means the opposite. It excludes non-operating "other income."
-$2.2M
Other income Info Money the home earns outside of resident care — such as investments, grants, rentals and other non-operating sources (CMS cost report, Worksheet G-3). It is tracked separately from net patient revenue: it is not part of that figure, and it is not included in net patient income.
$430.3K
Payroll costs Info Staff salaries plus wage-related costs — benefits such as payroll taxes, health insurance and retirement — from the home's own accounting records (CMS cost report, Worksheet A). Contract or agency labor is counted separately, under other operating costs. Rank #35 / 58Payroll costs — State benchmarkedThis nursing home is ranked 35th out of 58 nursing homes we track in Arizona. Shows total staff payroll — salaries plus wage-related benefits — benchmarked to the Arizona average, among facilities reporting a recent fiscal year. Higher payroll relative to peers often signals better staffing and less reliance on contract labor.Communities with the same value for a metric share the same rank. Rankings compare like with like: every nursing home we track in Arizona that reports data for that category. Nursing homes without available data are excluded, so the pool size varies from metric to metric.
$6.6M 54.3% of net patient revenue Info Payroll as a share of revenue: staff salaries and wage-related benefits divided by net patient revenue. A higher figure means more of each revenue dollar goes to staff pay. Rank #31 / 58Payroll % of net patient revenue — State benchmarkedThis nursing home is ranked 31st out of 58 nursing homes we track in Arizona. Shows payroll as a percentage of net patient revenue versus the Arizona average, among facilities reporting a recent fiscal year. Below 25% may signal understaffing or heavy agency use — read with Staffing ratings.Communities with the same value for a metric share the same rank. Rankings compare like with like: every nursing home we track in Arizona that reports data for that category. Nursing homes without available data are excluded, so the pool size varies from metric to metric.
Other operating costs Info Everything it costs to run the home apart from payroll — food, utilities, supplies, maintenance, contract labor and administration. Calculated as total operating expense minus payroll (staff salaries and wage-related benefits).
$7.8M
Total costs Info The home's total operating expense for the year — all the costs of running it, salaries included (CMS cost report, Worksheet G-3).
$14.4M

What does this home offer?

Pets allowed icon
Pets allowed icon

Pets Allowed

Building type icon
Building type icon

Building Type: 3-story

Beauty services icon

Beauty Services

Transportation services icon

Transportation Services

Housekeeping icon
Housekeeping icon

Housekeeping Services

Social and recreational activities icon

Social and Recreational Activities

Exercise program icon

Exercise Programs

Who this home usually serves

TYPE OF STAY

Mostly short-term rehab stays

Most residents typically stay for a few weeks or months before returning home or moving on.

New residents most often arrive under Medicare (40% of admissions), and a typical Medicare stay runs around 21 days.

Admissions
336 total

Coverage residents most often arrive under.

Medicare 40%
Private pay 39%
Medicaid 21%
Discharges
330 total

Coverage residents most often leave under.

Medicare 37%
Private pay 39%
Medicaid 24%

Places of interest near The Peaks Health & Rehabilitation

Address 3.2 miles from city center Info Estimated distance in miles from Flagstaff's city center to The Peaks Health & Rehabilitation's address, calculated via Google Maps.

Calculate Travel Distance to The Peaks Health & Rehabilitation

Add your location

Address

Financial Assistance for
Nursing Home in Arizona

The Peaks Health & Rehabilitation is located in Flagstaff, Arizona.
Here are the financial assistance programs available to residents in Arizona.

Get Financial aid guidance

Arizona Long Term Care System

ALTCS

Age 65+ or disabled
General Arizona resident, Medicaid-eligible, nursing home-level care need.
Income Limits (2025) ~$2,829/month 300% FBR, individual
Asset Limits $2,000 (individual), $3,000 (couple).
AZ

Covers tribal members; rural outreach.

Benefits
In-home care (6-8 hours/day) Assisted living Nursing home care Medical services Transportation (10 trips/month)

Non-Medical Home and Community Based Services

AZ DES Non-Medical HCBS

Age 60+
General Arizona resident, at risk of institutionalization.
Income Limits ~$2,000/month individual, varies
Asset Limits $10,000 individual
AZ

Limited funding; waitlists common.

Benefits
Homemaker services (3-5 hours/week) Respite care (up to 10 days/year) Adult day care (~$60/day)

Weatherization Assistance Program (WAP)

AZ WAP

Age 60+ priority
General Arizona resident, own/rent home, low-income.
Income Limits (2025) ~$2,510/month 200% of poverty level, individual
Asset Limits Not applicable; income-focused.
AZ

High demand in rural desert areas; limited annual funds.

Benefits
Insulation Weather stripping HVAC repairs (avg. $500-$1,000/year savings)

Section 202 Supportive Housing for the Elderly

AZ Section 202

Age 62+
General Arizona resident, very low income, able to live independently with support.
Income Limits (2025) ~$1,645/month 50% of area median income, individual, varies by county
Asset Limits $10,000 individual, excludes home if owned
AZ

Limited units; high demand in metro areas like Phoenix.

Benefits
Subsidized rent (30% of income, e.g., $300-$500/month) On-site services (housekeeping, transportation, ~$200/month value)

Arizona CARES Program

AZ CARES

Age
General Caregivers of Arizona residents 60+ needing help with 3+ daily activities; no caregiver age limit.
Income Limits No strict limit; cost-sharing above ~$2,500/month threshold.
Asset Limits Not applicable; need-based.
AZ

Focus on rural access; complements ALTCS respite.

Benefits
Respite care (up to 10 days/year) Counseling (4-6 sessions/year) Training (2-3 workshops/year) Supplies (~$200/year)

AZ DES Non-Medical Home and Community Based Services (HCBS)

AZ DES Non-Medical HCBS

Age 60+ or disabled
General Arizona resident, need assistance with daily activities, not eligible for Medicaid/ALTCS.
Income Limits Above Medicaid threshold but low-income ~$1,500-$2,500/month, varies by region
Asset Limits Not specified; income-driven eligibility.
AZ

Targets those ineligible for ALTCS; prioritizes rural and tribal areas.

Benefits
Homemaker services (3-5 hours/week) Personal care (limited hours) Respite care (up to 10 days/year) Transportation (~5 trips/month)

Frequently Asked Questions about The Peaks Health & Rehabilitation

What neighborhood is The Peaks Health & Rehabilitation in?

The Peaks Health & Rehabilitation is in the Coyote Springs neighborhood of Flagstaff.

Who is the owner of The Peaks Health & Rehabilitation?

The Peaks Health & Rehabilitation is legally operated by Northern Arizona Senior Living Community, L.l.c., and administered by Gary Olson.

Is The Peaks Health & Rehabilitation in a walkable area?

The Peaks Health & Rehabilitation has a walk score of 5. Car-dependent. Most errands require a car, with limited nearby walkable options.

What is the license number of The Peaks Health & Rehabilitation?

According to AZ state health department records, The Peaks Health & Rehabilitation's license number is NCI-2515.

When does The Peaks Health & Rehabilitation's license expire?

According to AZ state health department records, The Peaks Health & Rehabilitation's license expires on March 31, 2027.

What is the occupancy rate at The Peaks Health & Rehabilitation?

The Peaks Health & Rehabilitation's occupancy is 55.4%.

How long has The Peaks Health & Rehabilitation been in business?

The Peaks Health & Rehabilitation has been operating for approximately 26 years, based on available licensing and registration records.

Guides for Better Senior Living

Care Cost Calculator: See Prices in Your Area

Nursing Home Data Explorer

Don’t Wait Too Long: 7 Red Flag Signs Your Parent Needs Assisted Living Now

The True Cost of Assisted Living in 2025 – And How Families Are Paying For It

Understanding Senior Living Costs: Pricing Models, Discounts & Financial Assistance


