


Total staff
118
Employees
95
Contractors
23


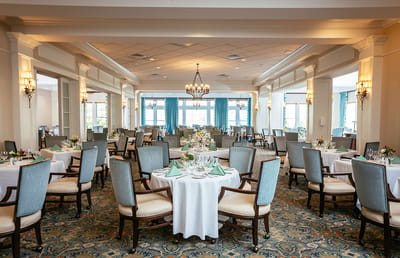

The Rosewood Health Center – The Cypress of Raleigh sits on Cypress Lakes Drive in North Raleigh, about 10 miles from the city center. The facility is a 57-bed nursing home and memory care community, opened in 2008 and operated by The Cypress of Raleigh LLC. The Walk Score is 71, so most nearby errands are doable on foot, and WakeMed is about 3.4 miles away.
Eighty percent of the 57 beds are occupied, and the average stay runs 249 days. That length of stay is closer to eight months than a typical short rehab course, which says something real about who the facility is built for. A private wing handles memory care for residents who need it.
The staffing picture is detailed; total nursing care comes to 7 hours and 3 minutes per resident per day. Registered nurses provide 52 minutes of that directly; nurse aides account for 3 hours and 26 minutes. Beyond nursing, on-site staff and contractors include respiratory therapy technicians, physical therapy assistants, occupational therapy aides, speech-language pathologists, dental services staff, and a social worker. That range of disciplines on-site means fewer outside referrals for routine clinical needs.
A community life services coordinator runs the activity program, which includes aqua aerobics, book clubs, and bridge and card groups. Medicare and private pay are accepted.
For residents who need sustained skilled nursing care or memory care with broad on-site clinical coverage, The Rosewood Health Center offers a well-staffed, moderately sized environment in a walkable North Raleigh setting.
Staffing hours
![]() Daily nursing hours per resident by staff type, reported to CMS. Higher is generally better — compare this facility to state and national averages to see where staffing stands.
Daily nursing hours per resident by staff type, reported to CMS. Higher is generally better — compare this facility to state and national averages to see where staffing stands.
Hours per resident per day vs North Carolina averages
Total nursing care
![]() This home is ranked 6th out of 81 homes in North Carolina for nurse hours. Total adjusted nursing hours per resident per day, combining RN, LPN, and aide time. CMS adjusts this for case-mix so facilities can be fairly compared.
This home is ranked 6th out of 81 homes in North Carolina for nurse hours. Total adjusted nursing hours per resident per day, combining RN, LPN, and aide time. CMS adjusts this for case-mix so facilities can be fairly compared.
7h 3m
78% above state avg0 of 6 metrics below state avg
Reporting period: October 1 – December 31, 2025 (Q4 2025). Source: CMS Payroll-Based Journal report.
Manages medical care and health needs.
Assists with medical care and medications.
Helps with daily care and mobility.
Total hours from contractors
1,601 contractor hours this quarter
| Certified Nursing Assistant | 48 | 12 | 60 | 14,446 | 92 | 100% | 7.7 |
| Licensed Practical Nurse | 29 | 0 | 29 | 7,671 | 92 | 100% | 8.8 |
| Registered Nurse | 11 | 0 | 11 | 2,754 | 92 | 100% | 8 |
| Clinical Nurse Specialist | 1 | 0 | 1 | 469 | 61 | 66% | 7.7 |
| Nurse Practitioner | 1 | 0 | 1 | 461 | 60 | 65% | 7.7 |
| Administrator | 1 | 0 | 1 | 453 | 59 | 64% | 7.7 |
| Other Dietary Services Staff | 1 | 0 | 1 | 439 | 61 | 66% | 7.2 |
| Occupational Therapy Aide | 1 | 0 | 1 | 430 | 56 | 61% | 7.7 |
| Qualified Social Worker | 0 | 1 | 1 | 380 | 58 | 63% | 6.6 |
| Respiratory Therapy Technician | 0 | 4 | 4 | 369 | 66 | 72% | 3.2 |
| Speech Language Pathologist | 0 | 2 | 2 | 341 | 65 | 71% | 4 |
| Physical Therapy Assistant | 0 | 2 | 2 | 296 | 56 | 61% | 5.2 |
| Dental Services Staff | 2 | 0 | 2 | 236 | 32 | 35% | 7.4 |
| Physical Therapy Aide | 0 | 1 | 1 | 35 | 12 | 13% | 2.9 |
| Medical Director | 0 | 1 | 1 | 30 | 16 | 17% | 1.9 |
Federal penalties imposed by CMS for regulatory violations, including civil money penalties (fines) and denials of payment for new Medicare/Medicaid admissions.
Source: CMS Penalties Database
No penalties in the past 3 years
No civil money penalties or payment denials were reported in the last 3 years.
These measures show how residents usually do over time at this home, based on health outcomes and preventive care.
North Carolina average: 11.5
North Carolina average: 20.6
North Carolina average: 17.5%
North Carolina average: 23.3%
North Carolina average: 21.4%
North Carolina average: 3.6%
North Carolina average: 6.3%
North Carolina average: 2.6%
North Carolina average: 7.4%
North Carolina average: 4.4%
North Carolina average: 13.4%
North Carolina average: 91.6%
North Carolina average: 94.1%
North Carolina average: 79.9%
North Carolina average: 1.5%
North Carolina average: 78.1%
Quality measures are calculated from Minimum Data Set (MDS) assessments. For most measures, lower percentages indicate better care quality.
29% of new residents, usually for short-term rehab.
71% of new residents, often for short stays.
Historical financial and operational data for The Rosewood Health Center – The Cypress of Raleigh from 2011–2023, based on CMS SNF Cost Reports.
Key figures below are for fiscal year ending in 12/2023.
Based on CMS SNF Cost Report for fiscal year ending in 12/2023.
Residents typically stay for brief periods, with frequent admissions and discharges throughout the year.
Most new residents arrive under private pay (71% of admissions), and a typical private pay stay runs around 10 - 11 months.
Coverage residents most often arrive under.
Coverage residents most often leave under.
![]() 8.5 miles from city center
8.5 miles from city center
![]() Estimated distance in miles from Raleigh's city center to The Rosewood Health Center – The Cypress of Raleigh's address, calculated via Google Maps.
— 3.36 miles to nearest hospital (Center Wake Med Health Care)
Estimated distance in miles from Raleigh's city center to The Rosewood Health Center – The Cypress of Raleigh's address, calculated via Google Maps.
— 3.36 miles to nearest hospital (Center Wake Med Health Care)
Add your location
Info below is compiled from CMS reports & the NC Dept. of Health & Human Services (NCDHHS), senior community websites & trusted data sources such as Walk Score & BBB.
Communities are listed from highest to lowest based on our ranking methodology.
| The Rosewood Health Center – The Cypress of Raleigh | NH MC SNF | Raleigh (North Raleigh) | 57
Facility
57
NC AVG
72
Rank
#277 / 387 |
80.4%
Facility
80.4%
NC AVG
68
Rank
#98 / 240 | +18% | 7.06
Facility
7.06
NC AVG
3.98
Rank
#6 / 81 | +2% | +78% | $0
Facility
$0
NC AVG
$74.6k
Rank
#1 / 89 | 4
Facility
4
NC AVG
20.9
Rank
#12 / 85 | 2.0
Facility
2.0
NC AVG
5.0
Rank
#14 / 85 | - | 46 | - |
71
Facility
71
NC AVG
36
Rank
#28 / 536 | The Cypress Of Raleigh LLC | $28.0MFiscal year ending 12/2023
Facility
$28.0MFiscal year ending 12/2023
NC AVG
$15.7M
Rank
#9 / 84 | $15.8MFiscal year ending 12/2023
Facility
$15.8MFiscal year ending 12/2023
NC AVG
$8.2M
Rank
#10 / 84 | 56.4%Fiscal year ending 12/2023
Facility
56.4%Fiscal year ending 12/2023
NC AVG
58.6%
Rank
#23 / 84 | 345546 | ||||
| Perry Creek Health & Rehabilitation Center | NH SNF | Raleigh (Northeast Raleigh) | 90
Facility
90
NC AVG
72
Rank
#116 / 387 |
84.0%
Facility
84.0%
NC AVG
68
Rank
#81 / 240 | +24% | 3.81
Facility
3.81
NC AVG
3.98
Rank
#52 / 81 | +33% | -4% | $0
Facility
$0
NC AVG
$74.6k
Rank
#1 / 89 | 2
Facility
2
NC AVG
20.9
Rank
#8 / 85 | 2.0
Facility
2.0
NC AVG
5.0
Rank
#14 / 85 | - | 76 | - |
24
Facility
24
NC AVG
36
Rank
#349 / 536 | - | $10.3MFiscal year ending 12/2023
Facility
$10.3MFiscal year ending 12/2023
NC AVG
$15.7M
Rank
#68 / 84 | $5.5MFiscal year ending 12/2023
Facility
$5.5MFiscal year ending 12/2023
NC AVG
$8.2M
Rank
#53 / 84 | 53.1%Fiscal year ending 12/2023
Facility
53.1%Fiscal year ending 12/2023
NC AVG
58.6%
Rank
#29 / 84 | 345003 | ||||
| College Pines Health and Rehabilitation Center | NH SNF | Connelly Springs (Locust Street) | 100
Facility
100
NC AVG
72
Rank
#77 / 387 |
93.7%
Facility
93.7%
NC AVG
68
Rank
#44 / 240 | +38% | 3.98
Facility
3.98
NC AVG
3.98
Rank
#39 / 81 | -11% | 0% | $16.8k
Facility
$16.8k
NC AVG
$74.6k
Rank
#58 / 89 | 4
Facility
4
NC AVG
20.9
Rank
#12 / 85 | 2.0
Facility
2.0
NC AVG
5.0
Rank
#14 / 85 | 2 | 94 | - |
6
Facility
6
NC AVG
36
Rank
#484 / 536 | - | $14.2MFiscal year ending 12/2023
Facility
$14.2MFiscal year ending 12/2023
NC AVG
$15.7M
Rank
#31 / 84 | $6.4MFiscal year ending 12/2023
Facility
$6.4MFiscal year ending 12/2023
NC AVG
$8.2M
Rank
#37 / 84 | 45.2%Fiscal year ending 12/2023
Facility
45.2%Fiscal year ending 12/2023
NC AVG
58.6%
Rank
#45 / 84 | 345446 | ||||
| Capital Nursing And Rehabilitation Center | NH AL HOS PC RC SNF | Raleigh (East Raleigh) | 125
Facility
125
NC AVG
72
Rank
#28 / 387 |
79.9%
Facility
79.9%
NC AVG
68
Rank
#103 / 240 | +18% | 3.43
Facility
3.43
NC AVG
3.98
Rank
#67 / 81 | +1% | -14% | $0
Facility
$0
NC AVG
$74.6k
Rank
#1 / 89 | 14
Facility
14
NC AVG
20.9
Rank
#47 / 85 | 2.8
Facility
2.8
NC AVG
5.0
Rank
#30 / 85 | - | 100 | - |
43
Facility
43
NC AVG
36
Rank
#207 / 536 | Liberty Commons Nursing And Rehabilitation Center Of Wake County, LLC | $12.0MFiscal year ending 09/2023
Facility
$12.0MFiscal year ending 09/2023
NC AVG
$15.7M
Rank
#45 / 84 | $6.2MFiscal year ending 09/2023
Facility
$6.2MFiscal year ending 09/2023
NC AVG
$8.2M
Rank
#40 / 84 | 51.3%Fiscal year ending 09/2023
Facility
51.3%Fiscal year ending 09/2023
NC AVG
58.6%
Rank
#33 / 84 | 345202 | ||||
| Zebulon Rehabilitation Center | NH RC SNF | Zebulon (West Gannon Avenue) | 60
Facility
60
NC AVG
72
Rank
#230 / 387 |
94.3%
Facility
94.3%
NC AVG
68
Rank
#39 / 240 | +39% | 3.24
Facility
3.24
NC AVG
3.98
Rank
#75 / 81 | -29% | -19% | $0
Facility
$0
NC AVG
$74.6k
Rank
#1 / 89 | 11
Facility
11
NC AVG
20.9
Rank
#36 / 85 | 3.7
Facility
3.7
NC AVG
5.0
Rank
#41 / 85 | - | 57 | - |
50
Facility
50
NC AVG
36
Rank
#150 / 536 | Gabriella Skillen | $8.1MFiscal year ending 12/2023
Facility
$8.1MFiscal year ending 12/2023
NC AVG
$15.7M
Rank
#75 / 84 | $3.8MFiscal year ending 12/2023
Facility
$3.8MFiscal year ending 12/2023
NC AVG
$8.2M
Rank
#75 / 84 | 46.4%Fiscal year ending 12/2023
Facility
46.4%Fiscal year ending 12/2023
NC AVG
58.6%
Rank
#43 / 84 | 345104 |
The Rosewood Health Center – The Cypress of Raleigh is located in Raleigh, North Carolina.
Here are the financial assistance programs available to residents in North Carolina.
The Rosewood Health Center – The Cypress of Raleigh is in the North Raleigh neighborhood.
The Rosewood Health Center – The Cypress of Raleigh has a walk score of 71. Very walkable. Most errands can be accomplished on foot, and many essentials are within a short walk.
The Rosewood Health Center – The Cypress of Raleigh's occupancy is 80.2%.
No, The Rosewood Health Center – The Cypress of Raleigh has a no-pet policy.
The Rosewood Health Center – The Cypress of Raleigh is a government-operated nursing facility.
Yes — there are 4 photos of The Rosewood Health Center – The Cypress of Raleigh in the photo gallery on this page.
The Rosewood Health Center – The Cypress of Raleigh is located at 8801 Cypress Lakes Dr, Raleigh, NC 27615.
Care Cost Calculator: See Prices in Your Area
Nursing Home Data Explorer
Don’t Wait Too Long: 7 Red Flag Signs Your Parent Needs Assisted Living Now
The True Cost of Assisted Living in 2025 – And How Families Are Paying For It
Understanding Senior Living Costs: Pricing Models, Discounts & Financial Assistance


