The Village at Summerville
Nursing Home, Assisted Living, Independent Living, Memory Care & Respite Care · South Carolina, SC
CMS overall rating Info CMS (the Centers for Medicare & Medicaid Services) is the federal agency that rates nursing home quality. Its Overall Rating runs from 1 to 5 stars, combining health inspections, staffing, and quality measures, with inspections weighted most heavily.

The Village at Summerville

Nursing Home, Assisted Living, Independent Living, Memory Care & Respite Care · South Carolina, SC
CMS overall rating Info CMS (the Centers for Medicare & Medicaid Services) is the federal agency that rates nursing home quality. Its Overall Rating runs from 1 to 5 stars, combining health inspections, staffing, and quality measures, with inspections weighted most heavily.
Calculator: See prices in your area
The Village at Summerville accepts Medicare and private pay.

Overview of The Village at Summerville

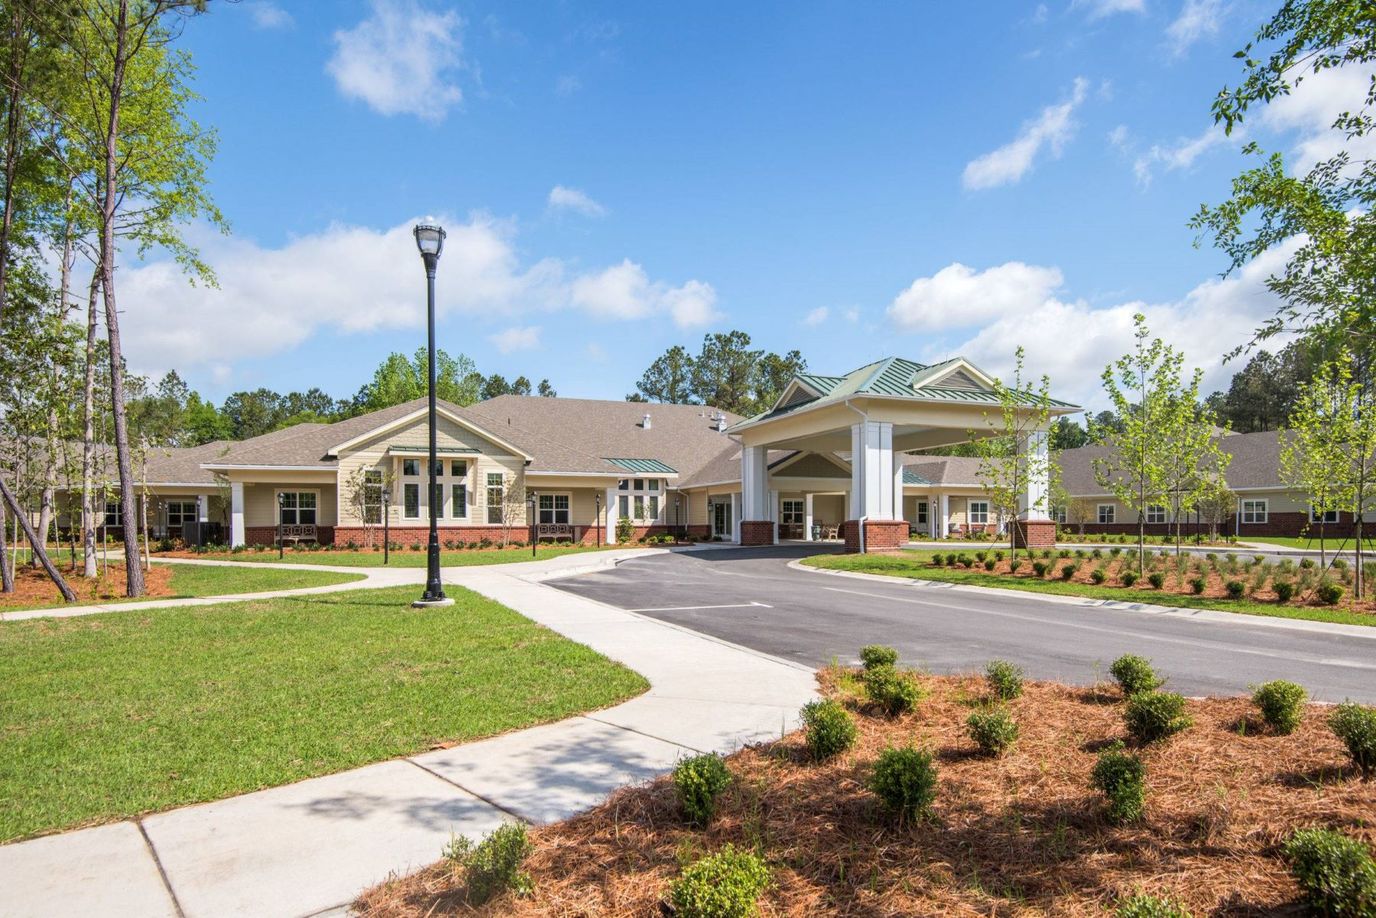
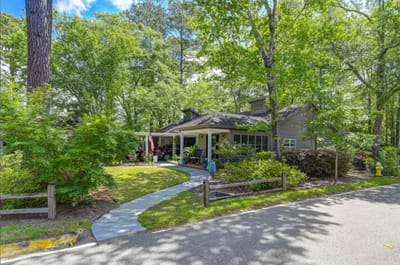
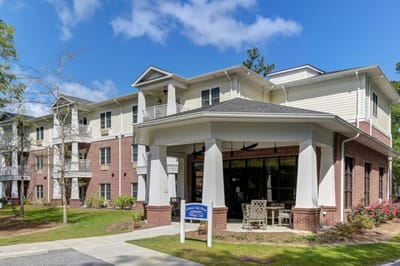
Nestled in 84 acres of pristine land in South Carolina, The Village at Summerville has been a non-profit organization since 1958, ensuring that the focus remains on providing quality care and services to the residents. The community offers various living options, including independent living, assisted living, memory support, skilled nursing, restorative care, short-term rehab, and outpatient rehab. 
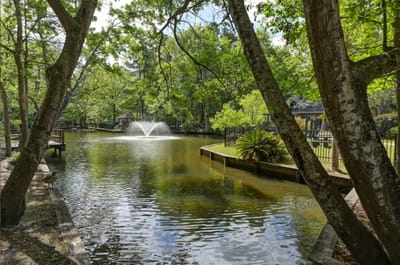
The home boasts breathtaking scenery, from serene small ponds to majestic trees and walking trails. It offers a convenient location close to Interstate 26 and just a stone’s throw away from downtown Charleston, making it a perfect blend of nature and urban convenience.

The living spaces at The Village at Summerville are not only stylish but also spacious and airy, providing residents with a comfortable and welcoming environment. Whether it’s a stroll around the campus or participating in various activities and events, residents can create meaningful connections and lead fulfilling lives in this lovely community.

(843) 873-3560

Quality ratings

Measured by Centers for Medicare & Medicaid Services (CMS)

Overall rating Info The Overall CMS Rating combines results from health inspections, staffing levels and quality measures. Health inspections carry the most weight. Staffing and quality scores can increase or decrease the final rating based on performance compared to state and national standards.
▲ 75.8% Above SC avg. ▲ 75.8% Above SC avg.SC average: 2.8Click the badge to see the full State ranking.Click here to see the full State ranking.
Health Inspection Info Based on the results of the facility's three most recent standard inspections and any complaint investigations. CMS reviews the number, scope, and severity of deficiencies, with more recent findings weighted more heavily.
▲ 45.9% Above SC avg. ▲ 45.9% Above SC avg.SC average: 2.7Click the badge to see the full State ranking.Click here to see the full State ranking.
Staffing Info Measures average nursing staff hours per resident per day, including Registered Nurses (RNs) and total nursing staff. Ratings are adjusted based on the level of care residents require and are compared to state and national benchmarks.
▲ 38.3% Above SC avg. ▲ 38.3% Above SC avg.SC average: 2.9Click the badge to see the full State ranking.Click here to see the full State ranking.
Quality Measures Info Based on clinical and physical health indicators reported to CMS, such as hospital readmissions, falls, pressure ulcers, and improvements in mobility. These measures reflect how well residents' health needs are being managed.
▲ 48.7% Above SC avg. ▲ 48.7% Above SC avg.SC average: 3.4Click the badge to see the full State ranking.Click here to see the full State ranking.

Staffing hours breakdown

Info Daily nursing hours per resident by staff type, reported to CMS. Higher is generally better — compare this facility to state and national averages to see where staffing stands.

Hours per resident per day — compared to South Carolina state averages

Total nursing care / resident Info This home is ranked 42nd out of 121 homes in South Carolina for nurse hours. Total adjusted nursing hours per resident per day, combining RN, LPN, and aide time. CMS adjusts this for case-mix so facilities can be fairly compared.
4h 9m per day
Rank #42 / 121Nurse hours — State benchmarkedThis home is ranked 42nd out of 121 homes in South Carolina. Shows adjusted nurse hours per resident per day benchmarked to the South Carolina average, with a ranking across 121 South Carolina facilities. More hours mean more direct care. The national average is about 3.5 hrs; below 3.0 is a red flag.Rankings are based only on facilities in South Carolina that report data for that category. Facilities without available data are excluded from the ranking.Click the rank badge to see the full State ranking.Click here to see the full State ranking.
This facility South Carolina avg (4h 0m per day)
vs South Carolina avg
+4%

0 of 6 metrics below state avg

Standout metric Physical Therapist is +278% above state avg
Staff typeHours / Day / Residentvs state avg
Registered Nurse (RN) Info RNs hold the highest nursing license and can assess residents, interpret test results, and direct care plans. More RN hours per day often signals stronger clinical oversight and faster response to health changes. 1h 5m per day ▲ 73% State avg: 38m per day · National avg: 41m per day
LPN / LVN Info Licensed Practical Nurses (LPNs) or Licensed Vocational Nurses (LVNs) deliver routine hands-on care — medication administration, wound dressing, and monitoring vital signs. They work under RN supervision and make up a large share of daily bedside care. 1h 53m per day ▲ 87% State avg: 1h 0m per day · National avg: 52m per day
Nurse Aide Info Certified Nurse Aides (CNAs) provide the most direct day-to-day assistance: bathing, dressing, feeding, and mobility. Nurse aide hours are typically the largest staffing category and directly affect residents' quality of life. 2h 37m per day ▲ 17% State avg: 2h 13m per day · National avg: 2h 20m per day
Weekend Total Nursing Info Combined nursing hours (RN + LPN + Nurse Aide) per resident per day on weekends. Staffing often drops on weekends — this figure reveals whether the facility maintains adequate coverage outside of weekday hours. 4h 28m per day ▲ 33% State avg: 3h 22m per day · National avg: 3h 27m per day
Physical Therapist Info Hours per resident per day provided by licensed Physical Therapists (PTs) or PT Assistants. PT services help residents recover mobility after injury or illness and are especially important for post-acute (short-stay) rehabilitation. 19m per day ▲ 278% State avg: 5m per day · National avg: 4m per day
Weekend RN Info Registered nurse hours specifically on weekends. Facilities sometimes reduce RN presence on Saturdays and Sundays — a low weekend RN figure compared to weekday hours can indicate reduced clinical oversight when most administrative staff are absent. 52m per day ▲ 105% State avg: 25m per day · National avg: 29m per day

Capacity and availability

This home usually has limited availability

Higher occupancy than the South Carolina average: 82.1%
Occupancy rate
86.5% Rank #54 / 131Occupancy rate — State benchmarkedThis home is ranked 54th out of 131 homes in South Carolina. Shows this facility's occupancy rate versus the South Carolina average, with its Statewide rank out of 131. Higher occupancy signals strong local demand and financial stability.Rankings are based only on facilities in South Carolina that report data for that category. Facilities without available data are excluded from the ranking.Click the rank badge to see the full State ranking.Click here to see the full State ranking.
Avg. Length of Stay
62 days
Bed community size
48-bed community Rank #267 / 309Bed count — State benchmarkedThis home is ranked 267th out of 309 homes in South Carolina. Shows this facility's certified or reported bed count compared to other South Carolina facilities. Larger communities may offer more amenities, programs, and on-site services for residents and families.Rankings are based only on facilities in South Carolina that report data for that category. Facilities without available data are excluded from the ranking.Click the rank badge to see the full State ranking.Click here to see the full State ranking.
A moderately sized community that may balance personal attention with shared amenities and social activities.
Walk Score
Walk Score: 45 / 100 Rank #60 / 232Walk Score — State benchmarkedThis home is ranked 60th out of 232 homes in South Carolina. Shows how walkable this facility's neighborhood is compared to the average Walk Score across South Carolina facilities. Higher scores benefit residents, families, and staff.Rankings are based only on facilities in South Carolina that report data for that category. Facilities without available data are excluded from the ranking.Click the rank badge to see the full State ranking.Click here to see the full State ranking.
Somewhat walkable. A few nearby services may be reachable on foot, but most trips require transportation.

Contact The Village at Summerville

Staffing Data

Reporting period: October 1 – December 31, 2025 (Q4 2025). Source: CMS Payroll-Based Journal report.

Total staff 135
Employees 95
Contractors 40
Staff to resident ratio 0 : 0
100% fewer staff per resident than South Carolina average
South Carolina average ratio: 1.84 : 1 South Carolina average ratio: 1.84 : 1See full South Carolina ranking
Avg staff/day 40
Average shift 8 hours
0% compared with South Carolina average
South Carolina average: 7.9 hours South Carolina average shift: 7.9 hoursSee full South Carolina ranking
Total staff hours (quarter) 29,594

Nursing staff breakdown

Q4 2025 · Oct 1 – Dec 31 More info This data comes from the CMS Payroll-Based Journal report covering October 1 – December 31, 2025.
Registered Nurse

Manages medical care and health needs.

RN Staff Info All 13 RN Staff are full-time employees. No contractors work on this role. 13
Average shift length Info Average shift length. Calculated as total hours divided by days worked and average staff per day. 8.7 hours
Licensed Practical Nurse

Assists with medical care and medications.

LPN Staff Info All 15 LPN Staff are full-time employees. No contractors work on this role. 15
Average shift length Info Average shift length. Calculated as total hours divided by days worked and average staff per day. 10 hours
Certified Nursing Assistant

Helps with daily care and mobility.

CNA Staff Info 62 total: 51 full-time employees and 11 contractors. 62
Average shift length Info Average shift length. Calculated as total hours divided by days worked and average staff per day. 9.4 hours

Contractor staffing

Q4 2025 · Oct 1 – Dec 31 More info This data comes from the CMS Payroll-Based Journal report covering October 1 – December 31, 2025.

Total hours from contractors

21.2%

6,279 contractor hours this quarter

Certified Nursing Assistant: 11 Speech Language Pathologist: 8 Physical Therapy Aide: 8 Physical Therapy Assistant: 5 Respiratory Therapy Technician: 3 Qualified Social Worker: 3 Other Physician: 1 Medical Director: 1

Staff by category

Q4 2025 · Oct 1 – Dec 31 More info This data comes from the CMS Payroll-Based Journal report covering October 1 – December 31, 2025.
Certified Nursing Assistant5111629,61192100%9.4
Licensed Practical Nurse150153,84692100%10
Registered Nurse130133,07492100%8.7
RN Director of Nursing6063,0666975%8.8
Speech Language Pathologist0881,8508289%6.2
Physical Therapy Aide0881,3718997%5.9
Respiratory Therapy Technician0331,1407278%6.1
Administrator2029766267%8
Physical Therapy Assistant0558857683%5
Qualified Social Worker0336777278%5.8
Mental Health Service Worker1015126470%8
Occupational Therapy Aide1014886166%8
Clinical Nurse Specialist3034845964%8
Dental Services Staff1014776166%7.8
Other Dietary Services Staff1014616166%7.6
Nurse Practitioner1014565762%8
Medical Director0111363437%4
Other Physician011842123%4
62 Certified Nursing Assistant
% of Days 100%
15 Licensed Practical Nurse
% of Days 100%
13 Registered Nurse
% of Days 100%
6 RN Director of Nursing
% of Days 75%
8 Speech Language Pathologist
% of Days 89%
8 Physical Therapy Aide
% of Days 97%
3 Respiratory Therapy Technician
% of Days 78%
2 Administrator
% of Days 67%
5 Physical Therapy Assistant
% of Days 83%
3 Qualified Social Worker
% of Days 78%
1 Mental Health Service Worker
% of Days 70%
1 Occupational Therapy Aide
% of Days 66%
3 Clinical Nurse Specialist
% of Days 64%
1 Dental Services Staff
% of Days 66%
1 Other Dietary Services Staff
% of Days 66%
1 Nurse Practitioner
% of Days 62%
1 Medical Director
% of Days 37%
1 Other Physician
% of Days 23%

Penalties and fines

Federal penalties imposed by CMS for regulatory violations, including civil money penalties (fines) and denials of payment for new Medicare/Medicaid admissions.

Source: CMS Penalties Database

No penalties in the past 3 years

No civil money penalties or payment denials were reported in the last 3 years.

Quality of care over time

These measures show how residents usually do over time at this home, based on health outcomes and preventive care.

Short-stay resident measures
Pneumococcal Vaccine Info Percent of short-stay residents assessed and appropriately given the pneumococcal vaccine 99.8%
25% better than South Carolina average

South Carolina average: 79.5%

Antipsychotic medication increase Info Percent of short-stay residents who newly received an antipsychotic medication 0.6%
62% better than South Carolina average

South Carolina average: 1.7%

Influenza Vaccine Info Percent of short-stay residents assessed and appropriately given the seasonal influenza vaccine 98.5%
26% better than South Carolina average

South Carolina average: 78.0%

Breakdown by payment type

Medicare

92% of new residents, usually for short-term rehab.

Typical stay 23 days

Private pay

8% of new residents, often for short stays.

Typical stay 1 years

Finances and operations

Based on CMS SNF Cost Report for fiscal year ending in 12/2023.

Governmental community
Operated by a subsidized facility district.
Net patient revenue Info Net patient revenue — what the home actually collects for resident care, after contractual allowances, bad debt and discounts are subtracted from its gross charges (CMS cost report, Worksheet G-3). It covers resident care only; money the home earns from other sources is shown separately as "Other income."
$23.7M
Net patient income Info Net patient income: net patient revenue minus the home's total operating expenses. A positive figure means it earns more from resident care than it spends to deliver it; a negative figure means the opposite. It excludes non-operating "other income."
-$84.5K
Governmental community Operated by a subsidized facility district.
Net patient revenue Info Net patient revenue — what the home actually collects for resident care, after contractual allowances, bad debt and discounts are subtracted from its gross charges (CMS cost report, Worksheet G-3). It covers resident care only; money the home earns from other sources is shown separately as "Other income."
$23.7M Rank #9 / 125Revenue — State benchmarkedThis home is ranked 9th out of 125 homes in South Carolina. Shows this facility's annual revenue compared to the South Carolina average. Higher revenue generally means more resources for staffing and capital — read alongside Payroll %.Rankings are based only on facilities in South Carolina that report data for that category. Facilities without available data are excluded from the ranking.Click the rank badge to see the full State ranking.Click here to see the full State ranking.
Net patient income Info Net patient income: net patient revenue minus the home's total operating expenses. A positive figure means it earns more from resident care than it spends to deliver it; a negative figure means the opposite. It excludes non-operating "other income."
-$84.5K
Other income Info Money the home earns outside of resident care — such as investments, grants, rentals and other non-operating sources (CMS cost report, Worksheet G-3). It is tracked separately from net patient revenue: it is not part of that figure, and it is not included in net patient income.
$1.7M
Payroll costs Info Staff salaries plus wage-related costs — benefits such as payroll taxes, health insurance and retirement — from the home's own accounting records (CMS cost report, Worksheet A). Contract or agency labor is counted separately, under other operating costs. Rank #6 / 125Payroll — State benchmarkedThis home is ranked 6th out of 125 homes in South Carolina. Shows total annual staff payroll benchmarked to the South Carolina average. Higher payroll investment relative to peers often signals better staffing and less reliance on cheaper contract labor.Rankings are based only on facilities in South Carolina that report data for that category. Facilities without available data are excluded from the ranking.Click the rank badge to see the full State ranking.Click here to see the full State ranking.
$11.7M 49.2% of net patient revenue Info Payroll as a share of revenue: staff salaries and wage-related benefits divided by net patient revenue. A higher figure means more of each revenue dollar goes to staff pay. Rank #76 / 125Payroll % — State benchmarkedThis home is ranked 76th out of 125 homes in South Carolina. Shows payroll as a percentage of revenue versus the South Carolina average. Well-run South Carolina facilities typically land around 53–64% — the top third Statewide. Below 25% may signal understaffing or heavy agency use — read with Staffing ratings.Rankings are based only on facilities in South Carolina that report data for that category. Facilities without available data are excluded from the ranking.Click the rank badge to see the full State ranking.Click here to see the full State ranking.
Other operating costs Info Everything it costs to run the home apart from payroll — food, utilities, supplies, maintenance, contract labor and administration. Calculated as total operating expense minus payroll (staff salaries and wage-related benefits).
$12.1M
Total costs Info The home's total operating expense for the year — all the costs of running it, salaries included (CMS cost report, Worksheet G-3).
$23.8M

What does this home offer?

Room sizes icon
Room sizes icon

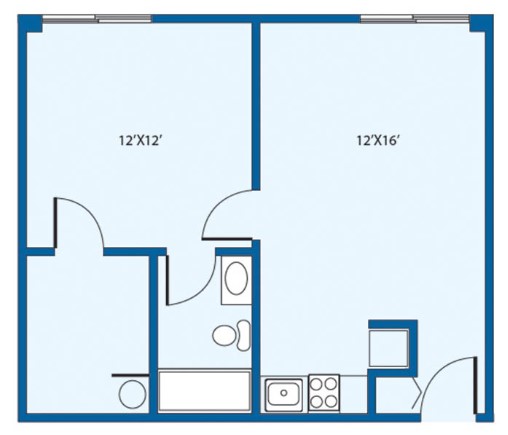
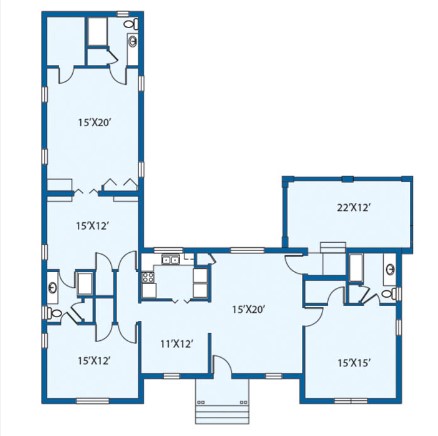
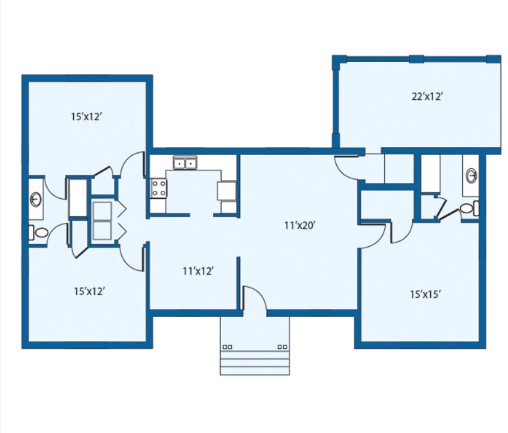
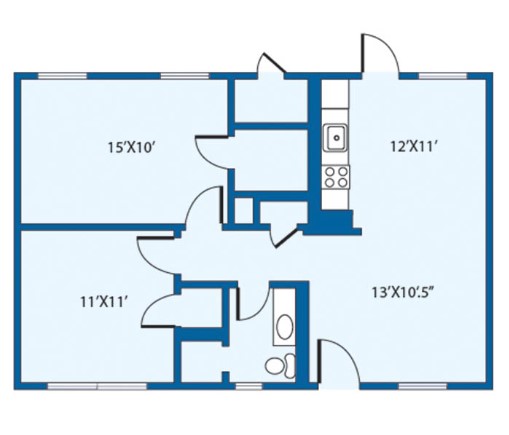
Room Sizes: 500 / 530 / 857 / 800 / 870-1140 / 906 / 1117 / 1400 / 1800 sq. ft

Housing options icon

Housing Options: 1 Bed / 2 Bed / 3 Bed

Fitness and recreation icon

Fitness and Recreation

Who this home usually serves

TYPE OF STAY

Mostly short-term rehab stays

Most residents typically stay for a few weeks or months before returning home or moving on.

Most new residents arrive under Medicare (92% of admissions), and a typical Medicare stay runs around 23 days.

Admissions
526 total

Coverage residents most often arrive under.

Medicare 92%
Private pay 8%
Discharges
451 total

Coverage residents most often leave under.

Medicare 83%
Private pay 17%

Living Spaces & Floor Plans for The Village at Summerville

The Village At Summerville 2
The Village At Summerville3
The Village At Summerville2
The Village At Summerville1

Places of interest near The Village at Summerville

Address 1.5 miles from city center Info Estimated distance in miles from Summerville's city center to The Village at Summerville's address, calculated via Google Maps. — 4.76 miles to nearest hospital (HCA Healthcare Summerville Hospital, A part of Trident Hospital)

Calculate Travel Distance to The Village at Summerville

Add your location

Address

Compare Nursing Homes around South Carolina

The information below is reported by the South Carolina Department of Public Health, Bureau of Healthcare Quality.

5 facilities compared · CMS & SC Dept. of Health data

Wildewood Downs Retirement Community
NH
AL
IL
MC
Columbia (Williamsburg East)
57
Facility 57
SC AVG 90
Rank #229 / 309
28.1%
Facility 28.1%
SC AVG 82.1%
Rank #127 / 131
-66%
5.41
Facility 5.41
SC AVG 4.00
Rank #10 / 121
+300%+35%
$3.7k
Facility $3.7k
SC AVG $34.8k
Rank #56 / 123
13
Facility 13
SC AVG 13.7
Rank #71 / 122
4.3
Facility 4.3
SC AVG 3.4
Rank #92 / 122
-16A+
33
Facility 33
SC AVG 32
Rank #119 / 232
Diana Chavis
$6.6M
Facility $6.6M
SC AVG $13.0M
Rank #38 / 125
$6.1M
Facility $6.1M
SC AVG $5.4M
Rank #59 / 125
92.9%
Facility 92.9%
SC AVG 44%
Rank #101 / 125
425385
The Village at Summerville
NH
AL
IL
MC
RC
Summerville (Palmetto Park)
48
Facility 48
SC AVG 90
Rank #267 / 309
86.5%
Facility 86.5%
SC AVG 82.1%
Rank #54 / 131
+5%
4.14
Facility 4.14
SC AVG 4.00
Rank #42 / 121
+3%+4%
$0
Facility $0
SC AVG $34.8k
Rank #1 / 123
2
Facility 2
SC AVG 13.7
Rank #2 / 122
2.0
Facility 2.0
SC AVG 3.4
Rank #14 / 122
-40-
45
Facility 45
SC AVG 32
Rank #60 / 232
Presbyterian Communities Of South Carolina
$23.7M
Facility $23.7M
SC AVG $13.0M
Rank #9 / 125
$11.7M
Facility $11.7M
SC AVG $5.4M
Rank #6 / 125
49.2%
Facility 49.2%
SC AVG 44%
Rank #76 / 125
425389
Wesley Commons
NH
AL
IL
MC
Greenwood (Parkwood)
80
Facility 80
SC AVG 90
Rank #168 / 309
90.9%
Facility 90.9%
SC AVG 82.1%
Rank #26 / 131
+11%
4.60
Facility 4.60
SC AVG 4.00
Rank #23 / 121
+59%+15%
$14.5k
Facility $14.5k
SC AVG $34.8k
Rank #88 / 123
6
Facility 6
SC AVG 13.7
Rank #20 / 122
2.0
Facility 2.0
SC AVG 3.4
Rank #14 / 122
177A+
0
Facility 0
SC AVG 32
Rank #229 / 232
Wesley Commons
$8.8M
Facility $8.8M
SC AVG $13.0M
Rank #74 / 125
$3.8M
Facility $3.8M
SC AVG $5.4M
Rank #112 / 125
43.1%
Facility 43.1%
SC AVG 44%
Rank #120 / 125
425078
Life Care Center of Hilton Head
NH
NC
Hilton Head Island
88
Facility 88
SC AVG 90
Rank #144 / 309
59.9%
Facility 59.9%
SC AVG 82.1%
Rank #116 / 131
-27%
3.68
Facility 3.68
SC AVG 4.00
Rank #72 / 121
+74%-8%
$8.3k
Facility $8.3k
SC AVG $34.8k
Rank #72 / 123
16
Facility 16
SC AVG 13.7
Rank #85 / 122
4.0
Facility 4.0
SC AVG 3.4
Rank #84 / 122
159-
23
Facility 23
SC AVG 32
Rank #152 / 232
John Oehler
$5.1M
Facility $5.1M
SC AVG $13.0M
Rank #110 / 125
$4.3M
Facility $4.3M
SC AVG $5.4M
Rank #106 / 125
85%
Facility 85%
SC AVG 44%
Rank #24 / 125
425147
Brookdale Anderson -
NH
AL
IL
MC
Anderson (Windsor Place)
160
Facility 160
SC AVG 90
Rank #20 / 309
--------------
43
Facility 43
SC AVG 32
Rank #71 / 232
$5.9M
Facility $5.9M
SC AVG $13.0M
Rank #119 / 125
$3.3M
Facility $3.3M
SC AVG $5.4M
Rank #115 / 125
56.1%
Facility 56.1%
SC AVG 44%
Rank #2 / 125
425398

Financial Assistance for
Nursing Home in South Carolina

The Village at Summerville is located in Summerville, South Carolina.
Here are the financial assistance programs available to residents in South Carolina.

Get Financial aid guidance

Community Long Term Care (CLTC)

SC Medicaid CLTC

Age 65+ or disabled
General South Carolina resident, Medicaid-eligible, nursing home-level care need.
Income Limits (2025) ~$2,829/month 300% FBR, individual
Asset Limits $2,000 (individual), $3,000 (couple).
SC

High rural demand; waitlists possible.

Benefits
Personal care (5-7 hours/day) Respite (240 hours/year) Adult day care ($60/day) Home modifications ($1,500 avg.)

South Carolina Respite Care Program

SC NFCSP Respite

Age Caregiver of someone 60+ (or with dementia)
General South Carolina resident.
Income Limits No strict limit; prioritizes low-income.
Asset Limits Not applicable.
SC

Limited slots; rural/urban balance.

Benefits
In-home respite (4-6 hours/day) Adult day care (~$60/day) Short-term facility care (up to 5 days)

Medicare Savings Program (MSP)

South Carolina Medicare Savings Program

Age 65+ or disabled
General SC resident, Medicare Part A/B.
Income Limits (2025) ~$2,510/month (QMB), ~$3,380/month (SLMB), ~$3,598/month (QI)—individual.
Asset Limits $9,430 (individual), $14,130 (couple).
SC

Three tiers; includes Extra Help for Part D; no waitlist.

Benefits
Covers Part B premiums ($174.70/month) Deductibles ($240/year) Copays (~20%)

VA Aid and Attendance (A&A) and Housebound Benefits

South Carolina VA Aid and Attendance/Housebound

Age 65+ or disabled veteran/spouse
General SC resident, wartime service, need for ADL help (A&A) or homebound.
Income Limits (2025) Net income < ~$1,984/month (veteran with dependent, A&A); pension offsets income.
Asset Limits ~$155,356 net worth limit
SC

High veteran population; supports rural/urban care needs.

Benefits
Cash (~$1,433-$2,642/month veteran, ~$951-$1,318 spouse) for care costs (e.g., in-home, assisted living)

Senior Farmers’ Market Nutrition Program (SFMNP)

South Carolina SFMNP

Age 60+
General SC resident, low-income.
Income Limits (2025) ~$2,322/month individual, 185% FPL
Asset Limits Not assessed.
SC

Vouchers (~$50/season); serves ~20,000 annually via 10 AAAs.

Benefits
Vouchers (~$50/season) for fresh produce at approved markets

Homestead Exemption Program

South Carolina Homestead Exemption

Age 65+ (or disabled/blind)
General SC resident 1+ year, homeowner.
Income Limits (2025) None; tax-based eligibility.
Asset Limits Not assessed; home-focused.
SC

Saves ~$500-$1,000/year avg.; applies to primary residence.

Benefits
Property tax exemption (~$50,000 value, ~$500-$1,000/year savings)

Elderly Simplified Application Project (ESAP)

South Carolina ESAP (SNAP for Seniors)

Age 60+
General SC resident, no earned income, not on SCCAP.
Income Limits (2025) ~$1,732/month 133% FPL, individual
Asset Limits $4,250 individual, higher than standard SNAP
SC

Simplified process; serves ~50,000 seniors annually.

Benefits
EBT card for food (~$100-$300/month based on income)

Frequently Asked Questions about The Village at Summerville

What neighborhood is The Village at Summerville in?

The Village at Summerville is in the Palmetto Park neighborhood.

Is The Village at Summerville in a walkable area?

The Village at Summerville has a walk score of 45. Somewhat walkable. A few nearby services may be reachable on foot, but most trips require transportation.

What is the occupancy rate at The Village at Summerville?

The Village at Summerville's occupancy is 86.5%.

Are there photos of The Village at Summerville?

Yes — there are 4 photos of The Village at Summerville in the photo gallery on this page.

What is the address of The Village at Summerville?

The Village at Summerville is located at 201 W 9Th N St, Summerville, SC 29483.

What is the phone number of The Village at Summerville?

(843) 873-3560 will put you in contact with the team at The Village at Summerville.

Is The Village at Summerville Medicare or Medicaid certified?

Yes — The Village at Summerville is a CMS-certified provider of Medicare and Medicaid.

Guides for Better Senior Living

Care Cost Calculator: See Prices in Your Area

Nursing Home Data Explorer

Don’t Wait Too Long: 7 Red Flag Signs Your Parent Needs Assisted Living Now

The True Cost of Assisted Living in 2025 – And How Families Are Paying For It

Understanding Senior Living Costs: Pricing Models, Discounts & Financial Assistance