

Total staff
135
Employees
95
Contractors
40

We arrange tours, appointments, and even moving support so you don’t have to
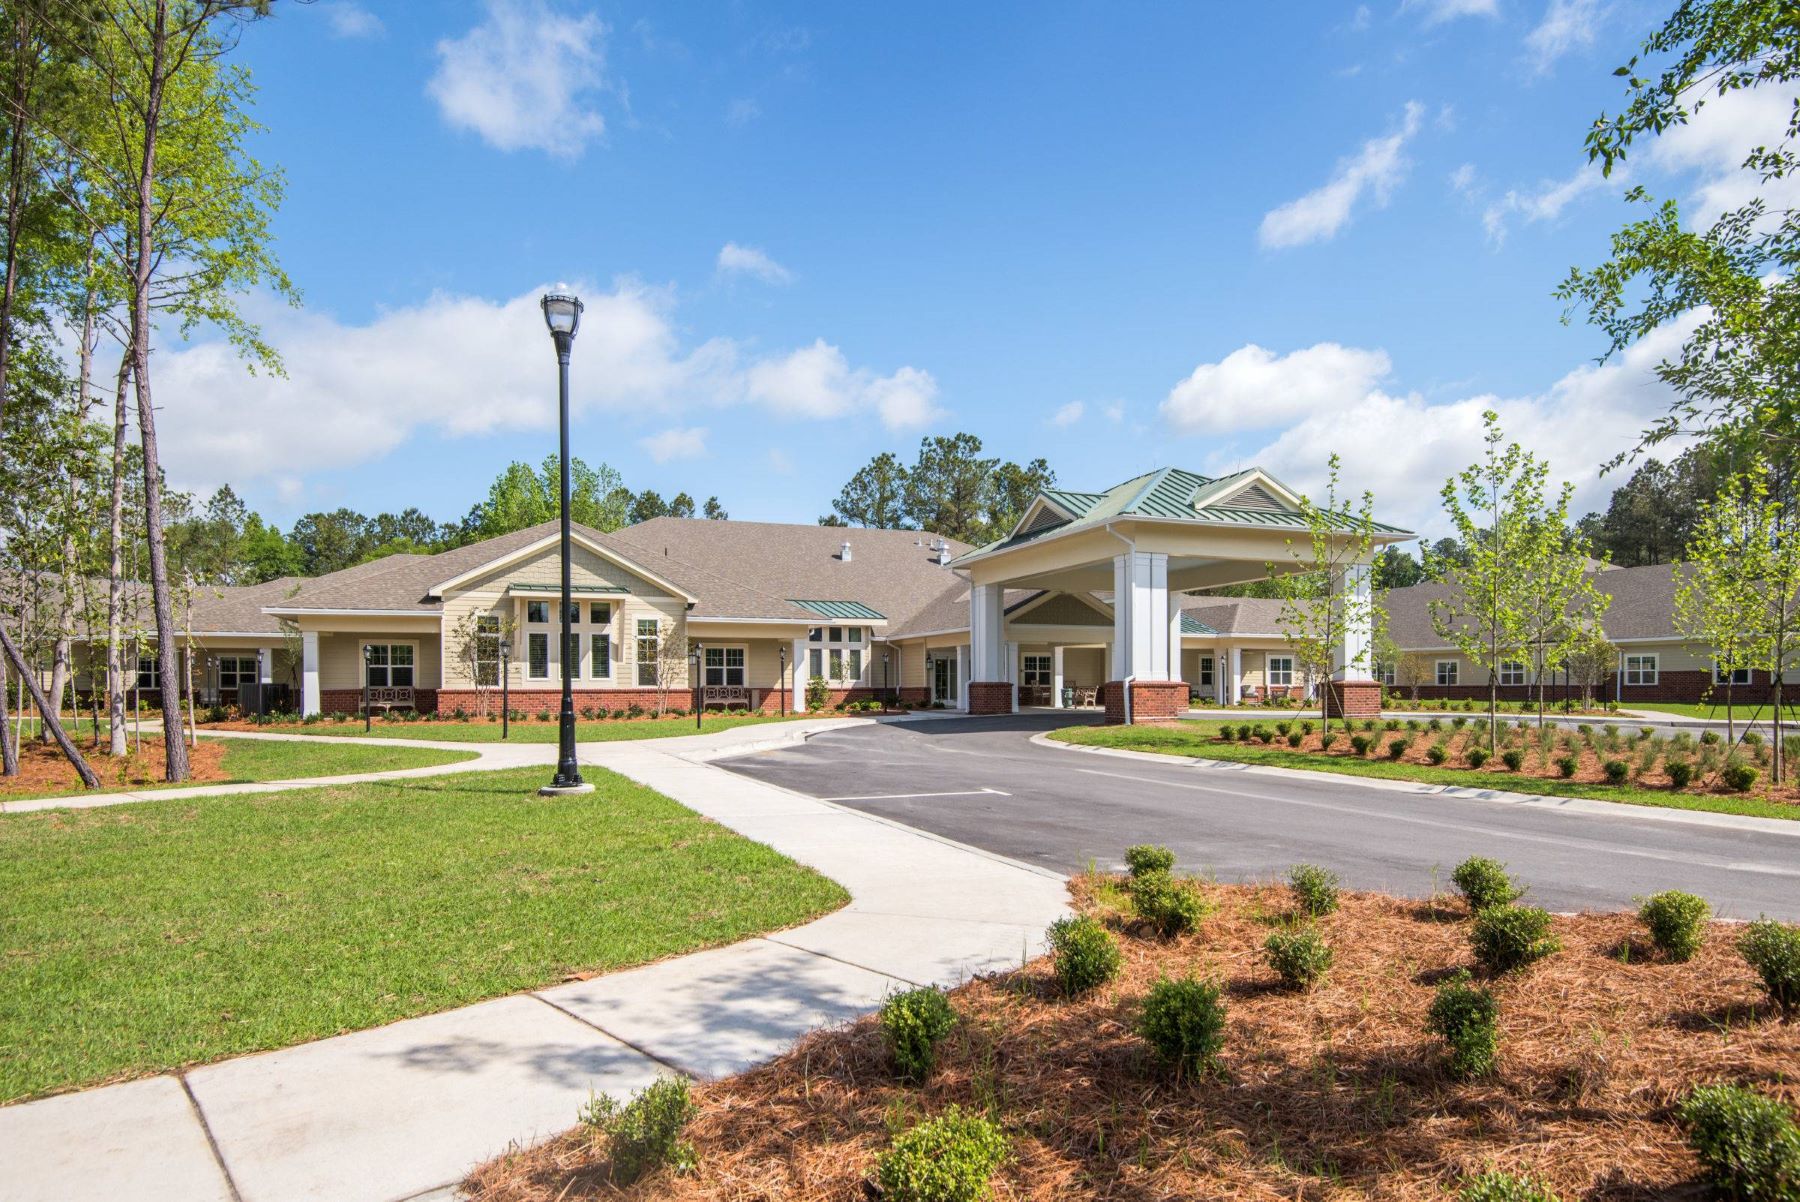
Nestled in 84 acres of pristine land in South Carolina, The Village at Summerville has been a non-profit organization since 1958, ensuring that the focus remains on providing quality care and services to the residents. The community offers various living options, including independent living, assisted living, memory support, skilled nursing, restorative care, short-term rehab, and outpatient rehab.
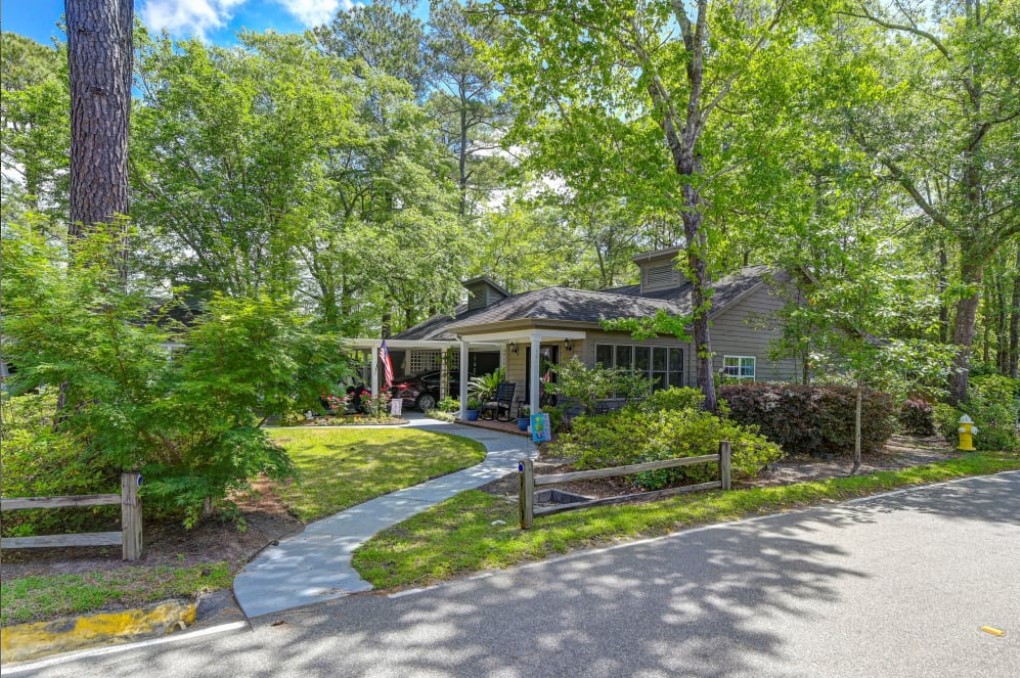
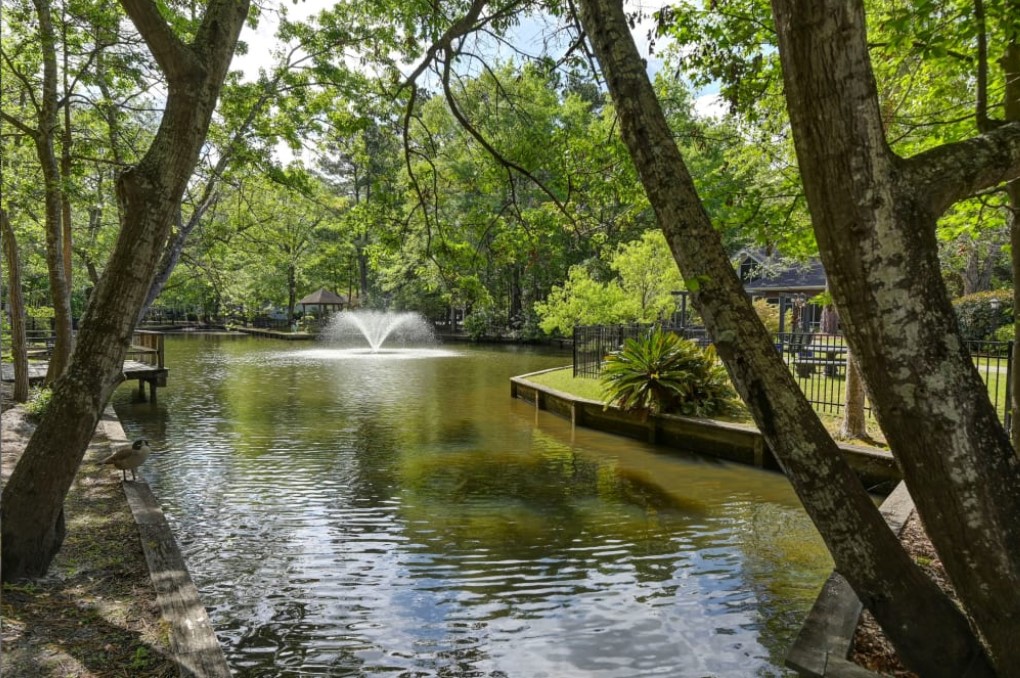
The home boasts breathtaking scenery, from serene small ponds to majestic trees and walking trails. It offers a convenient location close to Interstate 26 and just a stone’s throw away from downtown Charleston, making it a perfect blend of nature and urban convenience.
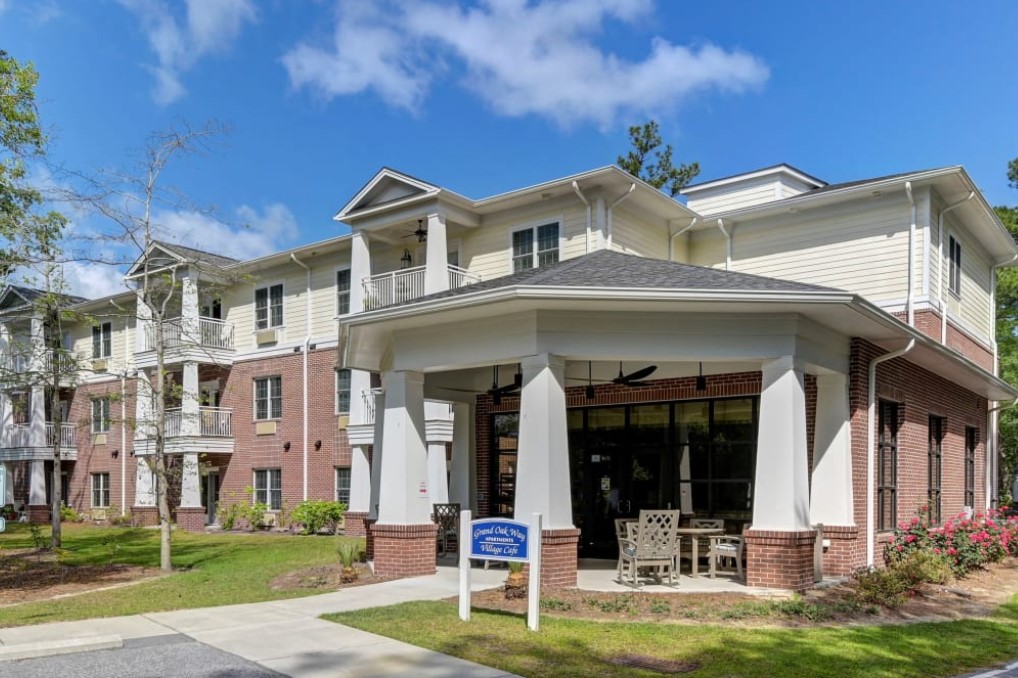
The living spaces at The Village at Summerville are not only stylish but also spacious and airy, providing residents with a comfortable and welcoming environment. Whether it’s a stroll around the campus or participating in various activities and events, residents can create meaningful connections and lead fulfilling lives in this lovely community.
| Staff type | Hours / Day / Resident | vs state avg |
|---|---|---|
|
Weekend Total Nursing
| 4h 24m per day | ▲ 34% State avg: 3h 18m per day · National avg: 3h 25m per day |
Reporting period: October 1 – December 31, 2025 (Q4 2025). Source: CMS Payroll-Based Journal report.
Manages medical care and health needs.
No contractors work on this role.
Assists with medical care and medications.
No contractors work on this role.
Helps with daily care and mobility.
This role is partially covered by contractors.
Total hours from contractors
6,279 contractor hours this quarter
| Certified Nursing Assistant | 51 | 11 | 62 | 9,611 | 92 | 100% | 9.4 |
| Licensed Practical Nurse | 15 | 0 | 15 | 3,846 | 92 | 100% | 10 |
| Registered Nurse | 13 | 0 | 13 | 3,074 | 92 | 100% | 8.7 |
| RN Director of Nursing | 6 | 0 | 6 | 3,066 | 69 | 75% | 8.8 |
| Speech Language Pathologist | 0 | 8 | 8 | 1,850 | 82 | 89% | 6.2 |
| Physical Therapy Aide | 0 | 8 | 8 | 1,371 | 89 | 97% | 5.9 |
| Respiratory Therapy Technician | 0 | 3 | 3 | 1,140 | 72 | 78% | 6.1 |
| Administrator | 2 | 0 | 2 | 976 | 62 | 67% | 8 |
| Physical Therapy Assistant | 0 | 5 | 5 | 885 | 76 | 83% | 5 |
| Qualified Social Worker | 0 | 3 | 3 | 677 | 72 | 78% | 5.8 |
| Mental Health Service Worker | 1 | 0 | 1 | 512 | 64 | 70% | 8 |
| Occupational Therapy Aide | 1 | 0 | 1 | 488 | 61 | 66% | 8 |
| Clinical Nurse Specialist | 3 | 0 | 3 | 484 | 59 | 64% | 8 |
| Dental Services Staff | 1 | 0 | 1 | 477 | 61 | 66% | 7.8 |
| Other Dietary Services Staff | 1 | 0 | 1 | 461 | 61 | 66% | 7.6 |
| Nurse Practitioner | 1 | 0 | 1 | 456 | 57 | 62% | 8 |
| Medical Director | 0 | 1 | 1 | 136 | 34 | 37% | 4 |
| Other Physician | 0 | 1 | 1 | 84 | 21 | 23% | 4 |
Federal penalties imposed by CMS for regulatory violations, including civil money penalties (fines) and denials of payment for new Medicare/Medicaid admissions.
Source: CMS Penalties Database
No penalties in the past 3 years
No civil money penalties or payment denials were reported in the last 3 years.
These measures show how residents usually do over time at this home, based on health outcomes and preventive care.
South Carolina average: 79.5%
South Carolina average: 1.7%
South Carolina average: 78.0%
Quality measures are calculated from Minimum Data Set (MDS) assessments. For most measures, lower percentages indicate better care quality.
92% of new residents, usually for short-term rehab.
8% of new residents, often for short stays.
Historical financial and operational data for The Village at Summerville based on CMS SNF Cost Reports.
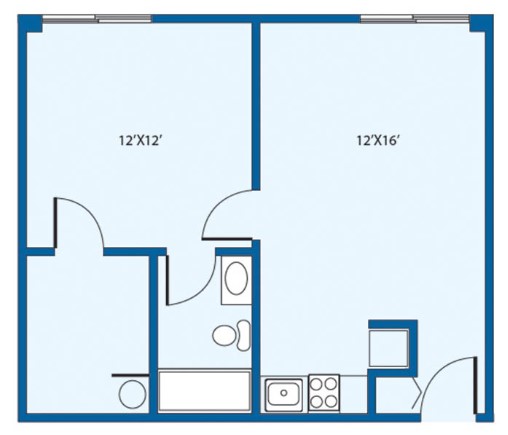
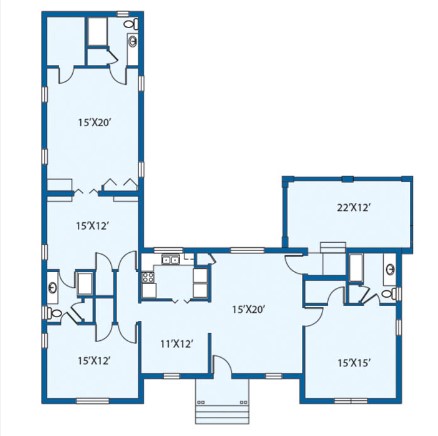
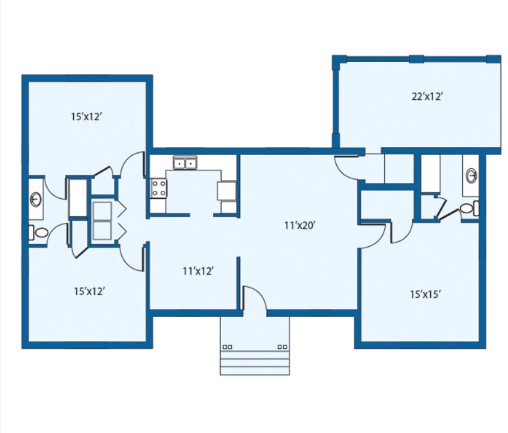
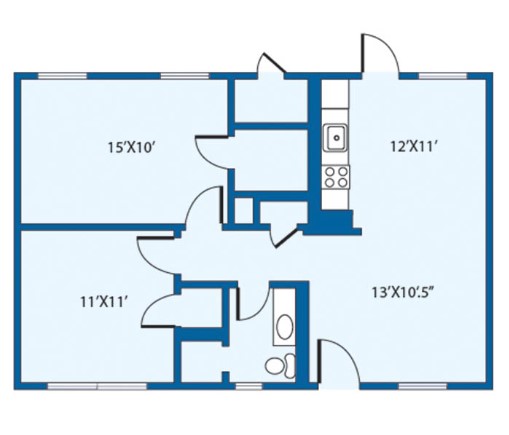
Room Sizes: 500 / 530 / 857 / 800 / 870-1140 / 906 / 1117 / 1400 / 1800 sq. ft
Housing Options: 1 Bed / 2 Bed / 3 Bed
Fitness and Recreation
Most residents typically stay for a few weeks or months before returning home or moving on.
![]() 1.5 miles from city center
1.5 miles from city center
![]() Estimated distance in miles from Summerville's city center to The Village at Summerville's address, calculated via Google Maps.
— 4.76 miles to nearest hospital (HCA Healthcare Summerville Hospital, A part of Trident Hospital)
Estimated distance in miles from Summerville's city center to The Village at Summerville's address, calculated via Google Maps.
— 4.76 miles to nearest hospital (HCA Healthcare Summerville Hospital, A part of Trident Hospital)
Add your location
The Village at Summerville is located in Summerville, South Carolina.
Here are the financial assistance programs available to residents in South Carolina.
The information below is reported by the South Carolina Department of Public Health, Bureau of Healthcare Quality.
| The Village at Summerville |
NH Nursing Home Licensed facility providing 24/7 skilled nursing care for residents with complex, ongoing medical needs. Staffed by RNs, LPNs, and CNAs. Inspected and star-rated annually by CMS. Accepts Medicare (short-term rehab) and Medicaid (long-term care).
AL Assisted Living A licensed, long-term care setting for seniors or individuals with disabilities who need help with daily activities — like bathing, dressing, and medication management — but not 24-hour skilled nursing. Offers housing, meals, and around-the-clock support while aiming to maximize resident independence.
IL Independent Living Lifestyle-focused communities for older adults offering dining, activities, and transportation with minimal personal care. Best for active, independent seniors who want community without medical support.
MC Memory Care Secured, specialized care for people living with Alzheimer's or dementia. Staff trained in cognitive impairment, with higher staff-to-resident ratios and an environment designed to reduce confusion and wandering risk. | Summerville (Palmetto Park) | 88 | 86.5% | +5% | 4.14 | +3% | +4% | $0 | 2 | 2.0 | - | 38 | - | 45 | Presbyterian Communities Of South Carolina | $28.8M | $13.0M | 45.1% | 425389 | ||||
| Still Hopes Episcopal Retirement Community |
NH Nursing Home Licensed facility providing 24/7 skilled nursing care for residents with complex, ongoing medical needs. Staffed by RNs, LPNs, and CNAs. Inspected and star-rated annually by CMS. Accepts Medicare (short-term rehab) and Medicaid (long-term care).
AL Assisted Living A licensed, long-term care setting for seniors or individuals with disabilities who need help with daily activities — like bathing, dressing, and medication management — but not 24-hour skilled nursing. Offers housing, meals, and around-the-clock support while aiming to maximize resident independence.
HC Home Care Professional care delivered in the person's own home — from companionship and errands to skilled nursing and therapy. Allows seniors to age in place. Medicare covers skilled home health when medically necessary.
IL Independent Living Lifestyle-focused communities for older adults offering dining, activities, and transportation with minimal personal care. Best for active, independent seniors who want community without medical support.
MC Memory Care Secured, specialized care for people living with Alzheimer's or dementia. Staff trained in cognitive impairment, with higher staff-to-resident ratios and an environment designed to reduce confusion and wandering risk.
RC Respite Care Short-term temporary care — days to weeks — to give family caregivers a break. Full care provided during the stay. Often used after hospitalization or to trial a facility before a permanent placement decision. | West Columbia (Still Hopes Drive) | 70 | 89.1% | +9% | - | +65% | - | $12.6k | 5 | 1.3 | 1 | 21 | A+ | 63 | Frances Case | $44.9M | $23.7M | 52.7% | 425401 | ||||
| Wildewood Downs Retirement Community |
NH Nursing Home Licensed facility providing 24/7 skilled nursing care for residents with complex, ongoing medical needs. Staffed by RNs, LPNs, and CNAs. Inspected and star-rated annually by CMS. Accepts Medicare (short-term rehab) and Medicaid (long-term care).
AL Assisted Living A licensed, long-term care setting for seniors or individuals with disabilities who need help with daily activities — like bathing, dressing, and medication management — but not 24-hour skilled nursing. Offers housing, meals, and around-the-clock support while aiming to maximize resident independence.
IL Independent Living Lifestyle-focused communities for older adults offering dining, activities, and transportation with minimal personal care. Best for active, independent seniors who want community without medical support.
MC Memory Care Secured, specialized care for people living with Alzheimer's or dementia. Staff trained in cognitive impairment, with higher staff-to-resident ratios and an environment designed to reduce confusion and wandering risk. | Columbia (Williamsburg East) | 57 | 28.1% | -66% | 5.41 | +300% | +35% | $3.7k | 13 | 4.3 | - | 16 | A+ | 33 | Diana Chavis | $18.0M | $7.0M | 39% | 425385 | ||||
| Franke at Seaside |
NH Nursing Home Licensed facility providing 24/7 skilled nursing care for residents with complex, ongoing medical needs. Staffed by RNs, LPNs, and CNAs. Inspected and star-rated annually by CMS. Accepts Medicare (short-term rehab) and Medicaid (long-term care).
AL Assisted Living A licensed, long-term care setting for seniors or individuals with disabilities who need help with daily activities — like bathing, dressing, and medication management — but not 24-hour skilled nursing. Offers housing, meals, and around-the-clock support while aiming to maximize resident independence.
IL Independent Living Lifestyle-focused communities for older adults offering dining, activities, and transportation with minimal personal care. Best for active, independent seniors who want community without medical support.
MC Memory Care Secured, specialized care for people living with Alzheimer's or dementia. Staff trained in cognitive impairment, with higher staff-to-resident ratios and an environment designed to reduce confusion and wandering risk. | Mt Pleasant | 44 | 85.6% | +4% | 4.11 | -45% | +3% | $0 | 9 | 3.0 | - | 40 | A+ | 53 | Lutheran Homes Of Sc, Inc. | $23.2M | $7.8M | 33.5% | 425374 | ||||
| The Oaks of Orangeburg |
NH Nursing Home Licensed facility providing 24/7 skilled nursing care for residents with complex, ongoing medical needs. Staffed by RNs, LPNs, and CNAs. Inspected and star-rated annually by CMS. Accepts Medicare (short-term rehab) and Medicaid (long-term care).
AL Assisted Living A licensed, long-term care setting for seniors or individuals with disabilities who need help with daily activities — like bathing, dressing, and medication management — but not 24-hour skilled nursing. Offers housing, meals, and around-the-clock support while aiming to maximize resident independence.
HC Home Care Professional care delivered in the person's own home — from companionship and errands to skilled nursing and therapy. Allows seniors to age in place. Medicare covers skilled home health when medically necessary.
IL Independent Living Lifestyle-focused communities for older adults offering dining, activities, and transportation with minimal personal care. Best for active, independent seniors who want community without medical support. | Orangeburg (Felder) | 122 | 76.8% | -6% | 2.98 | -59% | -25% | $122.3k | 23 | 4.6 | 1 | 114 | A+ | 0 | Joseph Fowler | $13.1M | $7.3M | 55.9% | 425131 |
The Village at Summerville is in the Palmetto Park neighborhood.
The Village at Summerville has a walk score of 45. Somewhat walkable. A few nearby services may be reachable on foot, but most trips require transportation.
The Village at Summerville is located at 201 W 9th N St, Summerville, SC 29483, United States.
(843) 873-3560 will put you in contact with the team at The Village at Summerville.
Yes — The Village at Summerville is a CMS-certified provider of Medicare and Medicaid.
Care Cost Calculator: See Prices in Your Area
Nursing Home Data Explorer
Don’t Wait Too Long: 7 Red Flag Signs Your Parent Needs Assisted Living Now
The True Cost of Assisted Living in 2025 – And How Families Are Paying For It
Understanding Senior Living Costs: Pricing Models, Discounts & Financial Assistance


Thank you for your interest!
Our team will be in touch shortly to help with next steps.
