The Villages of Windcrest
Nursing Home, Assisted Living & Memory Care · Fredericksburg, TX
CMS overall rating Info The Overall CMS Rating is scored from 1 to 5 stars and combines results from health inspections, staffing levels, and quality measures. Health inspections carry the most weight. Staffing and quality scores can increase or decrease the final rating based on performance compared to state and national standards.

The Villages of Windcrest

Nursing Home, Assisted Living & Memory Care · Fredericksburg, TX
CMS overall rating Info The Overall CMS Rating is scored from 1 to 5 stars and combines results from health inspections, staffing levels, and quality measures. Health inspections carry the most weight. Staffing and quality scores can increase or decrease the final rating based on performance compared to state and national standards.
Calculator: See prices in your area
The Villages of Windcrest accepts Medicare, Medicaid, and private pay.

Overview of The Villages of Windcrest

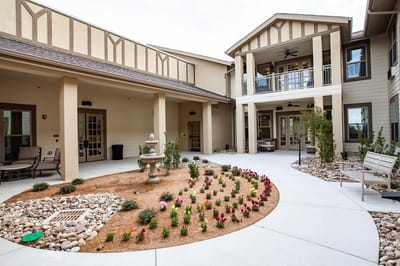
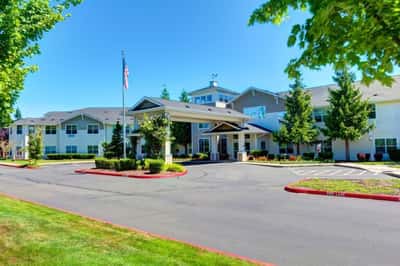
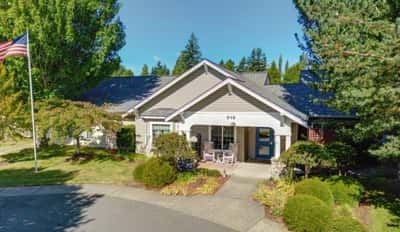
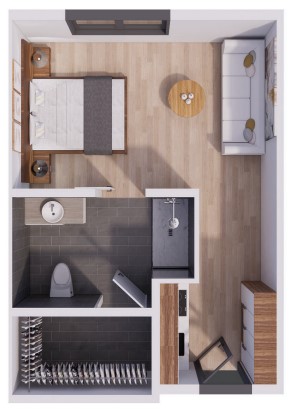
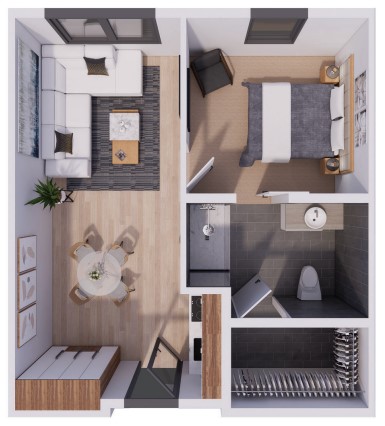
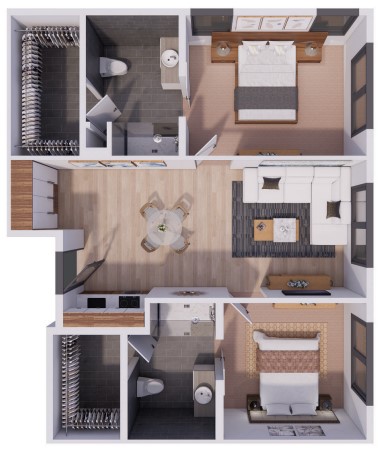
The Villages of Windcrest operates an 86-bed nursing home at 702 W Windcrest St in Fredericksburg’s Gillespie County, administered by Mr. Kraig A Turpen under Acron Windcrest Village LLC.

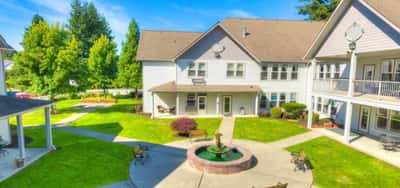
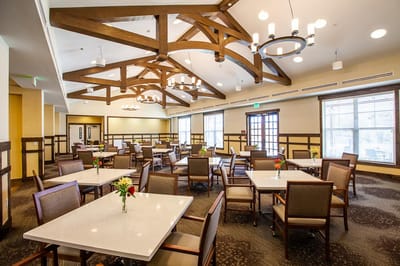
The two-story facility has provided nursing home, assisted living, and memory care (including 24 dedicated Alzheimer’s units) for seven years, serving a mixed payer population: 35% Medicare residents (typically short-term rehab), 22% Medicaid, and 43% private pay. Current occupancy is 59.6%, lower than the Texas average of 63.5%, with average resident stays extending to 202 days.

The facility holds a 1-star overall CMS rating, 66.8% below Texas average. This reflects a 1-star Health Inspection rating (65.4% below state average) and a 1-star Staffing rating (58.3% below state average).

Seven state inspections since 2022 resulted in 45 health citations; placing the facility at the 257th precentile among 292 Texas nursing homes, among the worst-performing in the state.

Citations average 6.43 per inspection, the second-worst rate statewide. Five deficiencies reached critical severity, 150% worse than the state average. The primary problems cluster in documentation and quality of life (8 deficiencies), resident rights (6), abuse and neglect safeguards (6), pharmacy services (5), and infection control (3).

The facility has incurred $94,000 in federal penalties across three assessments since 2024, culminating in a $49,000 civil money penalty in January 2025 and a $2,250 administrative penalty in October 2024 for failures in abuse and neglect protection.

Resident outcome measures reveal safety gaps. Falls with major injury occurred in 7.1% of long-stay residents; more than double the state average of 3.2%. Walking ability declined in 23.4% of residents, 44% worse than the state norm.

Staffing ratios exceed state average (1.82:1 vs. 1.48:1), though 47% of staff are contractors. Payroll represents 31.4% of revenue, significantly below the sustainable 51–63% range typical of well-run facilities.

The facility’s regulatory and clinical trajectory presents unresolved safety concerns and elevated risk across standard quality metrics.

(830) 307-7407

Quality ratings

Measured by Centers for Medicare & Medicaid Services (CMS)

Overall rating Info The Overall CMS Rating combines results from health inspections, staffing levels and quality measures. Health inspections carry the most weight. Staffing and quality scores can increase or decrease the final rating based on performance compared to state and national standards.
▼ 66.8% Below TX avg. ▼ 66.8% Below TX avg.Click the badge to see the full State ranking.Click here to see the full State ranking.
Health Inspection Info Based on the results of the facility's three most recent standard inspections and any complaint investigations. CMS reviews the number, scope, and severity of deficiencies, with more recent findings weighted more heavily.
▼ 65.4% Below TX avg. ▼ 65.4% Below TX avg.Click the badge to see the full State ranking.Click here to see the full State ranking.
Staffing Info Measures average nursing staff hours per resident per day, including Registered Nurses (RNs) and total nursing staff. Ratings are adjusted based on the level of care residents require and are compared to state and national benchmarks.
▼ 58.3% Below TX avg. ▼ 58.3% Below TX avg.Click the badge to see the full State ranking.Click here to see the full State ranking.
Quality Measures Info Based on clinical and physical health indicators reported to CMS, such as hospital readmissions, falls, pressure ulcers, and improvements in mobility. These measures reflect how well residents' health needs are being managed.
At TX avg. At TX avg.Click the badge to see the full State ranking.Click here to see the full State ranking.

Staffing hours breakdown

Info Daily nursing hours per resident by staff type, reported to CMS. Higher is generally better — compare this facility to state and national averages to see where staffing stands.

Hours per resident per day — compared to Texas state averages

Total nursing care / resident Info This home is ranked 105th out of 289 homes in Texas. Total adjusted nursing hours per resident per day, combining RN, LPN, and aide time. CMS adjusts this for case-mix so facilities can be fairly compared.
3h 43m per day
Rank #105 / 289Nurse hours — State benchmarkedThis home is ranked 105th out of 289 homes in Texas. Shows adjusted nurse hours per resident per day benchmarked to the Texas average, with a ranking across 289 Texas SNFs. More hours mean more direct care. The national average is about 3.5 hrs; below 3.0 is a red flag.Click the rank badge to see the full State ranking.Click here to see the full State ranking.
This facility Texas avg (3h 47m per day)
vs Texas avg
-2%

0 of 1 metrics below state avg

Standout metric Weekend Total Nursing is +4% above state avg
Staff typeHours / Day / Residentvs state avg
Weekend Total Nursing Info Combined nursing hours (RN + LPN + Nurse Aide) per resident per day on weekends. Staffing often drops on weekends — this figure reveals whether the facility maintains adequate coverage outside of weekday hours. 3h 5m per day ▲ 4% State avg: 2h 58m per day · National avg: 3h 25m per day

Types of Care at The Villages of Windcrest

Assisted Living Memory Care

Capacity and availability

This home usually has availability

Lower occupancy than the Texas average: 63.5%
Occupancy rate
59.6% Rank #197 / 297Occupancy rate — State benchmarkedThis home is ranked 197th out of 297 homes in Texas. Shows this facility's occupancy rate versus the Texas average, with its Statewide rank out of 297. Higher occupancy signals strong local demand and financial stability.Click the rank badge to see the full State ranking.Click here to see the full State ranking.
Avg. Length of Stay
202 days
Bed community size
86-bed community Rank #450 / 987Bed count — State benchmarkedThis home is ranked 450th out of 987 homes in Texas. Shows this facility's certified or reported bed count compared to other Texas SNFs. Larger communities may offer more amenities, programs, and on-site services for residents and families.Click the rank badge to see the full State ranking.Click here to see the full State ranking.
A larger shared setting that may offer more common spaces and organized community services.
Years in operation
7 years in operation Rank #484 / 581Years in operation — State benchmarkedThis home is ranked 484th out of 581 homes in Texas. Shows how long this facility has been in operation compared to other Texas SNFs. Longer operating histories may benefit residents, families, and staff.Click the rank badge to see the full State ranking.Click here to see the full State ranking.
An established community with some operational experience and growing routines.
Walk Score
Walk Score: 13 / 100 Rank #1196 / 1392Walk Score — State benchmarkedThis home is ranked 1196th out of 1392 homes in Texas. Shows how walkable this facility's neighborhood is compared to the average Walk Score across Texas SNFs. Higher scores benefit residents, families, and staff.Click the rank badge to see the full State ranking.Click here to see the full State ranking.
Car-dependent. Most errands require a car, with limited nearby walkable options.

About this community

License Details

Facility TypeType B
StatusLicensed
ExpirationSeptember 5, 2028
CountyGillespie
License Number307312
Year Opened5/9/2019

Ownership & Operating Entity

The Villages of Windcrest is legally operated by Acron Windcrest Village Llc, and administrated by Mr. Kraig A Turpen.

Management CompanyFREDERICKSBURG AL MC CARE PROPERTIES LLC
OwnerACRON WINDCREST VILLAGE LLC
Ownership TypeLimited Liability Company (LLC)

Type Of Units

Alzheimer's Units
24 units
Total beds
86 units

Staffing

Key information about the people who lead and staff this community.

Leadership

Administrator Email[email protected]

Memory & Specialized Care

1 service
Alzheimer's Certification

Contact The Villages of Windcrest

Inspection History

In Texas, the Health and Human Services Commission (HHSC) is the primary regulatory body that conducts unannounced inspections and publishes quality reports for all long-term care homes.

Since 2024 · 2 years of data 1 enforcement action 4 citations 1 inspection

Enforcement Actions Info Enforcement actions are formal penalties or interventions imposed by Texas regulators when a nursing home fails to meet state or federal care, safety, or regulatory standards. They may include directed plans of correction, civil monetary penalties, denial of payment, or appointment of temporary management.

Since 2024
1 enforcement action
  • October 14, 2024 Administrative Penalty

Inspection Scorecard Info This scorecard compares key inspection, citation, and complaint metrics at this facility against the Texas state average. Metrics rated ≥15% worse than average are highlighted in red; those ≥15% better are highlighted in green.

Overall vs. TX average 1 Worse Metrics worse than Texas average:
• Health citations (100% above)
1 At Avg Metrics at Texas average:
• Inspections with citations (at TX avg)
1 Better Metrics better than Texas average:
• Total citations (33% below)

Citations Info Citations are formal regulatory issues recorded during state inspections.

This FacilityTX Averagevs. TX Avg
Total citations Info Formal regulatory issues recorded by inspectors across all inspection types. 46 This facility has 33% fewer total citations than a typical Texas nursing home (4 vs. TX avg 6).↓ 33% better
Health citations Info Violations related to resident care, clinical practices, and day-to-day operations. 42 This facility has 100% more health citations than a typical Texas nursing home (4 vs. TX avg 2).↑ 100% worse

Inspections Info State inspections evaluate whether the facility meets health and safety standards.

This FacilityTX Averagevs. TX Avg
Inspections with citations Info Inspections that resulted in at least one regulatory citation. 11 This facility has inspections with citations in line with the Texas average (1 vs. TX avg 1).— At avg

Inspection Reports Summary Info An editor-reviewed summary of the themes and findings across this facility's recent inspection reports.

The Villages of Windcrest underwent a comprehensive inspection on November 17, 2021, resulting in four state standard violations. The facility was cited for failing to maintain required documentation in resident clinical records under the Health Code, with corrections made between December 8 and 23, 2021. Additionally, the facility failed to post necessary public notices and inspection reports as mandated by the Health Code. No Life Safety Code deficiencies were detected during this inspection. It is worth noting that a separate enforcement action was taken on October 14, 2024, with an administrative penalty of $2,250 assessed for failing to ensure resident protection from abuse, neglect, and exploitation under Texas Administrative Code (TAC) 553.267(a)(3)(E)(ii).

Health Inspection History

Inspections since 2022
Total health inspections 7

Texas average 7.4


Last Health inspection on Jul 2025

Total health citations
45 Rank #257 / 292Health citations — State benchmarkedThis home is ranked 257th out of 292 homes in Texas. Shows this facility's total health deficiency citations benchmarked to the Texas State average, with a ranking across all 292 TX SNFs. Lower citation counts earn a better rank.Click the rank badge to see the full State ranking.Click here to see the full State ranking.

Texas average 25.9

Citations per inspection
6.43 Rank #284 / 292Citations per inspection — State benchmarkedThis home is ranked 284th out of 292 homes in Texas. Shows average deficiency citations per CMS inspection for this facility versus the Texas mean across 292 SNFs with citation data. Lower is better.Click the rank badge to see the full State ranking.Click here to see the full State ranking.

Texas average 3.67


Health citations are formal notices following inspections when they fail to comply with safety and care standards.

36 of 45 citations resulted from standard inspections; and 9 of 45 resulted from complaint investigations.

Breakdown of citation severity (last 4 years)
Critical health citations
5
150% worse than Texas average

Texas average: 2


Serious health citations
0
100% better than Texas average

Texas average: 0.4

5 critical citations Texas average: 2

0 serious citations Texas average: 0.4

38 moderate citations Texas average: 23

2 minor citations Texas average: 0.4
Citations history (last 4 years)
Nursing Services minor citation Jul 10, 2025
Corrected

Pharmacy moderate citation Jul 10, 2025
Corrected

Care Planning moderate citation Jul 10, 2025
Corrected

Abuse/Neglect moderate citation Feb 12, 2025
Corrected

Staffing Data

Reporting period: October 1 – December 31, 2025 (Q4 2025). Source: CMS Payroll-Based Journal report.

Total staff 109
Employees 58
Contractors 51
Staff to resident ratio 1.82:1
23% better than Texas average
Texas average ratio: 1.48:1 Texas average ratio: 1.48:1See full Texas ranking
Avg staff/day 21
Average shift 8.7 hours
7% better than Texas average
Texas average: 8.1 hours Texas average shift: 8.1 hoursSee full Texas ranking
Total staff hours (quarter) 16,774

Nursing staff breakdown

Q4 2025 · Oct 1 – Dec 31 More info This data comes from the CMS Payroll-Based Journal report covering October 1 – December 31, 2025.
Registered Nurse

Manages medical care and health needs.

RN Staff Info 7 total: 4 full-time employees and 3 contractors. 7
Average shift length Info Average shift length. Calculated as total hours divided by days worked and average staff per day. 11.5 hours
Licensed Practical Nurse

Assists with medical care and medications.

LPN Staff Info 45 total: 9 full-time employees and 36 contractors. 45
Average shift length Info Average shift length. Calculated as total hours divided by days worked and average staff per day. 8.6 hours
Certified Nursing Assistant

Helps with daily care and mobility.

CNA Staff Info 30 total: 21 full-time employees and 9 contractors. 30
Average shift length Info Average shift length. Calculated as total hours divided by days worked and average staff per day. 9.2 hours

Contractor staffing

Q4 2025 · Oct 1 – Dec 31 More info This data comes from the CMS Payroll-Based Journal report covering October 1 – December 31, 2025.

Total hours from contractors

7.8%

1,317 contractor hours this quarter

Licensed Practical Nurse: 36 Certified Nursing Assistant: 9 Registered Nurse: 3 Medication Aide/Technician: 1 Medical Director: 1 Occupational Therapy Assistant: 1

Staff by category

Q4 2025 · Oct 1 – Dec 31 More info This data comes from the CMS Payroll-Based Journal report covering October 1 – December 31, 2025.
Certified Nursing Assistant219306,59492100%9.2
Licensed Practical Nurse936453,36092100%8.6
Registered Nurse4371,3128795%11.5
RN Director of Nursing2021,0236975%8.2
Physical Therapy Aide4048657582%7.3
Medication Aide/Technician1126445964%10.9
Physical Therapy Assistant3036006571%8.2
Administrator2025446672%8
Qualified Social Worker2025427683%7.1
Mental Health Service Worker1014926267%7.9
Dietitian2024386470%6.8
Respiratory Therapy Technician4041504549%3.3
Speech Language Pathologist2021002022%5
Nurse Practitioner101801011%8
Medical Director011261718%1.5
Occupational Therapy Assistant011422%2
30 Certified Nursing Assistant
% of Days 100%
45 Licensed Practical Nurse
% of Days 100%
7 Registered Nurse
% of Days 95%
2 RN Director of Nursing
% of Days 75%
4 Physical Therapy Aide
% of Days 82%
2 Medication Aide/Technician
% of Days 64%
3 Physical Therapy Assistant
% of Days 71%
2 Administrator
% of Days 72%
2 Qualified Social Worker
% of Days 83%
1 Mental Health Service Worker
% of Days 67%
2 Dietitian
% of Days 70%
4 Respiratory Therapy Technician
% of Days 49%
2 Speech Language Pathologist
% of Days 22%
1 Nurse Practitioner
% of Days 11%
1 Medical Director
% of Days 18%
1 Occupational Therapy Assistant
% of Days 2%

Penalties and fines

Includes penalties issued in 2024-2025

Federal penalties imposed by CMS for regulatory violations, including civil money penalties (fines) and denials of payment for new Medicare/Medicaid admissions.

Source: CMS Penalties Database (Data as of Jan 2026)

Total fines amount $94K Rank #240 / 294Federal fines — State benchmarkedThis home is ranked 240th out of 294 homes in Texas. Shows this facility's cumulative CMS federal fine dollars versus the Texas average among facilities with fines, and where it ranks among 294 skilled nursing facilities in the pool. Lower total dollars mean a better rank.Click the rank badge to see the full State ranking.Click here to see the full State ranking.
17% higher than Texas average

Texas average: $80K

Number of fines 3
21% more fines than Texas average

Texas average: 2.5

Payment Denials Info Serious action where Medicare and/or Medicaid temporarily stops payments for new residents until issues are fixed. 0
100% fewer payment denials than Texas average

Texas average: 0.2

Fines amount comparison
This facility $94K
Texas average $80K
Penalty History

Penalties are imposed by CMS for violations of federal nursing home regulations.

2 penalties in the past 3 years

Multiple penalties were reported in the last 3 years.

Civil Money Penalty Info Fines imposed for noncompliance, which can be assessed per day or per instance of violation. Jan 19, 2025
$49K
Civil Money Penalty Info Fines imposed for noncompliance, which can be assessed per day or per instance of violation. Jan 13, 2024
$14K

Last updated: Jan 2026

Quality of care over time

These measures show how residents usually do over time at this home, based on health outcomes and preventive care.

High-risk clinical events score Info A composite score based on pressure ulcers, falls with injury, weight loss, walking ability decline, and activities of daily living decline. 10.7
24% worse than Texas average

Texas average: 8.6

Functional decline score Info A composite score based on activities of daily living decline, walking ability decline, and incontinence. 20.8
29% worse than Texas average

Texas average: 16.0

Long-stay resident measures
Need for Help with Daily Activities Increased Info Percent of long-stay residents whose need for help with daily activities has increased 18.6%
15% worse than Texas average

Texas average: 16.2%

Walking Ability Worsened Info Percent of long-stay residents whose ability to move independently worsened 23.4%
44% worse than Texas average

Texas average: 16.2%

Low Risk Residents with Bowel/Bladder Incontinence Info Percent of low risk long-stay residents who lose control of their bowels or bladder 20.4%
30% worse than Texas average

Texas average: 15.7%

Falls with Major Injury Info Percent of long-stay residents experiencing one or more falls with major injury 7.1%
120% worse than Texas average

Texas average: 3.2%

High Risk Residents with Pressure Ulcers Info Percent of long-stay high risk residents with pressure ulcers 2.7%
40% better than Texas average

Texas average: 4.4%

Urinary Tract Infection Info Percent of long-stay residents with a urinary tract infection 0.6%
31% better than Texas average

Texas average: 0.8%

Lost Too Much Weight Info Percent of long-stay residents who lose too much weight 1.9%
44% better than Texas average

Texas average: 3.5%

Depressive Symptoms Info Percent of long-stay residents who have depressive symptoms 1.2%
60% better than Texas average

Texas average: 2.9%

Antipsychotic Use Info Percent of long-stay residents who received an antipsychotic medication 5.6%
29% better than Texas average

Texas average: 7.9%

Pneumococcal Vaccine Info Percent of long-stay residents assessed and appropriately given the pneumococcal vaccine 98.9%
In line with Texas average

Texas average: 97.3%

Influenza Vaccine Info Percent of long-stay residents assessed and appropriately given the seasonal influenza vaccine 100.0%
In line with Texas average

Texas average: 97.9%

Short-stay resident measures
Pneumococcal Vaccine Info Percent of short-stay residents assessed and appropriately given the pneumococcal vaccine 75.7%
16% worse than Texas average

Texas average: 90.4%

Antipsychotic medication increase Info Percent of short-stay residents who newly received an antipsychotic medication 0.0%
100% better than Texas average

Texas average: 1.4%

Influenza Vaccine Info Percent of short-stay residents assessed and appropriately given the seasonal influenza vaccine 71.1%
19% worse than Texas average

Texas average: 88.0%

Breakdown by payment type

Medicare

35% of new residents, usually for short-term rehab.

Typical stay 3 - 4 months

Private pay

43% of new residents, often for short stays.

Typical stay 6 - 7 months

Medicaid

22% of new residents, often for long-term daily care.

Typical stay 1 years

Facility Characteristics

Source: CMS Long-Term Care Facility Characteristics (Data as of Jan 2026)

Total residents 60
Medicare
19
31.7% of residents
Medicaid
24
40% of residents
Private pay or other
17
28.3% of residents
Programs & Services
Residents Group

Residents meet regularly to discuss policies, care quality, and activities

Active Resident Council

Organized group of residents that meets regularly to discuss facility policies, quality of life, and activities.

Finances and operations

Governmental community
Operated by state authorities.
Home revenue
$15.9M
Surplus of revenue
$2.4M
Governmental community Operated by state authorities.
Home revenue
$15.9M Rank #54 / 297Revenue — State benchmarkedThis home is ranked 54th out of 297 homes in Texas. Shows this facility's annual revenue compared to the Texas SNF average. Higher revenue generally means more resources for staffing and capital — read alongside Payroll %.Click the rank badge to see the full State ranking.Click here to see the full State ranking.
Surplus of revenue
$2.4M
Payroll costs Info The portion of the home's budget spent on staff, including nurses, caregivers, and other employees who support care and operations. Rank #148 / 297Payroll — State benchmarkedThis home is ranked 148th out of 297 homes in Texas. Shows total annual staff payroll benchmarked to the Texas average. Higher payroll investment relative to peers often signals better staffing and less reliance on cheaper contract labor.Click the rank badge to see the full State ranking.Click here to see the full State ranking.
$5.0M
31.4% of revenue Rank #281 / 297Payroll % — State benchmarkedThis home is ranked 281st out of 297 homes in Texas. Shows payroll as a percentage of revenue versus the Texas average. Well-run Texas SNFs typically land around 51–63% — the top third Statewide. Below 25% may signal understaffing or heavy agency use — read with Staffing ratings.Click the rank badge to see the full State ranking.Click here to see the full State ranking.
Other operating costs Info All remaining costs needed to run the home, such as food, utilities, building maintenance, supplies and administrative expenses.
$8.5M
Total costs $13.4M

What does this home offer?

Minimum age icon
Minimum age icon

Minimum Age: 55 Years Old

Housing options icon

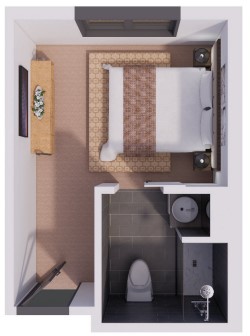
Housing Options: Studio / 1 Bed / 2 Bed / Private Suite

Building type icon
Building type icon

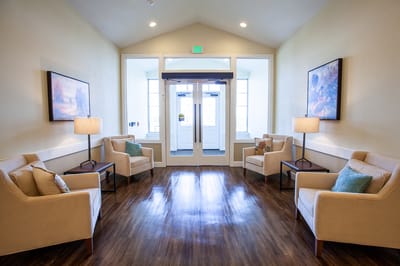
Building Type: 2-story

Dining services icon

Dining Services

Beauty services icon

Beauty Services

Transportation services icon

Transportation Services

Housekeeping icon
Housekeeping icon

Housekeeping Services

Recreational activities icon

Recreational Activities

Exercise program icon

Exercise Programs

Who this home usually serves

TYPE OF STAY

Mix of rehab and long-term care

This home supports both short-term rehab and long-term care, with residents staying for a wide range of durations.

Living Spaces & Floor Plans for The Villages of Windcrest

The Villages Of Windcrest3
The Villages Of Windcrest2
The Villages Of Windcrest1
The Villages Of Windcrest

Places of interest near The Villages of Windcrest

Address 1.4 miles from city center Info Estimated distance in miles from Fredericksburg's city center to The Villages of Windcrest's address, calculated via Google Maps.

Calculate Travel Distance to The Villages of Windcrest

Add your location

Address

Financial Assistance for
Nursing Home in Texas

The Villages of Windcrest is located in Fredericksburg, Texas.
Here are the financial assistance programs available to residents in Texas.

Get Financial aid guidance

Community Care for the Aged and Disabled (CCAD)

TX Medicaid CCAD

Age 65+ or disabled
General Texas resident, Medicaid-eligible, care need (not always nursing home level).
Income Limits (2025) ~$2,829/month 300% FBR, individual
Asset Limits $2,000 (individual), $3,000 (couple).
TX

Large state; rural access challenges.

Benefits
Personal care (5-7 hours/day) Respite (240 hours/year) Adult day care (~$60/day) Home aides

Texas Community Care Services

TX CCS

Age 60+
General Texas resident, at risk of decline.
Income Limits ~$2,000/month individual, varies
Asset Limits $5,000 individual
TX

Limited funding; high demand in urban areas.

Benefits
In-home care (3-5 hours/week) Respite (up to 10 days/year) Transportation (~5 trips/month)

Area Agency on Aging (AAA) Services

Texas AAA Services

Age 60+
General TX resident; no income/asset limits.
Income Limits (2025) None; donations encouraged.
Asset Limits Not assessed.
TX

28 AAAs; includes Meals on Wheels in some areas.

Benefits
Meals (~$5-$7/meal) Transportation Homemaker services (~4 hours/week) Respite (~5 days/year) Legal aid

Medicare Savings Program (MSP)

Texas Medicare Savings Program

Age 65+ or disabled
General TX resident, Medicare Part A/B.
Income Limits (2025) ~$2,510/month (QMB), ~$3,380/month (SLMB), ~$3,598/month (QI)—individual.
Asset Limits $9,430 (individual), $14,130 (couple).
TX

Includes Extra Help for Part D; no waitlist.

Benefits
Covers Part B premiums ($174.70/month) Deductibles ($240/year) Copays (~20%)

Family Caregiver Support Program (FCSP)

Texas Family Caregiver Support Program

Age
General Caregivers of 60+ needing care or 55+ caregivers of others; TX resident; 2+ ADLs.
Income Limits (2025) No strict cap; prioritizes low-income ~$24,980/year
Asset Limits Not assessed.
TX

High rural demand; includes grandparent caregivers.

Benefits
Respite (4-6 hours/week or 5 days/year) Adult day care ($60/day) Training Supplies (~$500/year)

VA Aid and Attendance (A&A) and Housebound Benefits

Texas VA Aid and Attendance/Housebound

Age 65+ or disabled veteran/spouse
General TX resident, wartime service, ADL help (A&A) or homebound.
Income Limits (2025) Net income < ~$1,984/month (veteran with dependent, A&A); pension offsets income.
Asset Limits ~$155,356 net worth
TX

High veteran population; supports rural/urban needs.

Benefits
Cash (~$1,433-$2,642/month veteran, ~$951-$1,318 spouse) for care costs

Property Tax Exemption for Seniors

Texas Senior Property Tax Exemption

Age 65+
General TX resident, homeowner (homestead).
Income Limits (2025) None; tax-based eligibility.
Asset Limits Not assessed.
TX

$25,000+ exemption; optional freeze in some counties; saves ~$500-$1,000/year.

Benefits
Tax exemption or freeze (~$500-$1,000/year savings)

Senior Farmers’ Market Nutrition Program (SFMNP)

Texas SFMNP

Age 60+
General TX resident, low-income.
Income Limits (2025) ~$2,322/month 185% FPL
Asset Limits Not assessed.
TX

Vouchers (~$50/season); serves ~20,000 via 28 AAAs.

Benefits
Vouchers (~$50/season) for produce at farmers’ markets

Frequently Asked Questions about The Villages of Windcrest

Who is the owner of The Villages of Windcrest?

The legal owner and operator of The Villages of Windcrest is Acron Windcrest Village Llc.

Is The Villages of Windcrest in a walkable area?

The Villages of Windcrest has a walk score of 13. Car-dependent. Most errands require a car, with limited nearby walkable options.

What is the license number of The Villages of Windcrest?

According to TX state health department records, The Villages of Windcrest's license number is 307312.

When does The Villages of Windcrest's license expire?

According to TX state health department records, The Villages of Windcrest's license expires on September 5, 2028.

Who is the administrator of The Villages of Windcrest?

Mr. Kraig A Turpen is the administrator of The Villages of Windcrest.

How many beds does The Villages of Windcrest have?

The Villages of Windcrest has 86 beds.

Has The Villages of Windcrest had any recent deficiencies or citations?

The Villages of Windcrest has had 4 recently reported deficiencies.

More homes from the same operator

Guides for Better Senior Living

Care Cost Calculator: See Prices in Your Area

Nursing Home Data Explorer

Don’t Wait Too Long: 7 Red Flag Signs Your Parent Needs Assisted Living Now

The True Cost of Assisted Living in 2025 – And How Families Are Paying For It

Understanding Senior Living Costs: Pricing Models, Discounts & Financial Assistance

Explore Open Rooms
1 Contact details
2 What type of senior care service are you looking for?
3 What budget do you have in mind for senior care?
4 How soon do you need to find care?
5 Additional details

Thank you for your interest!

Our team will be in touch shortly to help with next steps.