• Home
  • Nursing Home in New Jersey
Total Rehab at Moorestown
Nursing Home, Palliative Care & Respite Care · Moorestown, NJ
CMS overall rating Info CMS (the Centers for Medicare & Medicaid Services) is the federal agency that rates nursing home quality. Its Overall Rating runs from 1 to 5 stars, combining health inspections, staffing, and quality measures, with inspections weighted most heavily.
  • Home
  • USA
  • Nursing Home in New Jersey

Total Rehab at Moorestown

Nursing Home, Palliative Care & Respite Care · Moorestown, NJ
CMS overall rating Info CMS (the Centers for Medicare & Medicaid Services) is the federal agency that rates nursing home quality. Its Overall Rating runs from 1 to 5 stars, combining health inspections, staffing, and quality measures, with inspections weighted most heavily.
Calculator: See prices in your area
Total Rehab at Moorestown accepts Medicare and private pay.

Overview of Total Rehab at Moorestown

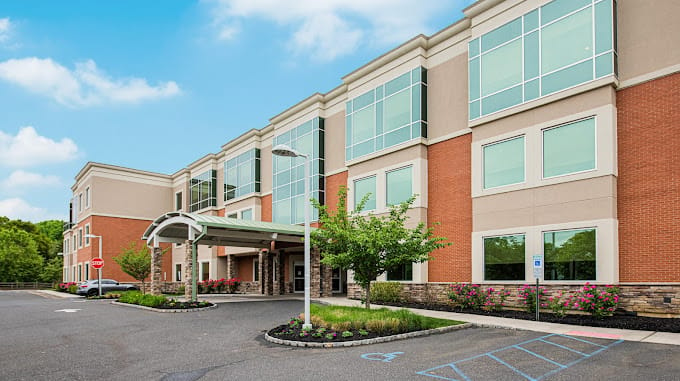
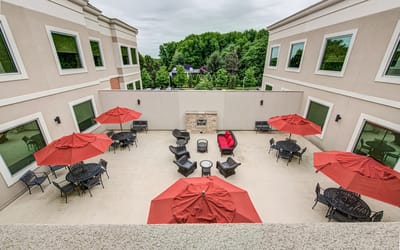
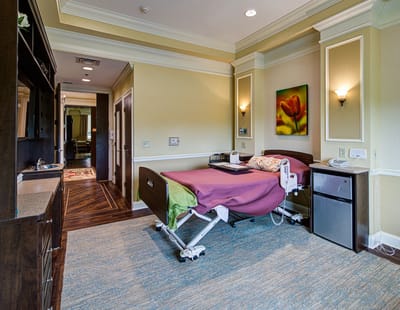
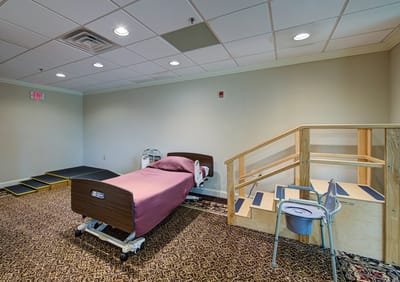
Enjoy a hotel-like recovery experience at Total Rehab at Moorestown, a state-of-the-art community in Moorestown, NJ, offering comprehensive recovery and medical services. The community provides coordinated, individualized care, incorporating various services, including physical, occupational, and speech therapies, wound care & pain management, respite and palliative care, and other specialized services. A team of highly skilled professionals works closely with seniors and their families to create a regimen that perfectly aligns with their needs.

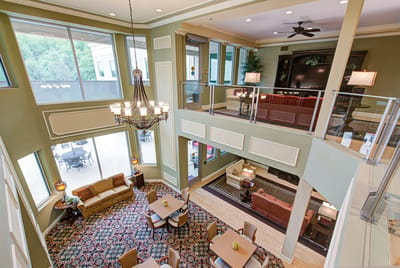
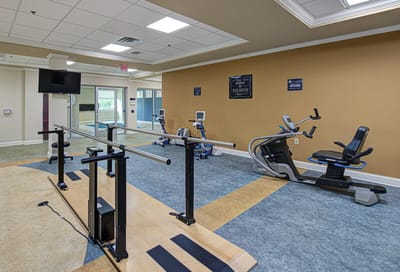
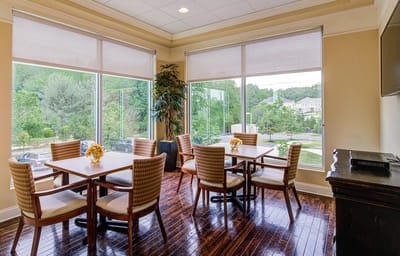
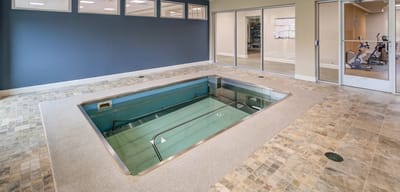
Committed to delivering an exceptional recovery experience in a hotel-like environment, Total Rehab features 124 beautifully appointed suites designed to provide optimum functionality and comfort. Residents enjoy using state-of-the-art, modality-based therapy equipment and a broad range of amenities for their wellness and enjoyment. Amenities include an immersive movie theater, advanced gym, salon and spa services, elegant lounge areas for socialization and relaxation, and various religious, educational, cultural, and social activities to keep residents engaged and entertained.

Quality ratings

Measured by Centers for Medicare & Medicaid Services (CMS)

Overall rating Info The Overall CMS Rating combines results from health inspections, staffing levels and quality measures. Health inspections carry the most weight. Staffing and quality scores can increase or decrease the final rating based on performance compared to state and national standards.
Health Inspection Info Based on the results of the facility's three most recent standard inspections and any complaint investigations. CMS reviews the number, scope, and severity of deficiencies, with more recent findings weighted more heavily.
Staffing Info Measures average nursing staff hours per resident per day, including Registered Nurses (RNs) and total nursing staff. Ratings are adjusted based on the level of care residents require and are compared to state and national benchmarks.
Quality Measures Info Based on clinical and physical health indicators reported to CMS, such as hospital readmissions, falls, pressure ulcers, and improvements in mobility. These measures reflect how well residents' health needs are being managed.

Staffing hours breakdown

Info Daily nursing hours per resident by staff type, reported to CMS. Higher is generally better — compare this facility to state and national averages to see where staffing stands.

Hours per resident per day — compared to state averages

Total nursing care / resident Info Total adjusted nursing hours per resident per day, combining RN, LPN, and aide time. CMS adjusts this for case-mix so facilities can be fairly compared.
2h 52m per day
Rank #279 / 294Nurse hours — State benchmarkedThis home is ranked 279th out of 294 homes in New Jersey. Shows adjusted nurse hours per resident per day benchmarked to the New Jersey average, with a ranking across 294 New Jersey facilities. More hours mean more direct care. The national average is about 3.5 hrs; below 3.0 is a red flag.Rankings are based only on facilities in New Jersey that report data for that category. Facilities without available data are excluded from the ranking.Click the rank badge to see the full State ranking.Click here to see the full State ranking.
vs avg

1 of 6 metrics below state avg

Standout metric LPN / LVN is +59% above state avg
Staff typeHours / Day / Residentvs state avg
Registered Nurse (RN) Info RNs hold the highest nursing license and can assess residents, interpret test results, and direct care plans. More RN hours per day often signals stronger clinical oversight and faster response to health changes. 1h 3m per day ▲ 53% State avg: 41m per day · National avg: 41m per day
LPN / LVN Info Licensed Practical Nurses (LPNs) or Licensed Vocational Nurses (LVNs) deliver routine hands-on care — medication administration, wound dressing, and monitoring vital signs. They work under RN supervision and make up a large share of daily bedside care. 1h 29m per day ▲ 59% State avg: 56m per day · National avg: 52m per day
Nurse Aide Info Certified Nurse Aides (CNAs) provide the most direct day-to-day assistance: bathing, dressing, feeding, and mobility. Nurse aide hours are typically the largest staffing category and directly affect residents' quality of life. 1h 59m per day ▼ 11% State avg: 2h 14m per day · National avg: 2h 21m per day
Weekend Total Nursing Info Combined nursing hours (RN + LPN + Nurse Aide) per resident per day on weekends. Staffing often drops on weekends — this figure reveals whether the facility maintains adequate coverage outside of weekday hours. 3h 59m per day ▲ 15% State avg: 3h 27m per day · National avg: 3h 26m per day
Physical Therapist Info Hours per resident per day provided by licensed Physical Therapists (PTs) or PT Assistants. PT services help residents recover mobility after injury or illness and are especially important for post-acute (short-stay) rehabilitation. 8m per day ▲ 32% State avg: 6m per day · National avg: 4m per day
Weekend RN Info Registered nurse hours specifically on weekends. Facilities sometimes reduce RN presence on Saturdays and Sundays — a low weekend RN figure compared to weekday hours can indicate reduced clinical oversight when most administrative staff are absent. 43m per day ▲ 48% State avg: 29m per day · National avg: 29m per day

Capacity and availability

Avg. Length of Stay
24 days
Bed community size
124-bed community Rank #219 / 561Bed count — State benchmarkedThis home is ranked 219th out of 561 homes in New Jersey. Shows this facility's certified or reported bed count compared to other New Jersey facilities. Larger communities may offer more amenities, programs, and on-site services for residents and families.Rankings are based only on facilities in New Jersey that report data for that category. Facilities without available data are excluded from the ranking.Click the rank badge to see the full State ranking.Click here to see the full State ranking.
A larger shared setting that may offer more common spaces and organized community services.
Walk Score
Walk Score: 39 / 100 Rank #368 / 640Walk Score — State benchmarkedThis home is ranked 368th out of 640 homes in New Jersey. Shows how walkable this facility's neighborhood is compared to the average Walk Score across New Jersey facilities. Higher scores benefit residents, families, and staff.Rankings are based only on facilities in New Jersey that report data for that category. Facilities without available data are excluded from the ranking.Click the rank badge to see the full State ranking.Click here to see the full State ranking.
Somewhat walkable. A few nearby services may be reachable on foot, but most trips require transportation.

About this community

License Details

Facility TypeLong Term Care Facility
StatusActive
ExpirationDecember 31, 2026
License Number03009

Ownership & Operating Entity

Total Rehab at Moorestown is legally operated by Total Rehab Moorestown, and administered by Mr. Meir Landau.

Officers

Info Officers are individuals or entities with formal legal or financial responsibility for the organization that owns this facility

Boruch Mermelstein, Dov Green

Type Of Units

Long Term Care
124 units
Total beds
124 units

Contact Total Rehab at Moorestown

Inspection History

In New Jersey, the Department of Health, Health Facilities Evaluation and Licensing conducts mandatory unannounced surveys to ensure facilities provide safe and effective resident care.

Inspection Scorecard Info This scorecard compares key inspection, deficiency, and complaint metrics at this facility against the New Jersey state average. Metrics rated ≥15% worse than average are highlighted in red; those ≥15% better are highlighted in green.

Since 2020 vs. New Jersey state average
Overall vs. NJ average 4 Worse Metrics worse than New Jersey average:
• Total deficiencies (183% above)
• Deficiencies per year (183% above)
• Deficiencies per inspection (95% above)
• Total inspections (44% above)
1 At Avg Metrics at New Jersey average:
• Complaint investigations (at NJ avg)
0 Better No metrics in this bucket.
Latest Inspection January 2, 2026 Complaint Investigation

Deficiencies Info Deficiencies are formal regulatory issues recorded during state inspections.

This FacilityNJ Averagevs. NJ Avg
Total deficiencies Info Formal regulatory issues recorded by inspectors across all inspection types. 5118 This facility has 183% more total deficiencies than a typical New Jersey assisted living residence (51 vs. NJ avg 18).↑ 183% worse
Deficiencies per year Info Average deficiencies per year since 2020. 8.53 This facility has 183% more deficiencies per year than a typical New Jersey assisted living residence (8.5 vs. NJ avg 3).↑ 183% worse
Deficiencies per inspection Info Average deficiencies per inspection. 3.92 This facility has 95% more deficiencies per inspection than a typical New Jersey assisted living residence (3.9 vs. NJ avg 2).↑ 95% worse

Inspections Info State inspections evaluate whether the facility meets health and safety standards.

This FacilityNJ Averagevs. NJ Avg
Total inspections Info Combined count of all routine and focused inspections. Excludes complaint investigations. 139 This facility has 44% more total inspections than a typical New Jersey assisted living residence (13 vs. NJ avg 9).↑ 44% worse
Complaint investigations Info On-site investigations triggered by complaints filed with New Jersey regulators. 33 This facility has complaint investigations in line with the New Jersey average (3 vs. NJ avg 3).— At avg

Inspection Reports Summary Info An editor-reviewed summary of the themes and findings across this facility's recent inspection reports.

  • The most recent inspection on January 2, 2026 found one deficiency for failing to implement adequate fall prevention measures for a high-risk resident.
  • The April 17, 2025 annual survey cited 12 deficiencies including immediate jeopardy for failure to follow therapeutic diet orders and widespread issues with infection control, medication, and safety.
  • Multiple complaint investigations from 2023 to 2025 documented substantiated findings of inadequate staffing ratios, medication errors, and poor personal hygiene care.

Health Inspection History

Inspections since 2019
Total health inspections 4

State average N/A


Last Health inspection on Dec 2023

Total health citations
13 Rank #66 / 296Health citations — State benchmarkedThis home is ranked 66th out of 296 homes in New Jersey. Shows this facility's total health deficiency citations benchmarked to the New Jersey State average, with a ranking across all 296 NJ facilities. Lower citation counts earn a better rank.Rankings are based only on facilities in New Jersey that report data for that category. Facilities without available data are excluded from the ranking.Click the rank badge to see the full State ranking.Click here to see the full State ranking.

State average N/A

Citations per inspection
3.25 Rank #59 / 296Citations per inspection — State benchmarkedThis home is ranked 59th out of 296 homes in New Jersey. Shows average deficiency citations per CMS inspection for this facility versus the New Jersey mean across 296 facilities with citation data. Lower is better.Rankings are based only on facilities in New Jersey that report data for that category. Facilities without available data are excluded from the ranking.Click the rank badge to see the full State ranking.Click here to see the full State ranking.

State average N/A


Health citations are formal notices following inspections when they fail to comply with safety and care standards.

10 of 13 citations resulted from standard inspections; 2 of 13 resulted from complaint investigations; and 1 of 13 came from combined inspections (standard and complaint).

Breakdown of citation severity (last 7 years)
Critical health citations
0
In line with State average

State average: N/A


Serious health citations
0
In line with State average

State average: N/A

0 critical citations State average: N/A

0 serious citations State average: N/A

12 moderate citations State average: N/A

1 minor citation State average: N/A
Citations history (last 7 years)
Administration minor citation Dec 08, 2023
Corrected

Infection Control moderate citation Dec 08, 2023
Corrected

Pharmacy moderate citation Dec 08, 2023
Corrected

Pharmacy moderate citation Dec 08, 2023
Corrected

Staffing Data

Reporting period: October 1 – December 31, 2025 (Q4 2025). Source: CMS Payroll-Based Journal report.

Total staff 238
Employees 185
Contractors 53
Staff to resident ratio 1.95 : 1
0% compared with State average

State average ratio: 0 : 0

Avg staff/day 91
Average shift 8 hours
0% compared with State average

State average: 0 hours

Total staff hours (quarter) 67,068

Nursing staff breakdown

Q4 2025 · Oct 1 – Dec 31 More info This data comes from the CMS Payroll-Based Journal report covering October 1 – December 31, 2025.
Registered Nurse

Manages medical care and health needs.

RN Staff Info All 28 RN Staff are full-time employees. No contractors work on this role. 28
Average shift length Info Average shift length. Calculated as total hours divided by days worked and average staff per day. 9 hours
Licensed Practical Nurse

Assists with medical care and medications.

LPN Staff Info All 48 LPN Staff are full-time employees. No contractors work on this role. 48
Average shift length Info Average shift length. Calculated as total hours divided by days worked and average staff per day. 9.2 hours
Certified Nursing Assistant

Helps with daily care and mobility.

CNA Staff Info All 79 CNA Staff are full-time employees. No contractors work on this role. 79
Average shift length Info Average shift length. Calculated as total hours divided by days worked and average staff per day. 7.4 hours

Contractor staffing

Q4 2025 · Oct 1 – Dec 31 More info This data comes from the CMS Payroll-Based Journal report covering October 1 – December 31, 2025.

Total hours from contractors

16.3%

10,921 contractor hours this quarter

Physical Therapy Assistant: 12 Respiratory Therapy Technician: 11 Speech Language Pathologist: 9 Qualified Social Worker: 9 Physical Therapy Aide: 7 Occupational Therapy Aide: 2 Medical Director: 1 Feeding Assistant: 1 Occupational Therapy Assistant: 1

Staff by category

Q4 2025 · Oct 1 – Dec 31 More info This data comes from the CMS Payroll-Based Journal report covering October 1 – December 31, 2025.
Certified Nursing Assistant7907922,43092100%7.4
Licensed Practical Nurse4804816,83192100%9.2
Registered Nurse280288,43192100%9
Clinical Nurse Specialist100102,8797582%8
Other Dietary Services Staff130132,52992100%7
Physical Therapy Aide0772,3588289%7.2
Physical Therapy Assistant012122,3118997%7.5
Speech Language Pathologist0992,2748997%7.4
Respiratory Therapy Technician011111,4898795%7.2
Dental Services Staff3031,1428390%7.6
Qualified Social Worker0999837480%7.8
Occupational Therapy Aide0227445358%8
Nurse Practitioner1015536368%8.8
Feeding Assistant0115286672%8
Dietitian1014856267%7.8
Administrator1014645863%8
Mental Health Service Worker1014045155%7.9
Medical Director0111302628%5
Occupational Therapy Assistant0111041314%8
79 Certified Nursing Assistant
% of Days 100%
48 Licensed Practical Nurse
% of Days 100%
28 Registered Nurse
% of Days 100%
10 Clinical Nurse Specialist
% of Days 82%
13 Other Dietary Services Staff
% of Days 100%
7 Physical Therapy Aide
% of Days 89%
12 Physical Therapy Assistant
% of Days 97%
9 Speech Language Pathologist
% of Days 97%
11 Respiratory Therapy Technician
% of Days 95%
3 Dental Services Staff
% of Days 90%
9 Qualified Social Worker
% of Days 80%
2 Occupational Therapy Aide
% of Days 58%
1 Nurse Practitioner
% of Days 68%
1 Feeding Assistant
% of Days 72%
1 Dietitian
% of Days 67%
1 Administrator
% of Days 63%
1 Mental Health Service Worker
% of Days 55%
1 Medical Director
% of Days 28%
1 Occupational Therapy Assistant
% of Days 14%

Penalties and fines

Federal penalties imposed by CMS for regulatory violations, including civil money penalties (fines) and denials of payment for new Medicare/Medicaid admissions.

Source: CMS Penalties Database

No penalties in the past 3 years

No civil money penalties or payment denials were reported in the last 3 years.

Quality of care over time

These measures show how residents usually do over time at this home, based on health outcomes and preventive care.

High-risk clinical events score Info A composite score based on pressure ulcers, falls with injury, weight loss, walking ability decline, and activities of daily living decline. 6.9
In line with State average

State average: 6.8

Functional decline score Info A composite score based on activities of daily living decline, walking ability decline, and incontinence. 14.5
17% worse than State average

State average: 12.4

Long-stay resident measures
Above average Info CMS star rating based on long-stay quality measure performance. 5 stars = significantly above average, 1 star = significantly below average.
Need for Help with Daily Activities Increased Info Percent of long-stay residents whose need for help with daily activities has increased 13.6%
36% worse than State average

State average: 10.1%

Low Risk Residents with Bowel/Bladder Incontinence Info Percent of low risk long-stay residents who lose control of their bowels or bladder 15.4%
In line with State average

State average: 16.0%

Falls with Major Injury Info Percent of long-stay residents experiencing one or more falls with major injury 0.0%
100% better than State average

State average: 2.4%

High Risk Residents with Pressure Ulcers Info Percent of long-stay high risk residents with pressure ulcers 9.0%
47% worse than State average

State average: 6.1%

Urinary Tract Infection Info Percent of long-stay residents with a urinary tract infection 9.5%
890% worse than State average

State average: 1.0%

Lost Too Much Weight Info Percent of long-stay residents who lose too much weight 5.0%
8% worse than State average

State average: 4.6%

Depressive Symptoms Info Percent of long-stay residents who have depressive symptoms 65.0%
476% worse than State average

State average: 11.3%

Antipsychotic Use Info Percent of long-stay residents who received an antipsychotic medication 4.4%
61% better than State average

State average: 11.1%

Pneumococcal Vaccine Info Percent of long-stay residents assessed and appropriately given the pneumococcal vaccine 100.0%
8% better than State average

State average: 93.0%

Short-stay resident measures
Significantly above average Info CMS star rating based on short-stay quality measure performance. 5 stars = much above average, 1 star = much below average.
Pneumococcal Vaccine Info Percent of short-stay residents assessed and appropriately given the pneumococcal vaccine 99.6%
26% better than State average

State average: 78.9%

Antipsychotic medication increase Info Percent of short-stay residents who newly received an antipsychotic medication 0.3%
75% better than State average

State average: 1.2%

Influenza Vaccine Info Percent of short-stay residents assessed and appropriately given the seasonal influenza vaccine 98.6%
23% better than State average

State average: 80.1%

Re-hospitalized after SNF stay Info Percentage of short-stay residents who were re-hospitalized after their nursing home admission. 27.2%
7% worse than State average

State average: 25.4%

Emergency department visits Info Percentage of short-stay residents who had an outpatient emergency department visit. 9.1%
11% worse than State average

State average: 8.2%

Falls with major injury Info Percentage of SNF residents who experience falls with major injury during their stay. 0.8%
9% worse than State average

State average: 0.8%

Ability to care for self at discharge Info Percentage of residents at or above expected ability to care for themselves at discharge. 67.2%
25% better than State average

State average: 53.7%

Successful return to home or community Info Rate of successful return to home or community from a skilled nursing facility. 62.9%
24% better than State average

State average: 50.6%

Breakdown by payment type

Medicare

51% of new residents, usually for short-term rehab.

Typical stay 29 days

Private pay

49% of new residents, often for short stays.

Typical stay 18 days

Facility Characteristics

Source: CMS Long-Term Care Facility Characteristics (Data as of Jan 2026)

Total residents 122
Medicare
120
98.4% of residents
Private pay or other
2
1.6% of residents
Programs & Services
Residents Group

Residents meet regularly to discuss policies, care quality, and activities

Active Resident Council

Organized group of residents that meets regularly to discuss facility policies, quality of life, and activities.

Finances and operations

Based on CMS SNF Cost Report for fiscal year ending in 01/2024.

For-profit
Operated by a single business entity.
Net patient revenue Info Net patient revenue — what the home actually collects for resident care, after contractual allowances, bad debt and discounts are subtracted from its gross charges (CMS cost report, Worksheet G-3). It covers resident care only; money the home earns from other sources is shown separately as "Other income."
$23.9M
Net patient income Info Net patient income: net patient revenue minus the home's total operating expenses. A positive figure means it earns more from resident care than it spends to deliver it; a negative figure means the opposite. It excludes non-operating "other income."
-$419.7K
For-profit Operated by a single business entity.
Net patient revenue Info Net patient revenue — what the home actually collects for resident care, after contractual allowances, bad debt and discounts are subtracted from its gross charges (CMS cost report, Worksheet G-3). It covers resident care only; money the home earns from other sources is shown separately as "Other income."
$23.9M Rank #40 / 292Revenue — State benchmarkedThis home is ranked 40th out of 292 homes in New Jersey. Shows this facility's annual revenue compared to the New Jersey average. Higher revenue generally means more resources for staffing and capital — read alongside Payroll %.Rankings are based only on facilities in New Jersey that report data for that category. Facilities without available data are excluded from the ranking.Click the rank badge to see the full State ranking.Click here to see the full State ranking.
Net patient income Info Net patient income: net patient revenue minus the home's total operating expenses. A positive figure means it earns more from resident care than it spends to deliver it; a negative figure means the opposite. It excludes non-operating "other income."
-$419.7K
Other income Info Money the home earns outside of resident care — such as investments, grants, rentals and other non-operating sources (CMS cost report, Worksheet G-3). It is tracked separately from net patient revenue: it is not part of that figure, and it is not included in net patient income.
$291.1K
Payroll costs Info Staff salaries plus wage-related costs — benefits such as payroll taxes, health insurance and retirement — from the home's own accounting records (CMS cost report, Worksheet A). Contract or agency labor is counted separately, under other operating costs. Rank #55 / 292Payroll — State benchmarkedThis home is ranked 55th out of 292 homes in New Jersey. Shows total annual staff payroll benchmarked to the New Jersey average. Higher payroll investment relative to peers often signals better staffing and less reliance on cheaper contract labor.Rankings are based only on facilities in New Jersey that report data for that category. Facilities without available data are excluded from the ranking.Click the rank badge to see the full State ranking.Click here to see the full State ranking.
$9.1M 38.1% of net patient revenue Info Payroll as a share of revenue: staff salaries and wage-related benefits divided by net patient revenue. A higher figure means more of each revenue dollar goes to staff pay. Rank #230 / 292Payroll % — State benchmarkedThis home is ranked 230th out of 292 homes in New Jersey. Shows payroll as a percentage of revenue versus the New Jersey average. Well-run New Jersey facilities typically land around 55–65% — the top third Statewide. Below 25% may signal understaffing or heavy agency use — read with Staffing ratings.Rankings are based only on facilities in New Jersey that report data for that category. Facilities without available data are excluded from the ranking.Click the rank badge to see the full State ranking.Click here to see the full State ranking.
Other operating costs Info Everything it costs to run the home apart from payroll — food, utilities, supplies, maintenance, contract labor and administration. Calculated as total operating expense minus payroll (staff salaries and wage-related benefits).
$15.2M
Total costs Info The home's total operating expense for the year — all the costs of running it, salaries included (CMS cost report, Worksheet G-3).
$24.3M

Who this home usually serves

TYPE OF STAY

Mostly short-term rehab stays

Most residents typically stay for a few weeks or months before returning home or moving on.

Most new residents arrive under Medicare (51% of admissions), and a typical Medicare stay runs around 29 days.

Admissions
1,570 total

Coverage residents most often arrive under.

Medicare 51%
Private pay 49%
Discharges
1,543 total

Coverage residents most often leave under.

Medicare 50%
Private pay 50%

Places of interest near Total Rehab at Moorestown

Address 1.6 miles from city center Info Estimated distance in miles from Moorestown's city center to Total Rehab at Moorestown's address, calculated via Google Maps. — 6.8 miles to nearest hospital (Virtua Mount Holly Hospital)

Calculate Travel Distance to Total Rehab at Moorestown

Add your location

Address

Compare Nursing Homes around the area

The information below is reported by the New Jersey Department of Health, Health Facilities Evaluation and Licensing.

Total Rehab at Moorestown
NH
PC
RC
Moorestown (Marter Avenue) -124 - 39 -
Brighton Gardens of Edison
NH
AL
HC
MC
Edison (Oak Tree Road) -118 A+ 64 Studio / 1 Bed
Fellowship Village
NH
AL
HC
IL
MC
Basking Ridge -67 - 25 Studio / 1 Bed / 2 Bed
Peace Care St. Ann’s
NH
ADC
Jersey City (Greenville) -120 - 86 Private / Semi-Private Rooms
Anchor Care & Rehabilitation Center
NH
Hazlet (3325) -170 - 69 1 Bed / 2 Bed

Frequently Asked Questions about Total Rehab at Moorestown

What neighborhood is Total Rehab at Moorestown in?

Total Rehab at Moorestown is in the Marter Avenue neighborhood of Moorestown.

Who is the owner of Total Rehab at Moorestown?

Total Rehab at Moorestown is legally operated by Total Rehab Moorestown, and administered by Mr. Meir Landau.

Is Total Rehab at Moorestown in a walkable area?

Total Rehab at Moorestown has a walk score of 39. Somewhat walkable. A few nearby services may be reachable on foot, but most trips require transportation.

What is the license number of Total Rehab at Moorestown?

According to NJ state health department records, Total Rehab at Moorestown's license number is 03009.

When does Total Rehab at Moorestown's license expire?

According to NJ state health department records, Total Rehab at Moorestown's license expires on December 31, 2026.

What is the occupancy rate at Total Rehab at Moorestown?

Total Rehab at Moorestown's occupancy is 80.4%.

Does Total Rehab at Moorestown operate as a for-profit or non-profit?

Total Rehab at Moorestown is registered as a for-profit in NJ.

Guides for Better Senior Living

Care Cost Calculator: See Prices in Your Area

Nursing Home Data Explorer

Don’t Wait Too Long: 7 Red Flag Signs Your Parent Needs Assisted Living Now

The True Cost of Assisted Living in 2025 – And How Families Are Paying For It

Understanding Senior Living Costs: Pricing Models, Discounts & Financial Assistance