


Total health inspections
6
Texas average 7.4
Last Health inspection on Mar 2025
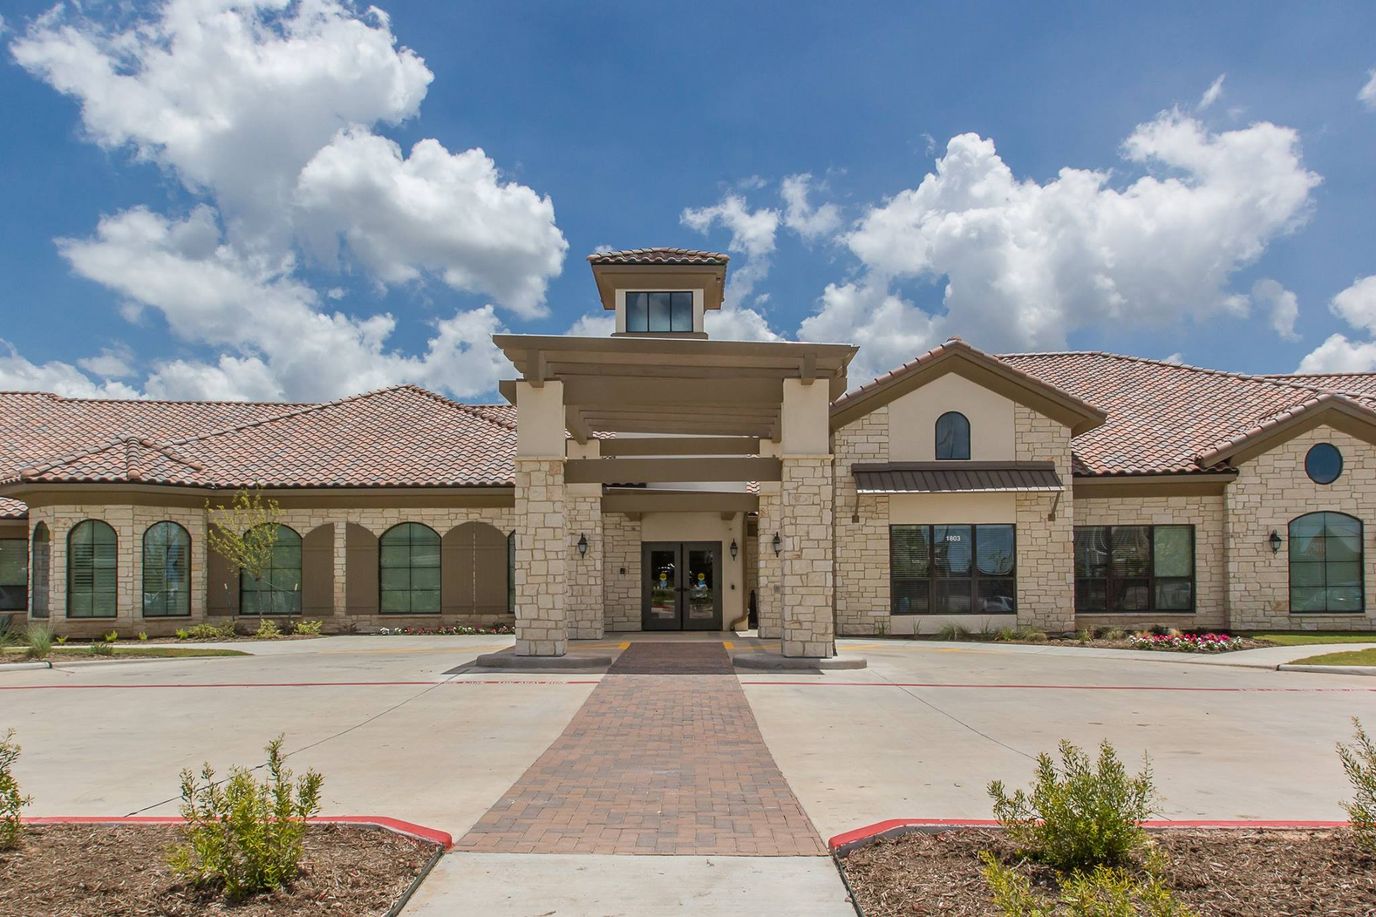
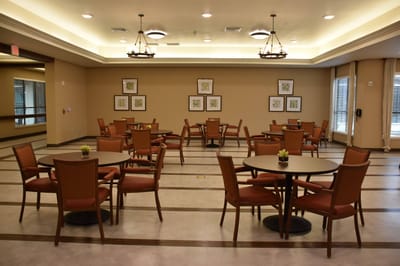
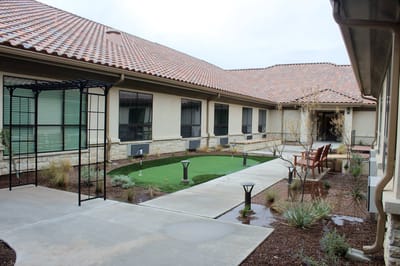
VibraLife Senior Living and Memory Care, located in El Paso, TX, is a senior living community offering assisted living and memory care services to its residents in need of assistance with daily living activities, especially those living with Alzheimer’s and other forms of dementia. As part of their services, they assist residents with regular daily living activities such as bathing or toileting. Additionally, the staff are available 24/7 for supervision, medication management, or for providing specific care needs.
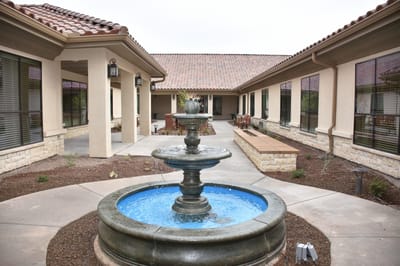
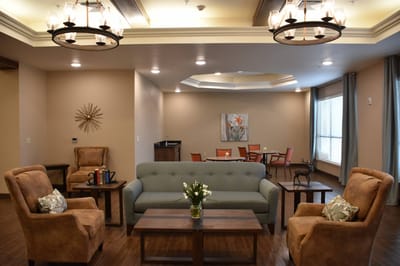
VibraLife also provides its residents with handicap accessible facilities with emergency call systems in place, and 24 hour security. The residents are also provided restaurant style dining, incontinence care, and in-house physical, occupational, and speech therapy. Scheduled local transportation are also available for outings and activities, as well as medical appointments. VibraLife Senior Living and Memory Care residents are also provided access to healthcare provisions in VibraLife Rehabilitation Center’s healthcare offerings.
| Staff type | Hours / Day / Resident | vs state avg |
|---|---|---|
|
Registered Nurse (RN)
| 43m per day | ▲ 65% State avg: 26m per day · National avg: 41m per day |
|
LPN / LVN
| 1h 12m per day | ▲ 26% State avg: 57m per day · National avg: 52m per day |
|
Nurse Aide
| 1h 40m per day | ▼ 17% State avg: 2h 1m per day · National avg: 2h 21m per day |
|
Weekend Total Nursing
| 3h 21m per day | ▲ 12% State avg: 2h 59m per day · National avg: 3h 26m per day |
|
Physical Therapist
| 4m per day | ■ Avg State avg: 4m per day · National avg: 4m per day |
|
Weekend RN
| 14m per day | ▼ 33% State avg: 21m per day · National avg: 29m per day |
Key information about the people who lead and staff this community.
In Texas, the Health and Human Services Commission (HHSC) is the primary regulatory body that conducts unannounced inspections and publishes quality reports for all long-term care homes.
Citations
| This Facility | TX Average | vs. TX Avg |
|---|---|---|---|
|
Total citations
| 49 | 6 | This facility has 717% more total citations than a typical Texas nursing home (49 vs. TX avg 6).↑ 717% worse |
Texas average 7.4
Last Health inspection on Mar 2025
Texas average 25.9
Texas average 3.67
Health citations are formal notices following inspections when they fail to comply with safety and care standards.
23 of 30 citations resulted from standard inspections; 4 of 30 resulted from complaint investigations; and 3 of 30 came from combined inspections (standard and complaint).
Texas average: 2
Texas average: 0.4
Reporting period: October 1 – December 31, 2025 (Q4 2025). Source: CMS Payroll-Based Journal report.
Manages medical care and health needs.
Assists with medical care and medications.
Helps with daily care and mobility.
| Certified Nursing Assistant | 30 | 0 | 30 | 6,442 | 92 | 100% | 6.9 |
| Licensed Practical Nurse | 18 | 0 | 18 | 5,351 | 92 | 100% | 7.2 |
| Clinical Nurse Specialist | 4 | 0 | 4 | 1,300 | 80 | 87% | 8 |
| Speech Language Pathologist | 4 | 0 | 4 | 870 | 75 | 82% | 7.5 |
| Registered Nurse | 5 | 0 | 5 | 775 | 74 | 80% | 7.3 |
| Qualified Social Worker | 4 | 0 | 4 | 599 | 76 | 83% | 6.7 |
| Physical Therapy Aide | 5 | 0 | 5 | 561 | 72 | 78% | 6.5 |
| Physical Therapy Assistant | 3 | 0 | 3 | 556 | 69 | 75% | 6.4 |
| Administrator | 1 | 0 | 1 | 528 | 66 | 72% | 8 |
| Other Dietary Services Staff | 1 | 0 | 1 | 483 | 61 | 66% | 7.9 |
| Dental Services Staff | 1 | 0 | 1 | 480 | 60 | 65% | 8 |
| Nurse Practitioner | 2 | 0 | 2 | 468 | 58 | 63% | 8.1 |
| Respiratory Therapy Technician | 3 | 0 | 3 | 377 | 76 | 83% | 4.3 |
| RN Director of Nursing | 1 | 0 | 1 | 94 | 22 | 24% | 4.3 |
Federal penalties imposed by CMS for regulatory violations, including civil money penalties (fines) and denials of payment for new Medicare/Medicaid admissions.
Source: CMS Penalties Database
No penalties in the past 3 years
No civil money penalties or payment denials were reported in the last 3 years.
These measures show how residents usually do over time at this home, based on health outcomes and preventive care.
Texas average: 8.6
Texas average: 16.0
Texas average: 16.2%
Texas average: 15.7%
Texas average: 3.2%
Texas average: 4.4%
Texas average: 0.8%
Texas average: 3.5%
Texas average: 2.9%
Texas average: 7.9%
Texas average: 97.3%
Texas average: 90.4%
Texas average: 1.4%
Texas average: 88.0%
Texas average: 25.9%
Texas average: 12.0%
Texas average: 0.8%
Texas average: 53.7%
Texas average: 50.6%
Quality measures are calculated from Minimum Data Set (MDS) assessments. For most measures, lower percentages indicate better care quality.
63% of new residents, usually for short-term rehab.
36% of new residents, often for short stays.
1% of new residents, often for long-term daily care.
Source: CMS Long-Term Care Facility Characteristics (Data as of Jan 2026)
Residents meet regularly to discuss policies, care quality, and activities
Organized group of residents that meets regularly to discuss facility policies, quality of life, and activities.
Data sourced from CMS Long-Term Care Facility Characteristics quarterly report. Payer mix reflects the current resident census by primary payment source.
Historical financial and operational data for VibraLife Senior Living and Memory Care from 2018–2023, based on CMS SNF Cost Reports.
Key figures below are for fiscal year ending in 12/2023.
Based on CMS SNF Cost Report for fiscal year ending in 12/2023.
No pets allowed
Housing Options: Private Rooms
Building Type: Single-story
Transportation Services
Fitness and Recreation
Most residents typically stay for a few weeks or months before returning home or moving on.
Most new residents arrive under Medicare (63% of admissions), and a typical Medicare stay runs around 5 days.
Coverage residents most often arrive under.
Coverage residents most often leave under.
![]() 3421 Joe Battle Blvd, El Paso, TX 79936 — 0.38 miles to nearest hospital (The Hospitals of Providence East Campus)
3421 Joe Battle Blvd, El Paso, TX 79936 — 0.38 miles to nearest hospital (The Hospitals of Providence East Campus)
Add your location
Info below is compiled from CMS reports & the TX Health & Human Services Commission (HHSC), senior community websites & trusted data sources such as Walk Score & BBB.
Communities are listed from highest to lowest based on our ranking methodology.
| Mountain Villa Nursing Center | NH SNF | El Paso (Military Heights) | 48
Facility
48
TX AVG
79
Rank
#685 / 972 |
78.3%
Facility
78.3%
TX AVG
67.3
Rank
#68 / 195 | +16% | 3.23
Facility
3.23
TX AVG
3.63
Rank
#209 / 273 | -20% | -11% | $0
Facility
$0
TX AVG
$81.8k
Rank
#1 / 278 | 26
Facility
26
TX AVG
25.9
Rank
#179 / 274 | 5.2
Facility
5.2
TX AVG
3.7
Rank
#252 / 274 | - | 38 | - |
70
Facility
70
TX AVG
41
Rank
#138 / 1389 | Maharlika Resources, Inc | $2.5MFiscal year ending 12/2023
Facility
$2.5MFiscal year ending 12/2023
TX AVG
$8.4M
Rank
#279 / 280 | $2.1MFiscal year ending 12/2023
Facility
$2.1MFiscal year ending 12/2023
TX AVG
$3.5M
Rank
#271 / 280 | 81.5%Fiscal year ending 12/2023
Facility
81.5%Fiscal year ending 12/2023
TX AVG
47%
Rank
#7 / 280 | 675768 | ||||
| Franklin Heights Nursing and Rehab Center | NH SNF | El Paso (Northwest El Paso) | 132
Facility
132
TX AVG
79
Rank
#119 / 972 |
79.6%
Facility
79.6%
TX AVG
67.3
Rank
#62 / 195 | +18% | 3.49
Facility
3.49
TX AVG
3.63
Rank
#137 / 273 | -15% | -4% | $191.5k
Facility
$191.5k
TX AVG
$81.8k
Rank
#259 / 278 | 72
Facility
72
TX AVG
25.9
Rank
#272 / 274 | 6.0
Facility
6.0
TX AVG
3.7
Rank
#264 / 274 | 5 | 105 | A+ |
51
Facility
51
TX AVG
41
Rank
#481 / 1389 | El Paso I Enterprises, LLC | $7.5MFiscal year ending 03/2024
Facility
$7.5MFiscal year ending 03/2024
TX AVG
$8.4M
Rank
#177 / 280 | $4.5MFiscal year ending 03/2024
Facility
$4.5MFiscal year ending 03/2024
TX AVG
$3.5M
Rank
#178 / 280 | 59.9%Fiscal year ending 03/2024
Facility
59.9%Fiscal year ending 03/2024
TX AVG
47%
Rank
#150 / 280 | 675479 | ||||
| VibraLife Senior Living and Memory Care | NH PC SNF | El Paso (East El Paso) | 60
Facility
60
TX AVG
79
Rank
#568 / 972 |
85.0%
Facility
85.0%
TX AVG
67.3
Rank
#46 / 195 | +26% | 3.26
Facility
3.26
TX AVG
3.63
Rank
#181 / 273 | -20% | -10% | $53.8k
Facility
$53.8k
TX AVG
$81.8k
Rank
#197 / 278 | 30
Facility
30
TX AVG
25.9
Rank
#200 / 274 | 5.0
Facility
5.0
TX AVG
3.7
Rank
#246 / 274 | - | 51 | - |
41
Facility
41
TX AVG
41
Rank
#707 / 1389 | Vibralife Holdings Of El Paso, LP | $6.8MFiscal year ending 12/2023
Facility
$6.8MFiscal year ending 12/2023
TX AVG
$8.4M
Rank
#183 / 280 | $4.3MFiscal year ending 12/2023
Facility
$4.3MFiscal year ending 12/2023
TX AVG
$3.5M
Rank
#197 / 280 | 62.7%Fiscal year ending 12/2023
Facility
62.7%Fiscal year ending 12/2023
TX AVG
47%
Rank
#159 / 280 | 676428 | ||||
| Vista Hills Health Care Center | NH MC SNF | El Paso (Vista De Oro) | 120
Facility
120
TX AVG
79
Rank
#204 / 972 |
68.7%
Facility
68.7%
TX AVG
67.3
Rank
#104 / 195 | +2% | 3.53
Facility
3.53
TX AVG
3.63
Rank
#137 / 273 | -7% | -3% | $40.5k
Facility
$40.5k
TX AVG
$81.8k
Rank
#188 / 278 | 73
Facility
73
TX AVG
25.9
Rank
#273 / 274 | 4.1
Facility
4.1
TX AVG
3.7
Rank
#212 / 274 | 1 | 82 | A+ |
51
Facility
51
TX AVG
41
Rank
#481 / 1389 | - | $7.7MFiscal year ending 12/2023
Facility
$7.7MFiscal year ending 12/2023
TX AVG
$8.4M
Rank
#159 / 280 | $4.0MFiscal year ending 12/2023
Facility
$4.0MFiscal year ending 12/2023
TX AVG
$3.5M
Rank
#216 / 280 | 51.8%Fiscal year ending 12/2023
Facility
51.8%Fiscal year ending 12/2023
TX AVG
47%
Rank
#223 / 280 | 455493 | ||||
| Pebble Creek Nursing Center | NH SNF | El Paso (East El Paso) | 120
Facility
120
TX AVG
79
Rank
#204 / 972 |
82.0%
Facility
82.0%
TX AVG
67.3
Rank
#58 / 195 | +22% | 3.26
Facility
3.26
TX AVG
3.63
Rank
#181 / 273 | +29% | -10% | $219.0k
Facility
$219.0k
TX AVG
$81.8k
Rank
#263 / 278 | 62
Facility
62
TX AVG
25.9
Rank
#269 / 274 | 4.8
Facility
4.8
TX AVG
3.7
Rank
#240 / 274 | 4 | 98 | A+ |
73
Facility
73
TX AVG
41
Rank
#95 / 1389 | - | $8.0MFiscal year ending 12/2023
Facility
$8.0MFiscal year ending 12/2023
TX AVG
$8.4M
Rank
#163 / 280 | $4.6MFiscal year ending 12/2023
Facility
$4.6MFiscal year ending 12/2023
TX AVG
$3.5M
Rank
#172 / 280 | 57.2%Fiscal year ending 12/2023
Facility
57.2%Fiscal year ending 12/2023
TX AVG
47%
Rank
#168 / 280 | 455718 |
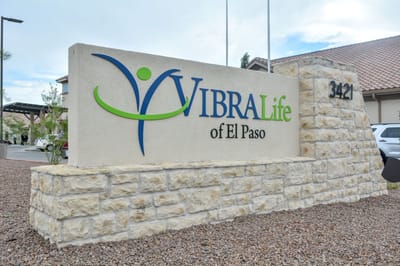
VibraLife Senior Living and Memory Care is located in El Paso, Texas.
Here are the financial assistance programs available to residents in Texas.
VibraLife Senior Living and Memory Care is in the East El Paso neighborhood of El Paso.
VibraLife Senior Living and Memory Care has a walk score of 41. Somewhat walkable. A few nearby services may be reachable on foot, but most trips require transportation.
VibraLife Senior Living and Memory Care's occupancy is 74.3%.
No, VibraLife Senior Living and Memory Care has a no-pet policy.
VibraLife Senior Living and Memory Care is registered as a for-profit in TX.
Yes — there are 6 photos of VibraLife Senior Living and Memory Care in the photo gallery on this page.
VibraLife Senior Living and Memory Care is located at 3421 Joe Battle Blvd, El Paso, TX 79936.
Care Cost Calculator: See Prices in Your Area
Nursing Home Data Explorer
Don’t Wait Too Long: 7 Red Flag Signs Your Parent Needs Assisted Living Now
The True Cost of Assisted Living in 2025 – And How Families Are Paying For It
Understanding Senior Living Costs: Pricing Models, Discounts & Financial Assistance


