


Hospitalizations per 1,000 days
 Number of hospitalizations per 1,000 long-stay resident days.
1.96
Number of hospitalizations per 1,000 long-stay resident days.
1.96
Alabama average: 2.00
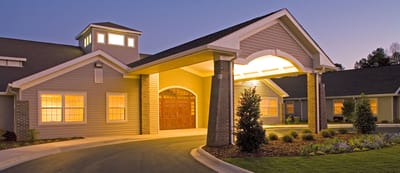
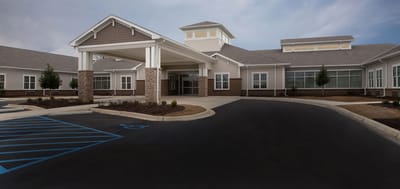
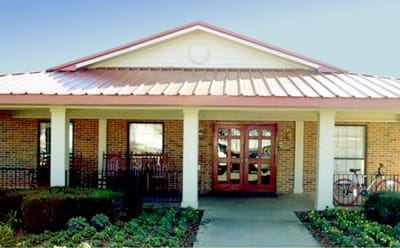
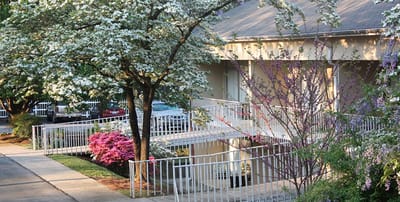
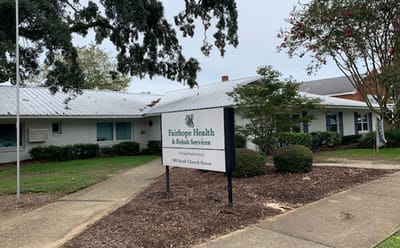

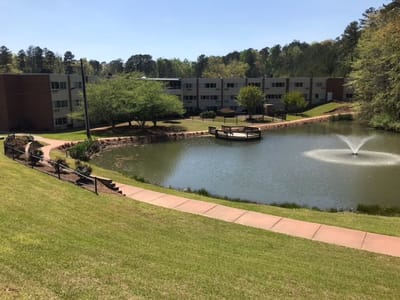
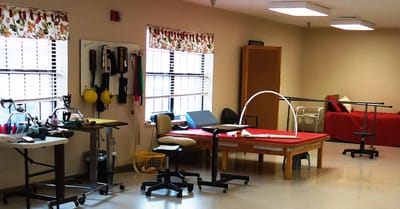
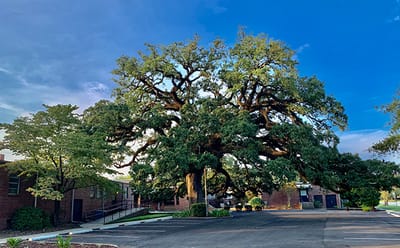

Gregory Flippo owns, and Randolph Pickell administers the Village at Cook Springs Skilled Nursing Facility, a 168-bed property located on a 200-acre retirement campus in Pell City, Alabama. The building runs at a 74 percent occupancy level, meaning they usually have available rooms for new admissions. Stays here average 128 days overall, though individual timelines shift from brief 18-day rehabilitation stays for Medicare patients to nine or ten months for long-term Medicaid residents.
Day-to-day operations rely on a 24-hour nursing team that logs an average of 4 hours and 41 minutes of direct, hands-on attention per resident daily, with nurse aides covering 2 hours and 42 minutes of that time. This schedule supports standard medical tracking, short-term physical therapy, and temporary respite care. Because the facility sits on a sprawling rural campus, the setting is removed from town services, meaning visitors will need a vehicle for all travel and external errands.
Federal records from the Centers for Medicare & Medicaid Services (CMS) give this facility a one-star overall rating due to poor health inspection outcomes and low clinical quality scores. State health surveys have documented repetitive compliance patterns involving infection control failures, improper care techniques, inaccurate documentation, and flawed reporting procedures, though no federal fines have been issued here in the last three years. You can look over these public regulatory reports directly with the facility leadership to check on their current quality control systems.
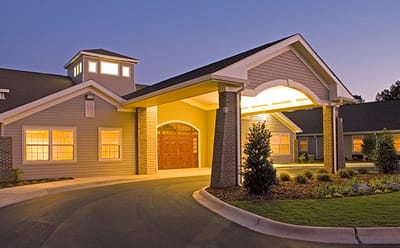
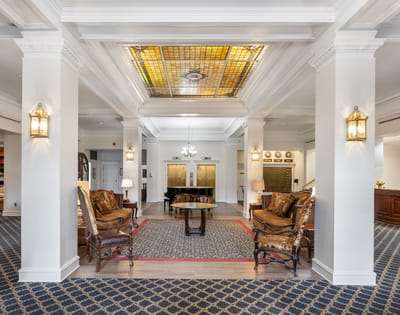
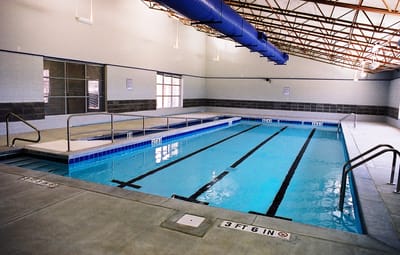
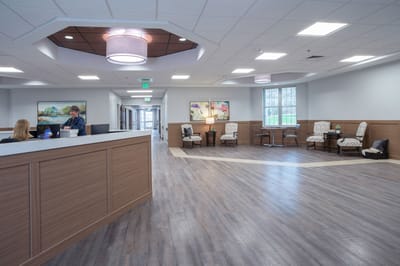
Interested individuals can reach out to the admissions department to ask about immediate openings or to review the entry paperwork. The staff can also outline the broader campus amenities, which include a library, a chapel with daily services, on-site salon services, wireless internet, and adjacent independent living apartments.
| Staff type | Hours / Day / Resident | vs state avg |
|---|---|---|
|
Registered Nurse (RN)
| 32m per day | ▼ 16% State avg: 38m per day · National avg: 41m per day |
|
LPN / LVN
| 42m per day | ▼ 11% State avg: 47m per day · National avg: 52m per day |
|
Nurse Aide
| 2h 43m per day | ▲ 9% State avg: 2h 30m per day · National avg: 2h 20m per day |
|
Weekend Total Nursing
| 3h 19m per day | ■ Avg State avg: 3h 17m per day · National avg: 3h 26m per day |
|
Physical Therapist
| 1m per day | ▼ 50% State avg: 2m per day · National avg: 4m per day |
|
Weekend RN
| 16m per day | ▼ 27% State avg: 22m per day · National avg: 28m per day |
Village at Cook Springs Assisted Living Facility is administered by Randolph Pickell.
These measures show how residents usually do over time at this home, based on health outcomes and preventive care.
Alabama average: 2.00
Alabama average: 1.79
Alabama average: 24.5%
Alabama average: 11.5%
Alabama average: 0.8%
Alabama average: 53.7%
Alabama average: 50.6%
Quality measures are calculated from Minimum Data Set (MDS) assessments. For most measures, lower percentages indicate better care quality.
Pets Allowed
![]() 3.0 miles from city center
3.0 miles from city center
![]() Estimated distance in miles from Pell City's city center to Village at Cook Springs Assisted Living Facility's address, calculated via Google Maps.
Estimated distance in miles from Pell City's city center to Village at Cook Springs Assisted Living Facility's address, calculated via Google Maps.
Add your location
Info below is compiled from CMS reports & the AL Dept. of Public Health (ADPH), senior community websites & trusted data sources such as Walk Score & BBB.
Communities are listed from highest to lowest based on our ranking methodology.
| Albertville Nursing Home | NH RC SNF | North Albertville | 159
Facility
159
AL AVG
90
Rank
#23 / 241 |
97.5%
Facility
97.5%
AL AVG
78.3
Rank
#5 / 108 | +24% | 5.06
Facility
5.06
AL AVG
4.37
Rank
#15 / 126 | -21% | +16% | $0
Facility
$0
AL AVG
$59.8k
Rank
#1 / 127 | 9
Facility
9
AL AVG
10.4
Rank
#53 / 126 | 3.0
Facility
3.0
AL AVG
3.5
Rank
#47 / 126 | - | 155 | - |
66
Facility
66
AL AVG
36
Rank
#33 / 417 | Terri Brown | $18.0MFiscal year ending 06/2024
Facility
$18.0MFiscal year ending 06/2024
AL AVG
$11.1M
Rank
#17 / 125 | $10.6MFiscal year ending 06/2024
Facility
$10.6MFiscal year ending 06/2024
AL AVG
$4.7M
Rank
#5 / 125 | 58.9%Fiscal year ending 06/2024
Facility
58.9%Fiscal year ending 06/2024
AL AVG
45%
Rank
#22 / 121 | 15163 | ||||
| Piedmont Health Care Center | NH AL MC SNF | Piedmont | 91
Facility
91
AL AVG
90
Rank
#99 / 241 |
92.3%
Facility
92.3%
AL AVG
78.3
Rank
#25 / 108 | +18% | 5.41
Facility
5.41
AL AVG
4.37
Rank
#6 / 126 | -49% | +24% | $0
Facility
$0
AL AVG
$59.8k
Rank
#1 / 127 | 3
Facility
3
AL AVG
10.4
Rank
#5 / 126 | 3.0
Facility
3.0
AL AVG
3.5
Rank
#47 / 126 | - | 84 | - |
61
Facility
61
AL AVG
36
Rank
#58 / 417 | Piedmont Health Care Center | $9.3MFiscal year ending 06/2024
Facility
$9.3MFiscal year ending 06/2024
AL AVG
$11.1M
Rank
#76 / 125 | $5.6MFiscal year ending 06/2024
Facility
$5.6MFiscal year ending 06/2024
AL AVG
$4.7M
Rank
#41 / 125 | 60.9%Fiscal year ending 06/2024
Facility
60.9%Fiscal year ending 06/2024
AL AVG
45%
Rank
#14 / 121 | 15194 | ||||
| Southern Springs Healthcare | NH SNF | Union Springs | 123
Facility
123
AL AVG
90
Rank
#58 / 241 |
86.2%
Facility
86.2%
AL AVG
78.3
Rank
#53 / 108 | +10% | 4.65
Facility
4.65
AL AVG
4.37
Rank
#39 / 126 | -46% | +6% | $0
Facility
$0
AL AVG
$59.8k
Rank
#1 / 127 | 7
Facility
7
AL AVG
10.4
Rank
#38 / 126 | 2.3
Facility
2.3
AL AVG
3.5
Rank
#26 / 126 | - | 106 | - |
61
Facility
61
AL AVG
36
Rank
#58 / 417 | Estate Of Milton E. Mcgregor | $10.2MFiscal year ending 06/2024
Facility
$10.2MFiscal year ending 06/2024
AL AVG
$11.1M
Rank
#107 / 125 | $7.1MFiscal year ending 06/2024
Facility
$7.1MFiscal year ending 06/2024
AL AVG
$4.7M
Rank
#34 / 125 | 69.9%Fiscal year ending 06/2024
Facility
69.9%Fiscal year ending 06/2024
AL AVG
45%
Rank
#1 / 121 | 15171 | ||||
| Arbor Woods Health and Rehab | NH SNF | Reform | 85
Facility
85
AL AVG
90
Rank
#112 / 241 |
59.5%
Facility
59.5%
AL AVG
78.3
Rank
#93 / 108 | -24% | 6.07
Facility
6.07
AL AVG
4.37
Rank
#3 / 126 | +17% | +39% | $0
Facility
$0
AL AVG
$59.8k
Rank
#1 / 127 | 2
Facility
2
AL AVG
10.4
Rank
#3 / 126 | 1.0
Facility
1.0
AL AVG
3.5
Rank
#1 / 126 | - | 51 | A+ |
36
Facility
36
AL AVG
36
Rank
#210 / 417 | Linda Dill | $5.1MFiscal year ending 06/2024
Facility
$5.1MFiscal year ending 06/2024
AL AVG
$11.1M
Rank
#121 / 125 | $3.5MFiscal year ending 06/2024
Facility
$3.5MFiscal year ending 06/2024
AL AVG
$4.7M
Rank
#110 / 125 | 68.5%Fiscal year ending 06/2024
Facility
68.5%Fiscal year ending 06/2024
AL AVG
45%
Rank
#4 / 121 | 15141 |
Yes, Village at Cook Springs Assisted Living Facility allows residents to bring their pets.
Randolph Pickell is the administrator of Village at Cook Springs Assisted Living Facility.
Village at Cook Springs Assisted Living Facility has 44 beds.
Yes — there are 29 photos of Village at Cook Springs Assisted Living Facility in the photo gallery on this page.
Village at Cook Springs Assisted Living Facility is located at 415 Cook Springs Road, Pell City, AL 35125.
(205) 338-2221 will put you in contact with the team at Village at Cook Springs Assisted Living Facility.
Village at Cook Springs Assisted Living Facility is in St. Clair County.
Care Cost Calculator: See Prices in Your Area
Nursing Home Data Explorer
Don’t Wait Too Long: 7 Red Flag Signs Your Parent Needs Assisted Living Now
The True Cost of Assisted Living in 2025 – And How Families Are Paying For It
Understanding Senior Living Costs: Pricing Models, Discounts & Financial Assistance


