Village at Rockville
Nursing Home, Assisted Living, Home Care, Independent Living, Memory Care, Nursing Care & Respite Care · Rockville, MD
CMS overall rating Info CMS (the Centers for Medicare & Medicaid Services) is the federal agency that rates nursing home quality. Its Overall Rating runs from 1 to 5 stars, combining health inspections, staffing, and quality measures, with inspections weighted most heavily.

Village at Rockville

Nursing Home, Assisted Living, Home Care, Independent Living, Memory Care, Nursing Care & Respite Care · Rockville, MD
CMS overall rating Info CMS (the Centers for Medicare & Medicaid Services) is the federal agency that rates nursing home quality. Its Overall Rating runs from 1 to 5 stars, combining health inspections, staffing, and quality measures, with inspections weighted most heavily.
Calculator: See prices in your area
Village at Rockville accepts Medicare and private pay.

Overview of Village at Rockville

Owned by Kyle Hreben, Village at Rockville is a skilled nursing facility in Rockville, Maryland, part of a continuing care retirement community. Its location at 9701 Veirs Drive is in a very walkable area with a Walk Score of 94. The home accepts Medicare and private pay, providing multiple ways for families to cover short-term recovery and ongoing nursing care.

The community has 57 beds with a 77% occupancy rate. Residents stay an average of 104 days, including post-acute rehabilitation residents and those with longer-term care needs. Daily care is provided by a nursing team that averages 4 hours of total nursing support per resident each day. Registered nurses on staff provide 43 minutes per day per resident. The facility offers 24-hour staffing, rehabilitation services, and respite care, so it’s a great option for families navigating post-hospital recovery.

Village at Rockville has been operating for 13 years. The facility serves a neighborhood with good walkability, so it’s convenient for family members visiting on foot, especially when navigating nearby services and appointments.

Quality ratings

Measured by Centers for Medicare & Medicaid Services (CMS)

Overall rating Info The Overall CMS Rating combines results from health inspections, staffing levels and quality measures. Health inspections carry the most weight. Staffing and quality scores can increase or decrease the final rating based on performance compared to state and national standards.
At MD avg. At MD avg.MD average: 3.0Click the badge to see the full State ranking.Click here to see the full State ranking.
Health Inspection Info Based on the results of the facility's three most recent standard inspections and any complaint investigations. CMS reviews the number, scope, and severity of deficiencies, with more recent findings weighted more heavily.
▼ 29.0% Below MD avg. ▼ 29.0% Below MD avg.MD average: 2.8Click the badge to see the full State ranking.Click here to see the full State ranking.
Staffing Info Measures average nursing staff hours per resident per day, including Registered Nurses (RNs) and total nursing staff. Ratings are adjusted based on the level of care residents require and are compared to state and national benchmarks.
▲ 31.3% Above MD avg. ▲ 31.3% Above MD avg.MD average: 3.0Click the badge to see the full State ranking.Click here to see the full State ranking.
Quality Measures Info Based on clinical and physical health indicators reported to CMS, such as hospital readmissions, falls, pressure ulcers, and improvements in mobility. These measures reflect how well residents' health needs are being managed.
▲ 35.3% Above MD avg. ▲ 35.3% Above MD avg.MD average: 3.7Click the badge to see the full State ranking.Click here to see the full State ranking.

Staffing hours breakdown

Info Daily nursing hours per resident by staff type, reported to CMS. Higher is generally better — compare this facility to state and national averages to see where staffing stands.

Hours per resident per day — compared to Maryland state averages

Total nursing care / resident Info Total adjusted nursing hours per resident per day, combining RN, LPN, and aide time. CMS adjusts this for case-mix so facilities can be fairly compared.
4h 0m per day
This facility Maryland avg (3h 46m per day)
vs Maryland avg
+6%

3 of 6 metrics below state avg

Standout metric LPN / LVN is +28% above state avg
Staff typeHours / Day / Residentvs state avg
Registered Nurse (RN) Info RNs hold the highest nursing license and can assess residents, interpret test results, and direct care plans. More RN hours per day often signals stronger clinical oversight and faster response to health changes. 43m per day ▼ 12% State avg: 49m per day · National avg: 41m per day
LPN / LVN Info Licensed Practical Nurses (LPNs) or Licensed Vocational Nurses (LVNs) deliver routine hands-on care — medication administration, wound dressing, and monitoring vital signs. They work under RN supervision and make up a large share of daily bedside care. 1h 10m per day ▲ 28% State avg: 55m per day · National avg: 52m per day
Nurse Aide Info Certified Nurse Aides (CNAs) provide the most direct day-to-day assistance: bathing, dressing, feeding, and mobility. Nurse aide hours are typically the largest staffing category and directly affect residents' quality of life. 2h 21m per day ▲ 9% State avg: 2h 9m per day · National avg: 2h 20m per day
Weekend Total Nursing Info Combined nursing hours (RN + LPN + Nurse Aide) per resident per day on weekends. Staffing often drops on weekends — this figure reveals whether the facility maintains adequate coverage outside of weekday hours. 3h 55m per day ▲ 13% State avg: 3h 28m per day · National avg: 3h 26m per day
Physical Therapist Info Hours per resident per day provided by licensed Physical Therapists (PTs) or PT Assistants. PT services help residents recover mobility after injury or illness and are especially important for post-acute (short-stay) rehabilitation. 4m per day ▼ 27% State avg: 5m per day · National avg: 4m per day
Weekend RN Info Registered nurse hours specifically on weekends. Facilities sometimes reduce RN presence on Saturdays and Sundays — a low weekend RN figure compared to weekday hours can indicate reduced clinical oversight when most administrative staff are absent. 33m per day ▼ 10% State avg: 37m per day · National avg: 28m per day

Capacity and availability

Avg. Length of Stay
104 days
Bed community size
57-bed community Rank #213 / 697Bed count — State benchmarkedThis home is ranked 213th out of 697 homes in Maryland. Shows this facility's certified or reported bed count compared to other Maryland facilities. Larger communities may offer more amenities, programs, and on-site services for residents and families.Rankings are based only on facilities in Maryland that report data for that category. Facilities without available data are excluded from the ranking.Click the rank badge to see the full State ranking.Click here to see the full State ranking.
A moderately sized community that may balance personal attention with shared amenities and social activities.
Years in operation
13 years in operation Rank #141 / 208Years in operation — State benchmarkedThis home is ranked 141st out of 208 homes in Maryland. Shows how long this facility has been in operation compared to other Maryland facilities. Longer operating histories may benefit residents, families, and staff.Rankings are based only on facilities in Maryland that report data for that category. Facilities without available data are excluded from the ranking.Click the rank badge to see the full State ranking.Click here to see the full State ranking.
A community with a solid operating history and experience delivering ongoing care.
Walk Score
Walk Score: 94 / 100 Rank #9 / 985Walk Score — State benchmarkedThis home is ranked 9th out of 985 homes in Maryland. Shows how walkable this facility's neighborhood is compared to the average Walk Score across Maryland facilities. Higher scores benefit residents, families, and staff.Rankings are based only on facilities in Maryland that report data for that category. Facilities without available data are excluded from the ranking.Click the rank badge to see the full State ranking.Click here to see the full State ranking.
Walker's paradise. Daily errands do not require a car, with many shops and services nearby.

About this community

Occupancy

Occupancy rate
77%
Higher than the Maryland average: 60%
Occupied beds
44 / 57
Average occupied beds in Maryland homes 104 beds

License Details

Facility TypeAssisted Living
IssuanceApril 1, 2013
CountyMontgomery
CMS Certification Number215125

Ownership & Operating Entity

Profit StatusNonprofit

Room costs

Private Room $265 - $385 per day
Apartment $314 - $434 per day

Therapy & Rehabilitation

2 services
Rehabilitation Services
Respite Care

Staffing & Medical

1 service
24-Hour Staffing

Memory & Specialized Care

1 service
Dedicated Alzheimer's Unit

Additional Policies & Features

Continuing Care Retirement Community (CCRC)

Contact Village at Rockville

Inspection History

In Maryland, the Department of Health, Office of Health Care Quality is the state agency that conducts unannounced inspections and issues reports for all assisted living and nursing facilities.

Since 2018 · 8 years of data 40 citations 3 inspections

Inspection Scorecard Info This scorecard compares key inspection, citation, and complaint metrics at this facility against the Maryland state average. Metrics rated ≥15% worse than average are highlighted in red; those ≥15% better are highlighted in green.

Since 2018 vs. Maryland state average
Overall vs. MD average 3 Worse Metrics worse than Maryland average:
• Total citations (900% above)
• Citations per year (900% above)
• Citations per inspection (1563% above)
1 Better Metrics better than Maryland average:
• Total inspections (40% below)
Latest Inspection October 11, 2024 Complaint Investigation

Citations Info Citations are formal regulatory issues recorded during state inspections.

This FacilityMD Averagevs. MD Avg
Total citations Info Formal regulatory issues recorded by inspectors across all inspection types. 404 This facility has 900% more total citations than a typical Maryland nursing home (40 vs. MD avg 4).↑ 900% worse
Citations per year Info Average citations per year since 2018. 50.5 This facility has 900% more citations per year than a typical Maryland nursing home (5 vs. MD avg 0.5).↑ 900% worse
Citations per inspection Info Average citations per inspection. 13.30.8 This facility has 1563% more citations per inspection than a typical Maryland nursing home (13.3 vs. MD avg 0.8).↑ 1563% worse

Inspections Info State inspections evaluate whether the facility meets health and safety standards.

This FacilityMD Averagevs. MD Avg
Total inspections Info Combined count of all routine and focused inspections. Excludes complaint investigations. 35 This facility has 40% fewer total inspections than a typical Maryland nursing home (3 vs. MD avg 5).↓ 40% better

Health Inspection History

Inspections since 2018
Total health inspections 3

Maryland average 3.9


Last Health inspection on Oct 2024

Total health citations
38 Rank #66 / 149Health citations — State benchmarkedThis home is ranked 66th out of 149 homes in Maryland. Shows this facility's total health deficiency citations benchmarked to the Maryland State average, with a ranking across all 149 MD facilities. Lower citation counts earn a better rank.Rankings are based only on facilities in Maryland that report data for that category. Facilities without available data are excluded from the ranking.Click the rank badge to see the full State ranking.Click here to see the full State ranking.

Maryland average 49.9

Citations per inspection
12.67

Maryland average 12.81


Health citations are formal notices following inspections when they fail to comply with safety and care standards.

33 of 38 citations resulted from standard inspections; 1 of 38 resulted from complaint investigations; and 4 of 38 came from combined inspections (standard and complaint).

Breakdown of citation severity (last 8 years)
Critical health citations
2
300% worse than Maryland average

Maryland average: 0.5


Serious health citations
0
100% better than Maryland average

Maryland average: 0.6

2 critical citations Maryland average: 0.5

0 serious citations Maryland average: 0.6

32 moderate citations Maryland average: 47.2

4 minor citations Maryland average: 1.7
Citations history (last 8 years)
Abuse/Neglect moderate citation Oct 11, 2024
Corrected

Abuse/Neglect moderate citation Oct 11, 2024
Corrected

Abuse/Neglect moderate citation Oct 11, 2024
Corrected

Administration moderate citation Oct 11, 2024
Corrected

Staffing Data

Reporting period: October 1 – December 31, 2025 (Q4 2025). Source: CMS Payroll-Based Journal report.

Total staff 198
Employees 153
Contractors 45
Staff to resident ratio 1.31 : 1
28% fewer staff per resident than Maryland average
Maryland average ratio: 1.81 : 1 Maryland average ratio: 1.81 : 1See full Maryland ranking
Avg staff/day 74
Average shift 8.9 hours
11% better than Maryland average
Maryland average: 8 hours Maryland average shift: 8 hoursSee full Maryland ranking
Total staff hours (quarter) 60,450

Nursing staff breakdown

Q4 2025 · Oct 1 – Dec 31 More info This data comes from the CMS Payroll-Based Journal report covering October 1 – December 31, 2025.
Registered Nurse

Manages medical care and health needs.

RN Staff Info All 26 RN Staff are full-time employees. No contractors work on this role. 26
Average shift length Info Average shift length. Calculated as total hours divided by days worked and average staff per day. 9.2 hours
Licensed Practical Nurse

Assists with medical care and medications.

LPN Staff Info 56 total: 35 full-time employees and 21 contractors. 56
Average shift length Info Average shift length. Calculated as total hours divided by days worked and average staff per day. 10.2 hours
Certified Nursing Assistant

Helps with daily care and mobility.

CNA Staff Info 75 total: 70 full-time employees and 5 contractors. 75
Average shift length Info Average shift length. Calculated as total hours divided by days worked and average staff per day. 9.5 hours

Contractor staffing

Q4 2025 · Oct 1 – Dec 31 More info This data comes from the CMS Payroll-Based Journal report covering October 1 – December 31, 2025.

Total hours from contractors

7.6%

4,586 contractor hours this quarter

Licensed Practical Nurse: 21 Respiratory Therapy Technician: 6 Certified Nursing Assistant: 5 Speech Language Pathologist: 4 Physical Therapy Aide: 4 Physical Therapy Assistant: 3 Clinical Nurse Specialist: 1 Qualified Social Worker: 1

Staff by category

Q4 2025 · Oct 1 – Dec 31 More info This data comes from the CMS Payroll-Based Journal report covering October 1 – December 31, 2025.
Certified Nursing Assistant7057528,26592100%9.5
Licensed Practical Nurse35215613,74892100%10.2
Registered Nurse260267,40892100%9.2
Other Dietary Services Staff120123,73492100%6.5
Mental Health Service Worker3031,3936571%7.9
Speech Language Pathologist0441,1517784%7.2
Clinical Nurse Specialist2139646368%7.8
Physical Therapy Assistant0338177582%6.8
Respiratory Therapy Technician0667398289%6.3
Physical Therapy Aide0446217683%7.8
Administrator1014806065%8
RN Director of Nursing1014165459%7.7
Nurse Practitioner1013444347%8
Qualified Social Worker0112425560%4.4
Medication Aide/Technician101801314%6.2
Dietitian101476267%0.8
75 Certified Nursing Assistant
% of Days 100%
56 Licensed Practical Nurse
% of Days 100%
26 Registered Nurse
% of Days 100%
12 Other Dietary Services Staff
% of Days 100%
3 Mental Health Service Worker
% of Days 71%
4 Speech Language Pathologist
% of Days 84%
3 Clinical Nurse Specialist
% of Days 68%
3 Physical Therapy Assistant
% of Days 82%
6 Respiratory Therapy Technician
% of Days 89%
4 Physical Therapy Aide
% of Days 83%
1 Administrator
% of Days 65%
1 RN Director of Nursing
% of Days 59%
1 Nurse Practitioner
% of Days 47%
1 Qualified Social Worker
% of Days 60%
1 Medication Aide/Technician
% of Days 14%
1 Dietitian
% of Days 67%

Penalties and fines

Includes penalties issued in 2024

Federal penalties imposed by CMS for regulatory violations, including civil money penalties (fines) and denials of payment for new Medicare/Medicaid admissions.

Source: CMS Penalties Database (Data as of Jan 2026)

Total fines amount $17K
72% lower than Maryland average

Maryland average: $61K

Number of fines 1
33% fewer fines than Maryland average

Maryland average: 1.5

Payment Denials Info Serious action where Medicare and/or Medicaid temporarily stops payments for new residents until issues are fixed. 0
100% fewer payment denials than Maryland average

Maryland average: 0.1

Fines amount comparison
This facility $17K
Maryland average $61K
Penalty History

Penalties are imposed by CMS for violations of federal nursing home regulations.

1 penalty in the past 3 years

Oct 11, 2024 · $17K

Civil Money Penalty Info Fines imposed for noncompliance, which can be assessed per day or per instance of violation. Oct 11, 2024
$17K

Last updated: Jan 2026

Quality of care over time

These measures show how residents usually do over time at this home, based on health outcomes and preventive care.

High-risk clinical events score Info A composite score based on pressure ulcers, falls with injury, weight loss, walking ability decline, and activities of daily living decline. 14.5
12% worse than Maryland average

Maryland average: 12.9

Functional decline score Info A composite score based on activities of daily living decline, walking ability decline, and incontinence. 27.2
6% worse than Maryland average

Maryland average: 25.7

Long-stay resident measures
Above average Maryland avg: 3.7 Info CMS star rating based on long-stay quality measure performance. 5 stars = significantly above average, 1 star = significantly below average.
Need for Help with Daily Activities Increased Info Percent of long-stay residents whose need for help with daily activities has increased 24.5%
In line with Maryland average

Maryland average: 23.7%

Walking Ability Worsened Info Percent of long-stay residents whose ability to move independently worsened 35.2%
27% worse than Maryland average

Maryland average: 27.7%

Low Risk Residents with Bowel/Bladder Incontinence Info Percent of low risk long-stay residents who lose control of their bowels or bladder 21.9%
16% better than Maryland average

Maryland average: 25.9%

Falls with Major Injury Info Percent of long-stay residents experiencing one or more falls with major injury 1.7%
25% better than Maryland average

Maryland average: 2.3%

High Risk Residents with Pressure Ulcers Info Percent of long-stay high risk residents with pressure ulcers 6.9%
6% worse than Maryland average

Maryland average: 6.5%

Urinary Tract Infection Info Percent of long-stay residents with a urinary tract infection 1.5%
8% better than Maryland average

Maryland average: 1.6%

Lost Too Much Weight Info Percent of long-stay residents who lose too much weight 4.4%
24% better than Maryland average

Maryland average: 5.8%

Depressive Symptoms Info Percent of long-stay residents who have depressive symptoms 3.6%
82% better than Maryland average

Maryland average: 20.2%

Antipsychotic Use Info Percent of long-stay residents who received an antipsychotic medication 21.0%
62% worse than Maryland average

Maryland average: 12.9%

Pneumococcal Vaccine Info Percent of long-stay residents assessed and appropriately given the pneumococcal vaccine 76.0%
17% worse than Maryland average

Maryland average: 92.0%

Influenza Vaccine Info Percent of long-stay residents assessed and appropriately given the seasonal influenza vaccine 96.5%
In line with Maryland average

Maryland average: 96.6%

Hospitalizations per 1,000 days Info Number of hospitalizations per 1,000 long-stay resident days. 1.16
12% better than Maryland average

Maryland average: 1.32

ED visits per 1,000 days Info Number of outpatient emergency department visits per 1,000 long-stay resident days. 0.61
50% better than Maryland average

Maryland average: 1.21

Short-stay resident measures
Significantly above average Maryland avg: 3.7 Info CMS star rating based on short-stay quality measure performance. 5 stars = much above average, 1 star = much below average.
Pneumococcal Vaccine Info Percent of short-stay residents assessed and appropriately given the pneumococcal vaccine 85.6%
9% better than Maryland average

Maryland average: 78.4%

Antipsychotic medication increase Info Percent of short-stay residents who newly received an antipsychotic medication 1.6%
17% worse than Maryland average

Maryland average: 1.4%

Influenza Vaccine Info Percent of short-stay residents assessed and appropriately given the seasonal influenza vaccine 91.6%
14% better than Maryland average

Maryland average: 80.6%

Re-hospitalized after SNF stay Info Percentage of short-stay residents who were re-hospitalized after their nursing home admission. 14.8%
30% better than Maryland average

Maryland average: 21.2%

Emergency department visits Info Percentage of short-stay residents who had an outpatient emergency department visit. 5.6%
43% better than Maryland average

Maryland average: 9.9%

Falls with major injury Info Percentage of SNF residents who experience falls with major injury during their stay. 0.0%
100% better than Maryland average

Maryland average: 0.8%

Ability to care for self at discharge Info Percentage of residents at or above expected ability to care for themselves at discharge. 46.1%
14% worse than Maryland average

Maryland average: 53.7%

Successful return to home or community Info Rate of successful return to home or community from a skilled nursing facility. 62.8%
24% better than Maryland average

Maryland average: 50.6%

Breakdown by payment type

Medicare

84% of new residents, usually for short-term rehab.

Typical stay 1 months

Private pay

16% of new residents, often for short stays.

Typical stay 5 - 6 months

Facility Characteristics

Source: CMS Long-Term Care Facility Characteristics (Data as of Jan 2026)

Total residents 151
Medicare
43
28.5% of residents
Medicaid
81
53.6% of residents
Private pay or other
27
17.9% of residents
Programs & Services
Residents Group

Residents meet regularly to discuss policies, care quality, and activities

CCRC

Part of a Continuing Care Retirement Community offering multiple care levels

Active Resident Council

Organized group of residents that meets regularly to discuss facility policies, quality of life, and activities.

Finances and operations

Based on CMS SNF Cost Report for fiscal year ending in 12/2023.

Nonprofit
Nonprofit Corporation
Net patient revenue Info Net patient revenue — what the home actually collects for resident care, after contractual allowances, bad debt and discounts are subtracted from its gross charges (CMS cost report, Worksheet G-3). It covers resident care only; money the home earns from other sources is shown separately as "Other income."
$35.0M
Net patient income Info Net patient income: net patient revenue minus the home's total operating expenses. A positive figure means it earns more from resident care than it spends to deliver it; a negative figure means the opposite. It excludes non-operating "other income."
-$6.7M
Nonprofit Nonprofit Corporation
Net patient revenue Info Net patient revenue — what the home actually collects for resident care, after contractual allowances, bad debt and discounts are subtracted from its gross charges (CMS cost report, Worksheet G-3). It covers resident care only; money the home earns from other sources is shown separately as "Other income."
$35.0M
Net patient income Info Net patient income: net patient revenue minus the home's total operating expenses. A positive figure means it earns more from resident care than it spends to deliver it; a negative figure means the opposite. It excludes non-operating "other income."
-$6.7M
Other income Info Money the home earns outside of resident care — such as investments, grants, rentals and other non-operating sources (CMS cost report, Worksheet G-3). It is tracked separately from net patient revenue: it is not part of that figure, and it is not included in net patient income.
$7.6M
Payroll costs Info Staff salaries plus wage-related costs — benefits such as payroll taxes, health insurance and retirement — from the home's own accounting records (CMS cost report, Worksheet A). Contract or agency labor is counted separately, under other operating costs.
$16.6M 47.4% of net patient revenue Info Payroll as a share of revenue: staff salaries and wage-related benefits divided by net patient revenue. A higher figure means more of each revenue dollar goes to staff pay. Rank #122 / 148Payroll % — State benchmarkedThis home is ranked 122nd out of 148 homes in Maryland. Shows payroll as a percentage of revenue versus the Maryland average. Well-run Maryland facilities typically land around 49–57% — the top third Statewide. Below 25% may signal understaffing or heavy agency use — read with Staffing ratings.Rankings are based only on facilities in Maryland that report data for that category. Facilities without available data are excluded from the ranking.Click the rank badge to see the full State ranking.Click here to see the full State ranking.
Other operating costs Info Everything it costs to run the home apart from payroll — food, utilities, supplies, maintenance, contract labor and administration. Calculated as total operating expense minus payroll (staff salaries and wage-related benefits).
$25.1M
Total costs Info The home's total operating expense for the year — all the costs of running it, salaries included (CMS cost report, Worksheet G-3).
$41.8M

Who this home usually serves

TYPE OF STAY

Mostly short-term rehab stays

Most residents typically stay for a few weeks or months before returning home or moving on.

Most new residents arrive under Medicare (84% of admissions), and a typical Medicare stay runs around 1 months.

Admissions
424 total

Coverage residents most often arrive under.

Medicare 84%
Private pay 16%
Discharges
432 total

Coverage residents most often leave under.

Medicare 67%
Private pay 28%
Medicaid 5%

Places of interest near Village at Rockville

Address 0.1 miles from city center Info Estimated distance in miles from Rockville's city center to Village at Rockville's address, calculated via Google Maps.

Calculate Travel Distance to Village at Rockville

Add your location

Address

Compare Nursing Homes around Rockville

The information below is reported by the Maryland Department of Health, Office of Health Care Quality.

5 facilities compared · CMS & MD Dept. of Health data

Tuckerman Rehabilitation & Healthcare Center
NH
NC
PC
RC
Rockville
41
Facility 41
MD AVG 43
Rank #238 / 697
83.2% +1%2.88 +43%-24%$0
23
Facility 23
MD AVG 49.9
Rank #21 / 149
4.6-37-
39
Facility 39
MD AVG 43
Rank #534 / 985
Calanthia Green$4.7M$2.0M
41.8%
Facility 41.8%
MD AVG 38.5%
Rank #88 / 148
215320
Ingleside at King Farm
NH
AL
IL
MC
Rockville (King Farm)
45
Facility 45
MD AVG 43
Rank #233 / 697
92.2% +12%6.36 +5%+68%$0168.0-33-
73
Facility 73
MD AVG 43
Rank #152 / 985
Westminster Ingleside King Farm Retirement Communities Inc$44.3M$14.8M33.4%215353
Revitz House
NH
AL
HC
IL
MC
Rockville
558
Facility 558
MD AVG 43
Rank #1 / 697
69.4% -16%3.91 -37%+4%$0
25
Facility 25
MD AVG 49.9
Rank #25 / 149
8.3-378-
81
Facility 81
MD AVG 43
Rank #86 / 985
Alison Baraf$57.8M$42.1M
72.9%
Facility 72.9%
MD AVG 38.5%
Rank #41 / 148
215071
Autumn Lake Healthcare at Oak Manor
NH
MC
PC
RC
Burtonsville (Perrywood Estates)
145
Facility 145
MD AVG 43
Rank #48 / 697
81.8% -1%3.48 -48%-8%$11.4k
36
Facility 36
MD AVG 49.9
Rank #58 / 149
7.21131-
18
Facility 18
MD AVG 43
Rank #756 / 985
3415 Greencastle Road Holdco LLC$19.0M$3.2M16.6%215315
Village at Rockville
NH
AL
HC
IL
MC
NC
RC
Rockville
57
Facility 57
MD AVG 43
Rank #213 / 697
77.3% -6%4.01 -5%+6%$17.3k
38
Facility 38
MD AVG 49.9
Rank #66 / 149
12.72131-
94
Facility 94
MD AVG 43
Rank #9 / 985
Kyle Hreben$35.0M$16.6M
47.4%
Facility 47.4%
MD AVG 38.5%
Rank #122 / 148
215125

Financial Assistance for
Nursing Home in Maryland

Village at Rockville is located in Rockville, Maryland.
Here are the financial assistance programs available to residents in Maryland.

Get Financial aid guidance

Community Options Waiver

Maryland Medicaid Community Options Waiver

Age 65+ or disabled
General Maryland resident, Medicaid- eligible, nursing home-level care need.
Income Limits (2025) ~$2,829/month 300% FBR, individual
Asset Limits $2,000 (individual), $3,000 (couple) (excludes home, car).
MD

High urban demand; rural outreach efforts.

Benefits
Personal care (5-7 hours/day, e.g., bathing, dressing) Respite care (up to 240 hours/year) Adult day care ($70/day) Home modifications ($1,500 avg.)

Senior Care Program

Maryland Senior Care

Age 65+
General Maryland resident, at risk of nursing home placement.
Income Limits ~$2,000/month individual, varies by county
Asset Limits $11,000 individual
MD

Limited funding; waitlists common in high-demand areas.

Benefits
In-home care (3-5 hours/week) Respite care (up to 10 days/year) Meals (~$6/meal) Transportation (~5 trips/month) Case management

Maryland Nursing Home Medicaid

Maryland Medical Assistance (Medicaid) Nursing Home Program

Age 65+
General Maryland resident, Medicaid-eligible, requires nursing home-level care.
Income Limits (2025) $943/month (individual); most income applied to care costs.
Asset Limits $2,500 (individual), $3,000 (couple); spousal protections up to $155,356.
MD

Home equity limit $636,000; estate recovery applies post-55.

Benefits
24/7 nursing care Meals Therapy Medications (unlimited per medical need)

Senior Assisted Living Subsidy Program

Maryland Senior Assisted Living Group Home Subsidy

Age 62+
General Maryland resident, in or moving to approved assisted living, low/moderate income.
Income Limits (2025) ~$34,000/year individual, varies by county
Asset Limits Not strict; prioritizes low-income.
MD

Not available statewide; facility must be licensed by MDH.

Benefits
Personal care Meals 24-hour supervision (up to $1,500/month subsidy typical)

Veterans Aid and Attendance (A&A) Benefit

Maryland VA Aid and Attendance

Age
General Wartime veteran/spouse, age 65+ or disabled, needs ADL help, Maryland resident.
Income Limits (2025) Net income minus medical expenses < $1,984/month individual with A&A
Asset Limits $155,356 net worth limit
MD

High veteran population in suburban/rural areas.

Benefits
Cash benefit ($1,478-$2,471/month, varies by status) for care costs

Senior Prescription Drug Assistance Program (SPDAP)

Maryland Senior Prescription Drug Assistance Program

Age 65+
General Maryland resident (6+ months), Medicare Part D enrolled.
Income Limits (2025) $48,560/year individual, 300% FPL
Asset Limits None specified.
MD

Supplements Medicare Part D; annual enrollment required.

Benefits
Up to $40/month premium subsidy Reducing drug costs

Medicare Savings Programs (MSP)

Maryland Medicare Savings Programs

Age 65+
General Maryland resident, Medicare Part A/B enrollee.
Income Limits (2025) $2,014/month (QMB), $2,706/month (SLMB/QI, individual).
Asset Limits $9,090 (individual), $13,630 (couple).
MD

Includes QMB, SLMB, QI categories.

Benefits
Covers premiums (up to $174.70/month Part B) Co-pays Deductibles

Community Personal Assistance Services (CPAS)

Maryland Medicaid Community Personal Assistance Services

Age 65+
General Maryland resident, Medicaid-eligible, needs ADL assistance.
Income Limits (2025) $943/month (individual); spend-down available.
Asset Limits $2,500 (individual), $3,000 (couple).
MD

Consumer-directed option allows hiring family caregivers.

Benefits
Personal care (hours vary, typically 20-30/week) Chores Nurse supervision

Frequently Asked Questions about Village at Rockville

Is Village at Rockville in a walkable area?

Village at Rockville has a walk score of 94. Walker's paradise. Daily errands do not require a car, with many shops and services nearby.

What is the occupancy rate at Village at Rockville?

Village at Rockville's occupancy is 77%.

Does Village at Rockville have different floorplan options?

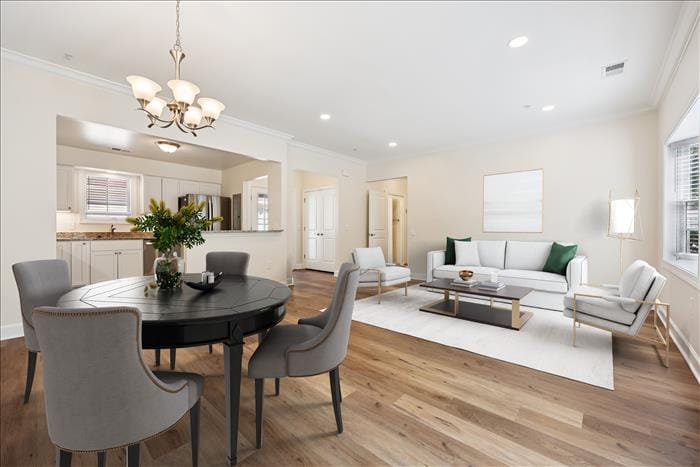
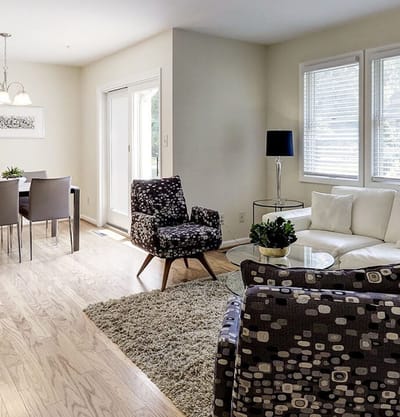
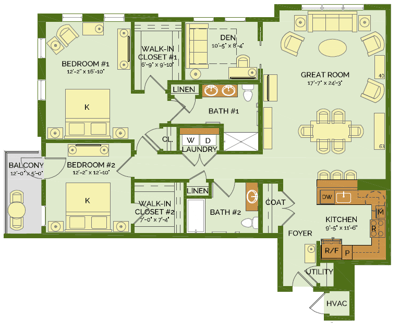
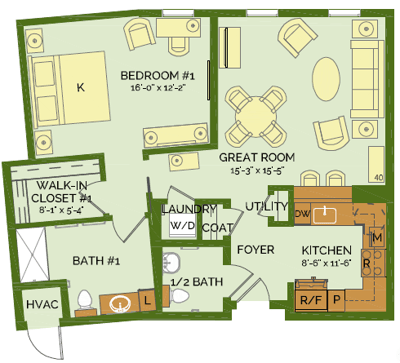
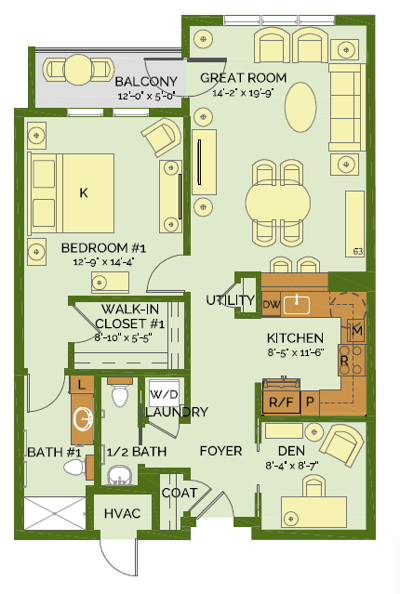
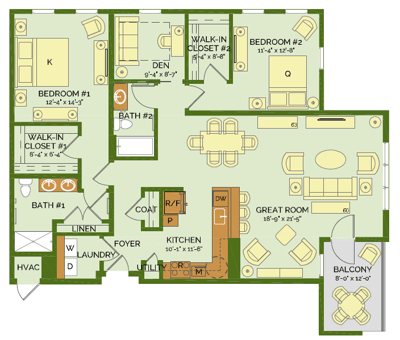
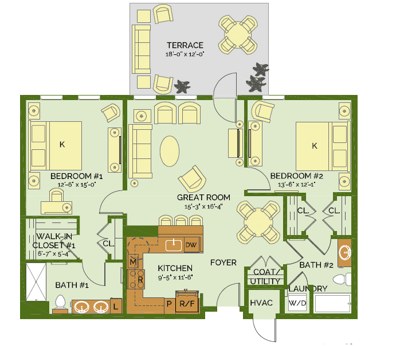
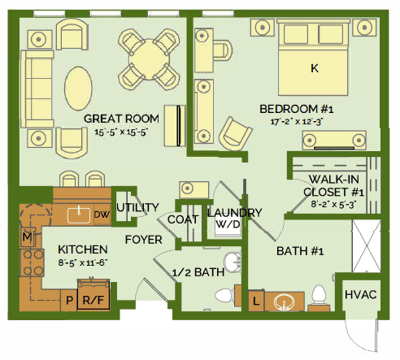
Yes — see the floorplan options available at Village at Rockville on this page.

Does Village at Rockville operate as a for-profit or non-profit?

Village at Rockville is registered as a non-profit in MD.

How many beds does Village at Rockville have?

Village at Rockville has 57 beds.

Are there photos of Village at Rockville?

Yes — there are 17 photos of Village at Rockville in the photo gallery on this page.

What is the address of Village at Rockville?

Village at Rockville is located at 9701 Veirs Drive, Rockville, MD 20850.

Guides for Better Senior Living

Care Cost Calculator: See Prices in Your Area

Nursing Home Data Explorer

Don’t Wait Too Long: 7 Red Flag Signs Your Parent Needs Assisted Living Now

The True Cost of Assisted Living in 2025 – And How Families Are Paying For It

Understanding Senior Living Costs: Pricing Models, Discounts & Financial Assistance