


Total staff
151
Employees
94
Contractors
57
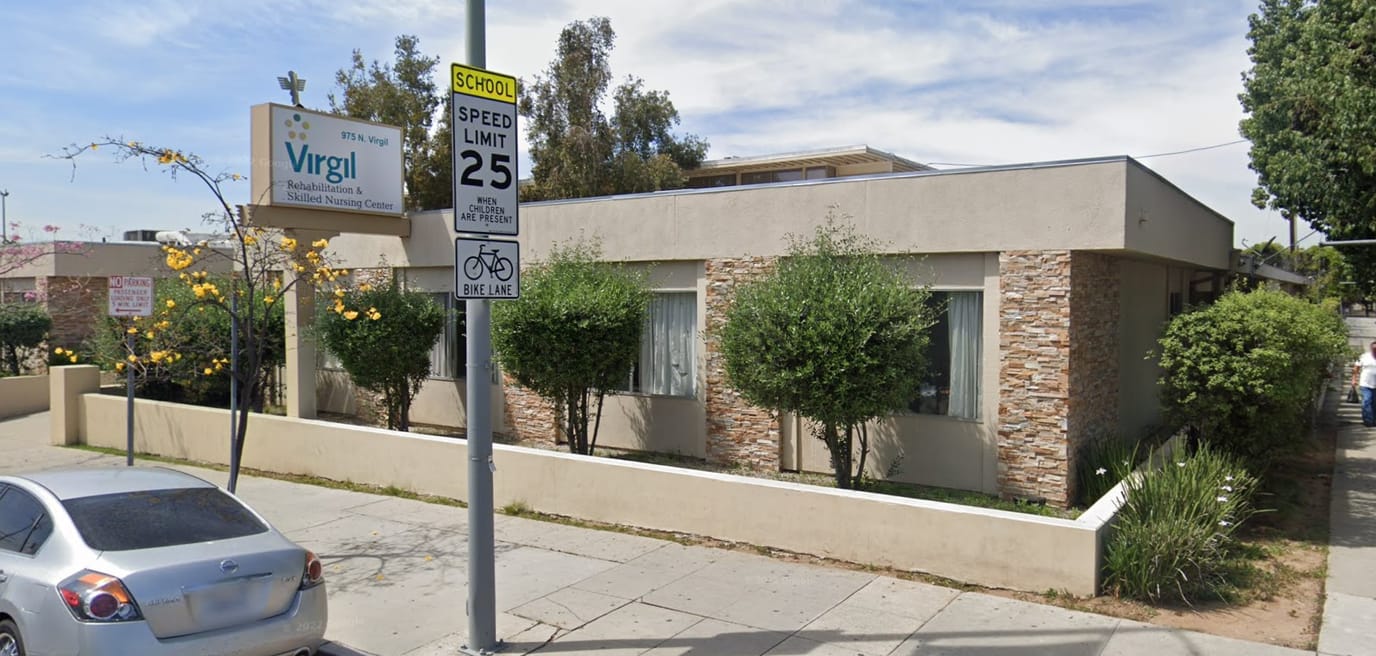
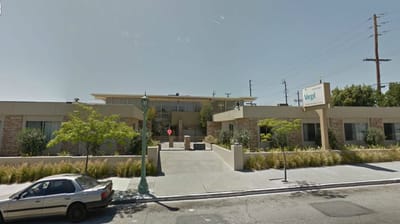
Virgil Rehabilitation & Skilled Nursing Center is a skilled nursing facility located at 975 North Virgil Avenue in Los Angeles, California. Co-owned by Rushabh Modi and Shruti Modi, the two-story building features 124 beds and currently runs at roughly 62 percent occupancy.
The center serves both short-term rehabilitation and long-term nursing residents, with an average length of stay of 198 days. On-site clinical services include hemodialysis, medical rehabilitation, dietary support, and structured discharge planning. Nursing staff are available around the clock, providing an average of 4 hours and 22 minutes of direct hands-on care per resident daily.
The property accepts Medicare, Medicaid, and private pay. Located in a walker’s paradise with a walk score of 92, the facility sits approximately half a mile from Hollywood Presbyterian Medical Center, making nearby errands and visits convenient without a vehicle.
Interested individuals can contact the North Virgil Avenue administrative office directly to learn about therapy scheduling, care costs, or to arrange a personal visit.
Staffing hours
![]() Daily nursing hours per resident by staff type, reported to CMS. Higher is generally better — compare this facility to state and national averages to see where staffing stands.
Daily nursing hours per resident by staff type, reported to CMS. Higher is generally better — compare this facility to state and national averages to see where staffing stands.
Hours per resident per day vs California averages
Total nursing care
![]() This home is ranked 85th out of 289 homes in California for nurse hours. Total adjusted nursing hours per resident per day, combining RN, LPN, and aide time. CMS adjusts this for case-mix so facilities can be fairly compared.
This home is ranked 85th out of 289 homes in California for nurse hours. Total adjusted nursing hours per resident per day, combining RN, LPN, and aide time. CMS adjusts this for case-mix so facilities can be fairly compared.
4h 22m
3% above state avg3 of 6 metrics below state avg
Reporting period: October 1 – December 31, 2025 (Q4 2025). Source: CMS Payroll-Based Journal report.
Manages medical care and health needs.
Assists with medical care and medications.
Helps with daily care and mobility.
Total hours from contractors
2,653 contractor hours this quarter
| Certified Nursing Assistant | 47 | 21 | 68 | 22,165 | 92 | 100% | 7.8 |
| Licensed Practical Nurse | 17 | 24 | 41 | 8,097 | 92 | 100% | 8.1 |
| Registered Nurse | 10 | 9 | 19 | 2,573 | 92 | 100% | 7.8 |
| RN Director of Nursing | 2 | 0 | 2 | 985 | 64 | 70% | 7.9 |
| Other Dietary Services Staff | 2 | 0 | 2 | 824 | 84 | 91% | 8 |
| Dietitian | 1 | 0 | 1 | 555 | 69 | 75% | 8 |
| Dental Services Staff | 1 | 0 | 1 | 547 | 63 | 68% | 8.7 |
| Respiratory Therapy Technician | 3 | 0 | 3 | 495 | 64 | 70% | 7.5 |
| Administrator | 1 | 0 | 1 | 480 | 60 | 65% | 8 |
| Nurse Practitioner | 2 | 0 | 2 | 456 | 57 | 62% | 8 |
| Mental Health Service Worker | 1 | 0 | 1 | 445 | 57 | 62% | 7.8 |
| Physical Therapy Assistant | 3 | 0 | 3 | 402 | 82 | 89% | 3.2 |
| Therapeutic Recreation Specialist | 1 | 0 | 1 | 264 | 60 | 65% | 4.4 |
| Occupational Therapy Aide | 0 | 1 | 1 | 96 | 18 | 20% | 5.3 |
| Qualified Social Worker | 1 | 0 | 1 | 68 | 17 | 18% | 4 |
| Speech Language Pathologist | 1 | 0 | 1 | 65 | 17 | 18% | 3.8 |
| Clinical Nurse Specialist | 1 | 0 | 1 | 52 | 13 | 14% | 4 |
| Occupational Therapy Assistant | 0 | 1 | 1 | 24 | 3 | 3% | 8 |
| Medical Director | 0 | 1 | 1 | 2 | 1 | 1% | 2 |
Includes penalties issued in 2025
Federal penalties imposed by CMS for regulatory violations, including civil money penalties (fines) and denials of payment for new Medicare/Medicaid admissions.
Source: CMS Penalties Database (Data as of Jan 2026)
California average: $55K
California average: 2.4
California average: 0.5
Penalties are imposed by CMS for violations of federal nursing home regulations.
1 penalty in the past 3 years
Jul 29, 2025 · 55 days
Last updated: Jan 2026
These measures show how residents usually do over time at this home, based on health outcomes and preventive care.
California average: 6.6
California average: 11.3
California average: 11.1%
California average: 12.0%
California average: 11.3%
California average: 1.7%
California average: 5.0%
California average: 1.2%
California average: 4.2%
California average: 6.7%
California average: 10.1%
California average: 98.5%
California average: 98.2%
California average: 2.25
California average: 1.59
California average: 94.0%
California average: 1.5%
California average: 93.2%
California average: 0.8%
Quality measures are calculated from Minimum Data Set (MDS) assessments. For most measures, lower percentages indicate better care quality.
28% of new residents, usually for short-term rehab.
69% of new residents, often for short stays.
3% of new residents, often for long-term daily care.
Source: CMS Long-Term Care Facility Characteristics (Data as of Jan 2026)
Residents meet regularly to discuss policies, care quality, and activities
Organized group of residents that meets regularly to discuss facility policies, quality of life, and activities.
Data sourced from CMS Long-Term Care Facility Characteristics quarterly report. Payer mix reflects the current resident census by primary payment source.
Historical financial and operational data for Virgil Rehabilitation & Skilled Nursing Center from 2011–2023, based on CMS SNF Cost Reports.
Key figures below are for fiscal year ending in 12/2023.
Based on CMS SNF Cost Report for fiscal year ending in 12/2023.
No pets allowed
Building Type: Two-story
Residents typically stay for brief periods, with frequent admissions and discharges throughout the year.
Most new residents arrive under private pay (69% of admissions), and a typical private pay stay runs around 7 - 8 months.
Coverage residents most often arrive under.
Coverage residents most often leave under.
![]() 4.3 miles from city center
4.3 miles from city center
![]() Estimated distance in miles from Los Angeles's city center to Virgil Rehabilitation & Skilled Nursing Center's address, calculated via Google Maps.
— 0.51 miles to nearest hospital (Hollywood Presbyterian Medical Center)
Estimated distance in miles from Los Angeles's city center to Virgil Rehabilitation & Skilled Nursing Center's address, calculated via Google Maps.
— 0.51 miles to nearest hospital (Hollywood Presbyterian Medical Center)
Add your location
Info below is compiled from CMS reports & the CA Dept. of Social Services (CDSS), senior community websites & trusted data sources such as Walk Score & BBB.
Communities are listed from highest to lowest based on our ranking methodology.
| Angels Nursing Center | NH SNF | Los Angeles (Westlake) | 41
Facility
41
CA AVG
104
Rank
#1196 / 1646 |
90.2%
Facility
90.2%
CA AVG
73.9
Rank
#338 / 1492 | +22% | 4.73
Facility
4.73
CA AVG
4.22
Rank
#53 / 289 | -54% | +12% | $71.6k
Facility
$71.6k
CA AVG
$56.5k
Rank
#267 / 294 | 60
Facility
60
CA AVG
81
Rank
#1332 / 1475 | 42
Facility
42
CA AVG
50.2
Rank
#151 / 291 | 3.8
Facility
3.8
CA AVG
4.6
Rank
#129 / 291 | 4 | 37 | A+ |
92
Facility
92
CA AVG
59
Rank
#137 / 2058 | Aret Akian | $5.8MFiscal year ending 12/2023
Facility
$5.8MFiscal year ending 12/2023
CA AVG
$15.7M
Rank
#251 / 260 | $3.8MFiscal year ending 12/2023
Facility
$3.8MFiscal year ending 12/2023
CA AVG
$8.9M
Rank
#246 / 260 | 65.6%Fiscal year ending 12/2023
Facility
65.6%Fiscal year ending 12/2023
CA AVG
61.1%
Rank
#44 / 260 | 55704 | ||||
| Palazzo Post Acute | NH SNF | Los Angeles (East Hollywood) | 99
Facility
99
CA AVG
104
Rank
#725 / 1646 |
94.0%
Facility
94.0%
CA AVG
73.9
Rank
#237 / 1492 | +27% | 4.46
Facility
4.46
CA AVG
4.22
Rank
#73 / 289 | -25% | +6% | $0
Facility
$0
CA AVG
$56.5k
Rank
#1 / 294 | 62
Facility
62
CA AVG
81
Rank
#1297 / 1475 | 47
Facility
47
CA AVG
50.2
Rank
#173 / 291 | 2.5
Facility
2.5
CA AVG
4.6
Rank
#29 / 291 | 1 | 93 | A+ |
91
Facility
91
CA AVG
59
Rank
#155 / 2058 | Serrano Licensee 1 LLC | $13.0MFiscal year ending 12/2023
Facility
$13.0MFiscal year ending 12/2023
CA AVG
$15.7M
Rank
#147 / 260 | $8.5MFiscal year ending 12/2023
Facility
$8.5MFiscal year ending 12/2023
CA AVG
$8.9M
Rank
#125 / 260 | 65.1%Fiscal year ending 12/2023
Facility
65.1%Fiscal year ending 12/2023
CA AVG
61.1%
Rank
#46 / 260 | 56456 | ||||
| Hollenbeck Palms | NH AL IL MC SNF | Los Angeles (Central La) | 185
Facility
185
CA AVG
104
Rank
#196 / 1646 |
85.4%
Facility
85.4%
CA AVG
73.9
Rank
#443 / 1492 | +16% | 4.84
Facility
4.84
CA AVG
4.22
Rank
#44 / 289 | -11% | +15% | $0
Facility
$0
CA AVG
$56.5k
Rank
#1 / 294 | 89
Facility
89
CA AVG
81
Rank
#521 / 1475 | 39
Facility
39
CA AVG
50.2
Rank
#137 / 291 | 6.5
Facility
6.5
CA AVG
4.6
Rank
#256 / 291 | 1 | 158 | - | 62 | Casey Adams | $21.4MFiscal year ending 06/2024
Facility
$21.4MFiscal year ending 06/2024
CA AVG
$15.7M
Rank
#55 / 260 | $15.8MFiscal year ending 06/2024
Facility
$15.8MFiscal year ending 06/2024
CA AVG
$8.9M
Rank
#21 / 260 | 73.6%Fiscal year ending 06/2024
Facility
73.6%Fiscal year ending 06/2024
CA AVG
61.1%
Rank
#25 / 260 | 55115 | ||||
| Fountainview at Eisenberg Village | NH AL IL SNF | Reseda | 216
Facility
216
CA AVG
104
Rank
#127 / 1646 |
48.1%
Facility
48.1%
CA AVG
73.9
Rank
#1350 / 1492 | -35% | 2.96
Facility
2.96
CA AVG
4.22
Rank
#287 / 289 | +1% | -30% | $0
Facility
$0
CA AVG
$56.5k
Rank
#1 / 294 | 89
Facility
89
CA AVG
81
Rank
#521 / 1475 | 66
Facility
66
CA AVG
50.2
Rank
#236 / 291 | 3.9
Facility
3.9
CA AVG
4.6
Rank
#136 / 291 | - | 104 | - | 49 | Karen Pham | $16.7MFiscal year ending 12/2023
Facility
$16.7MFiscal year ending 12/2023
CA AVG
$15.7M
Rank
#96 / 260 | $8.5MFiscal year ending 12/2023
Facility
$8.5MFiscal year ending 12/2023
CA AVG
$8.9M
Rank
#126 / 260 | 50.6%Fiscal year ending 12/2023
Facility
50.6%Fiscal year ending 12/2023
CA AVG
61.1%
Rank
#176 / 260 | 555716 | ||||
| Virgil Rehabilitation & Skilled Nursing Center | NH SNF | Los Angeles (East Hollywood) | 124
Facility
124
CA AVG
104
Rank
#539 / 1646 |
61.9%
Facility
61.9%
CA AVG
73.9
Rank
#1160 / 1492 | -16% | 4.36
Facility
4.36
CA AVG
4.22
Rank
#85 / 289 | +42% | +3% | $0
Facility
$0
CA AVG
$56.5k
Rank
#1 / 294 | - | 53
Facility
53
CA AVG
50.2
Rank
#197 / 291 | 4.8
Facility
4.8
CA AVG
4.6
Rank
#193 / 291 | 3 | 77 | - |
92
Facility
92
CA AVG
59
Rank
#137 / 2058 | Rushabh Modi | $7.1MFiscal year ending 12/2023
Facility
$7.1MFiscal year ending 12/2023
CA AVG
$15.7M
Rank
#236 / 260 | $6.7MFiscal year ending 12/2023
Facility
$6.7MFiscal year ending 12/2023
CA AVG
$8.9M
Rank
#173 / 260 | 93.7%Fiscal year ending 12/2023
Facility
93.7%Fiscal year ending 12/2023
CA AVG
61.1%
Rank
#16 / 260 | 55157 |
Virgil Rehabilitation & Skilled Nursing Center is located in Los Angeles, California.
Here are the financial assistance programs available to residents in California.
Virgil Rehabilitation & Skilled Nursing Center is in the East Hollywood neighborhood.
Virgil Rehabilitation & Skilled Nursing Center has a walk score of 92. Walker's paradise. Daily errands do not require a car, with many shops and services nearby.
Virgil Rehabilitation & Skilled Nursing Center's occupancy is 53.2%.
No, Virgil Rehabilitation & Skilled Nursing Center has a no-pet policy.
Virgil Rehabilitation & Skilled Nursing Center is registered as a for-profit.
Yes — there are 2 photos of Virgil Rehabilitation & Skilled Nursing Center in the photo gallery on this page.
Virgil Rehabilitation & Skilled Nursing Center is located at 975 Virgil Ave, Los Angeles, CA 90029.
Care Cost Calculator: See Prices in Your Area
Nursing Home Data Explorer
Don’t Wait Too Long: 7 Red Flag Signs Your Parent Needs Assisted Living Now
The True Cost of Assisted Living in 2025 – And How Families Are Paying For It
Understanding Senior Living Costs: Pricing Models, Discounts & Financial Assistance


