Occupancy rate
69%
California average: 73%

We arrange tours, appointments, and even moving support so you don’t have to
Thank you for your interest!
Our team will be in touch shortly to help with next steps.
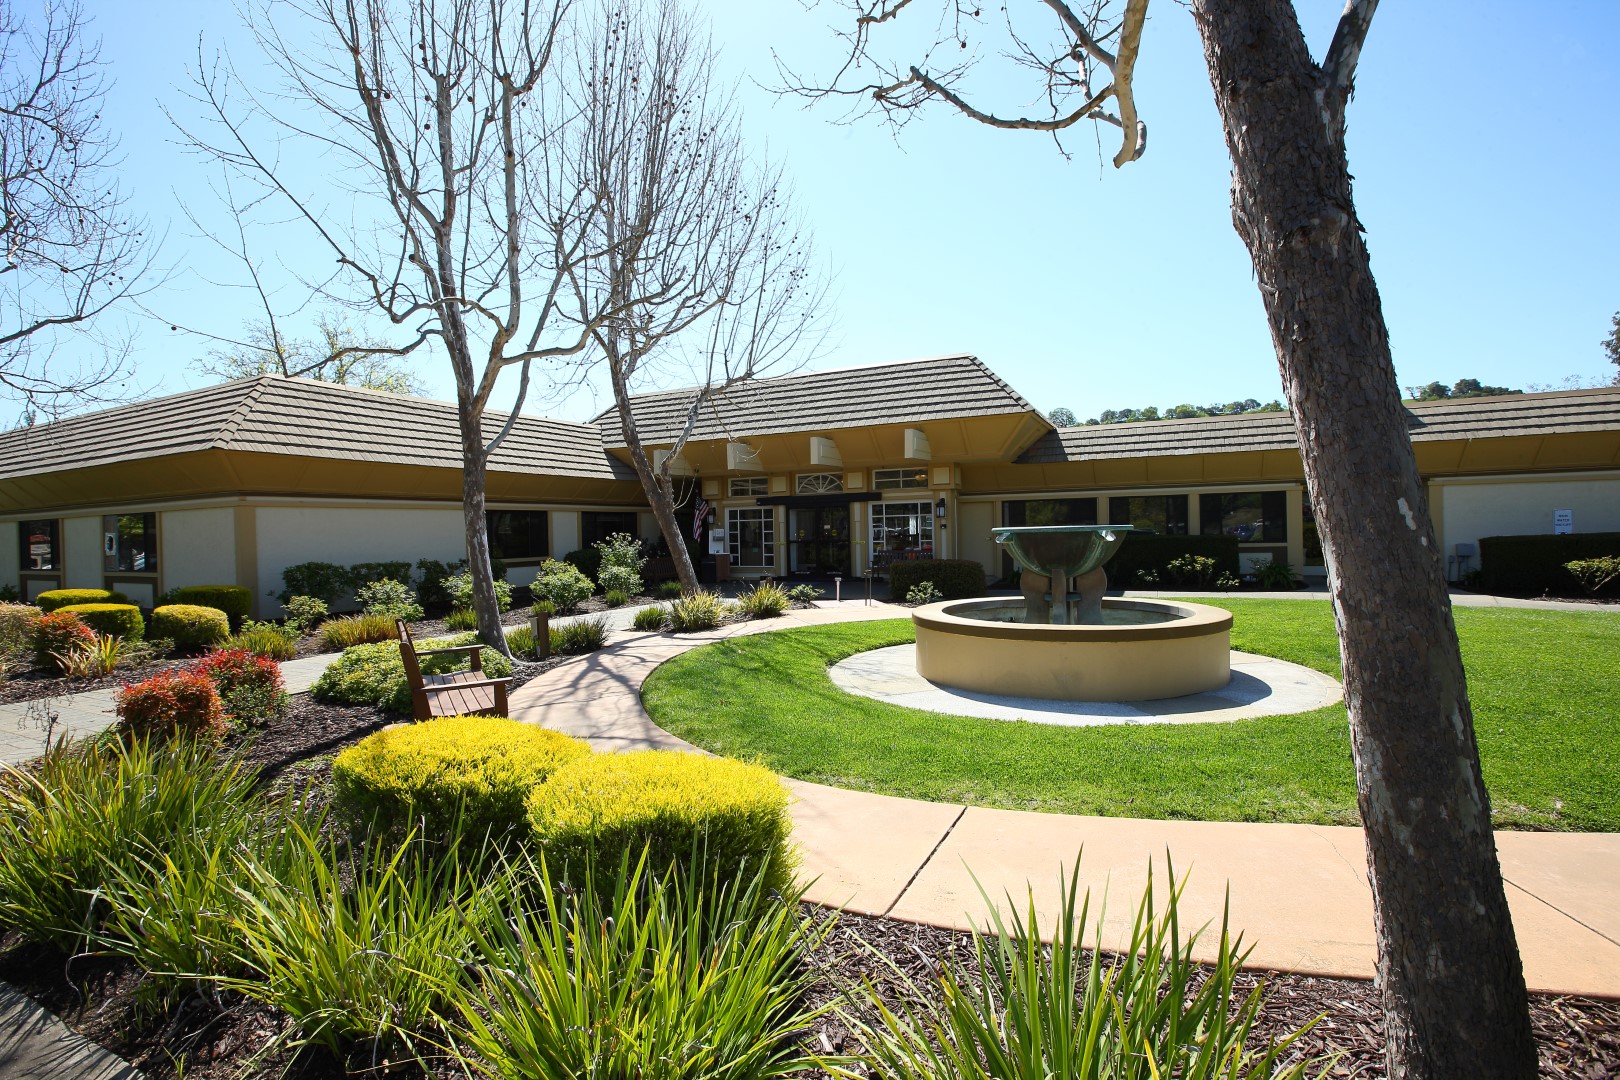
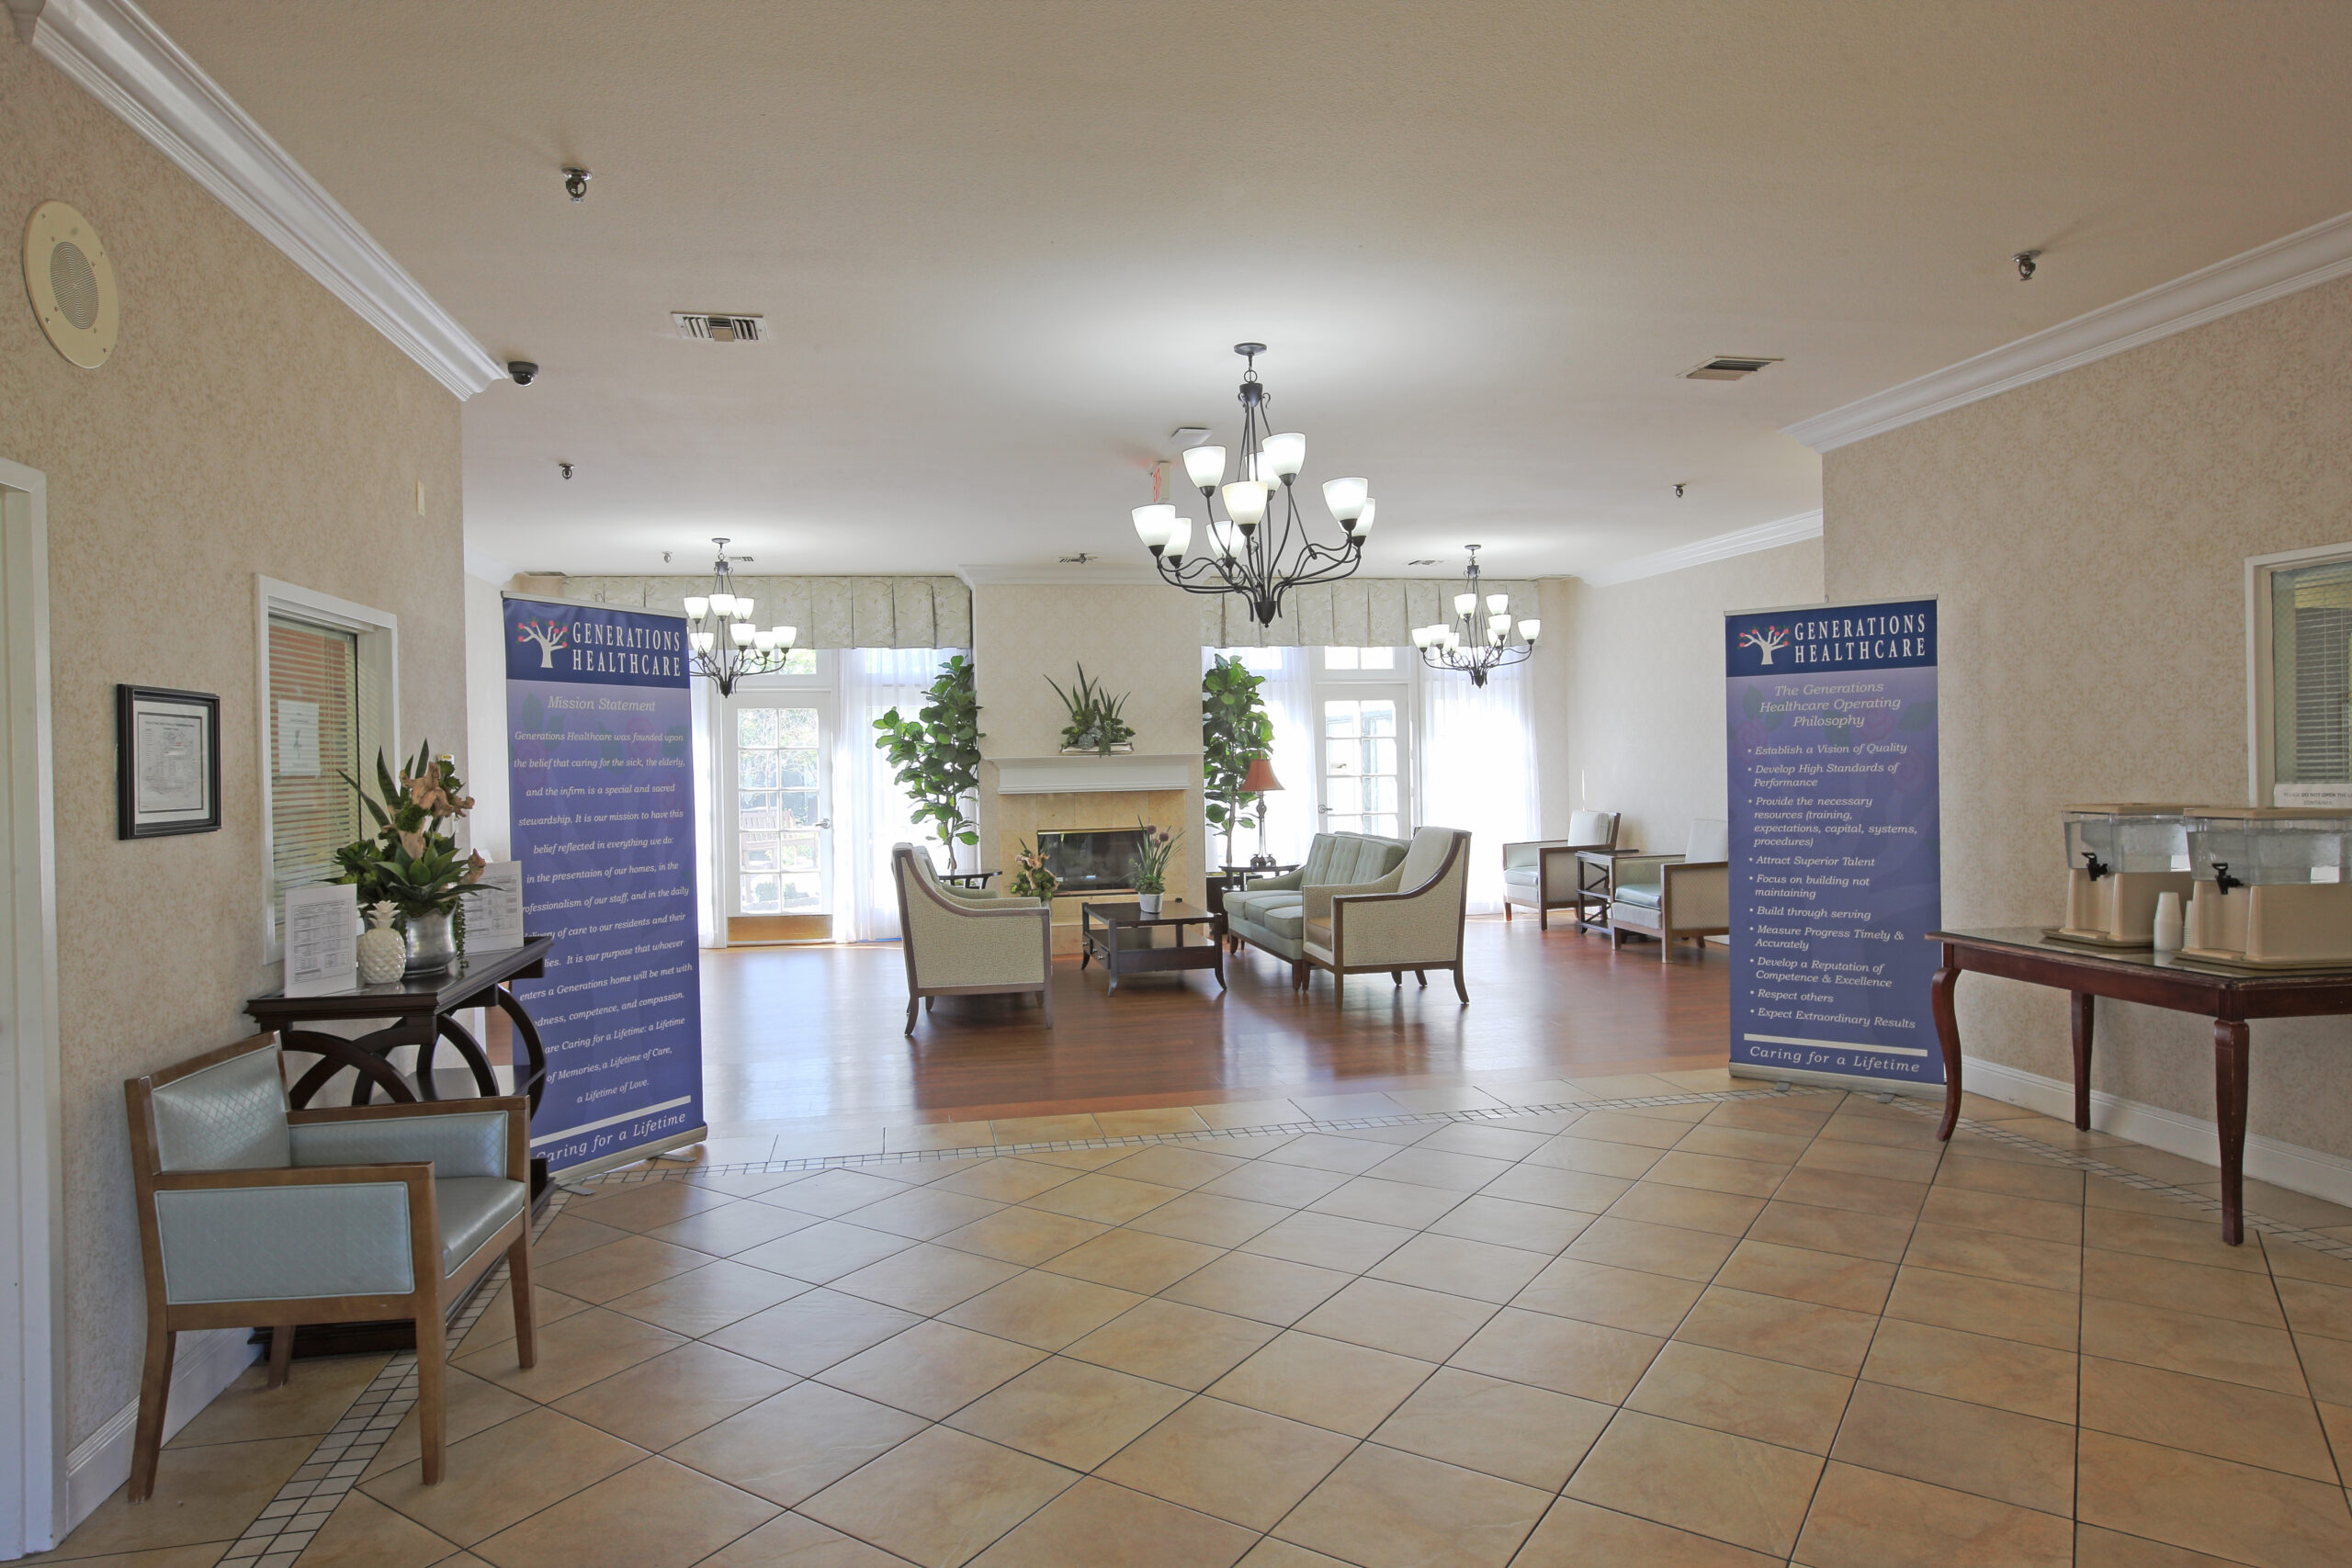
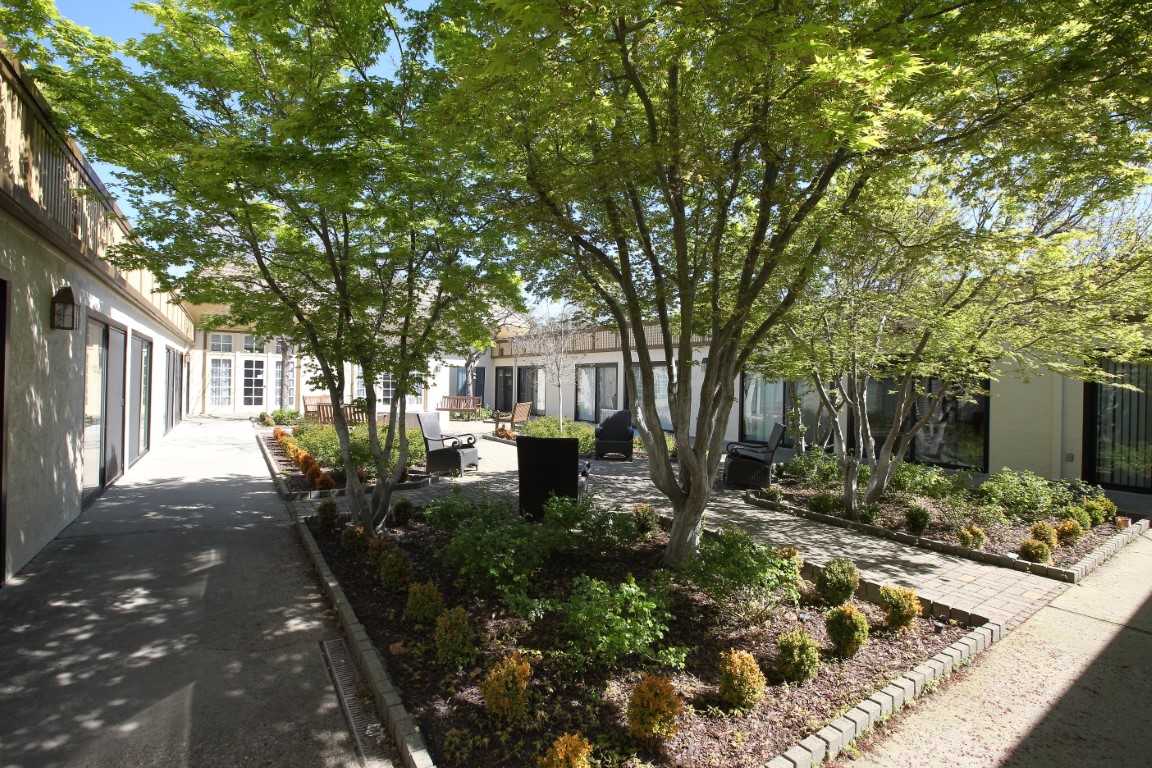
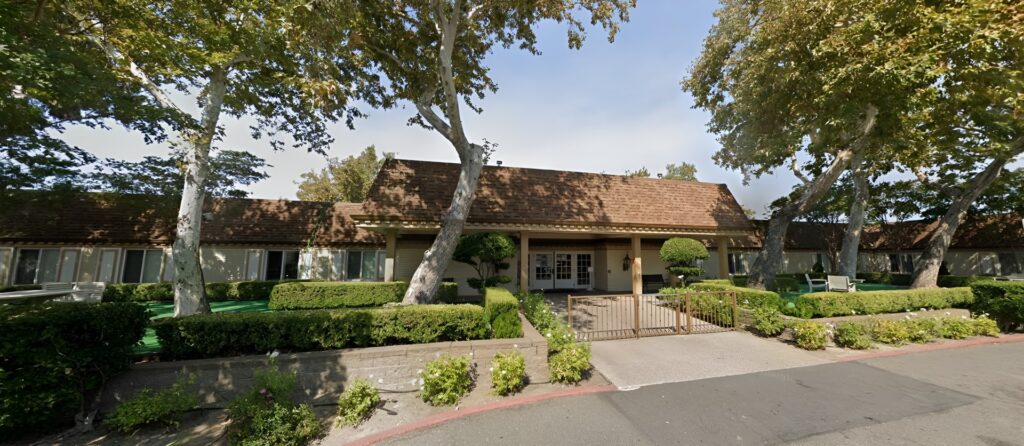
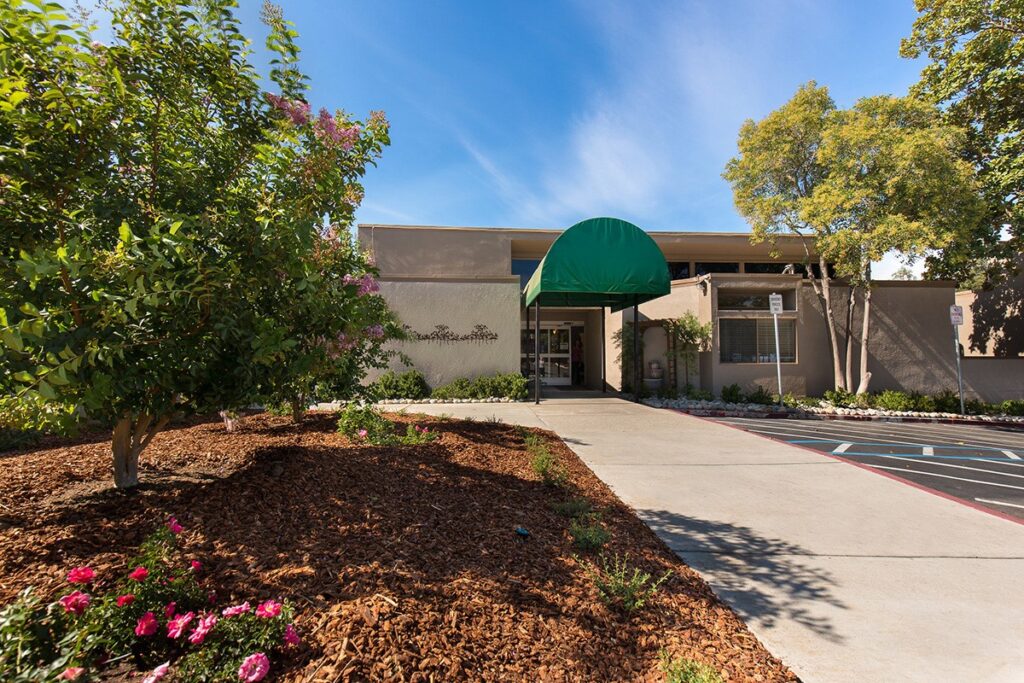
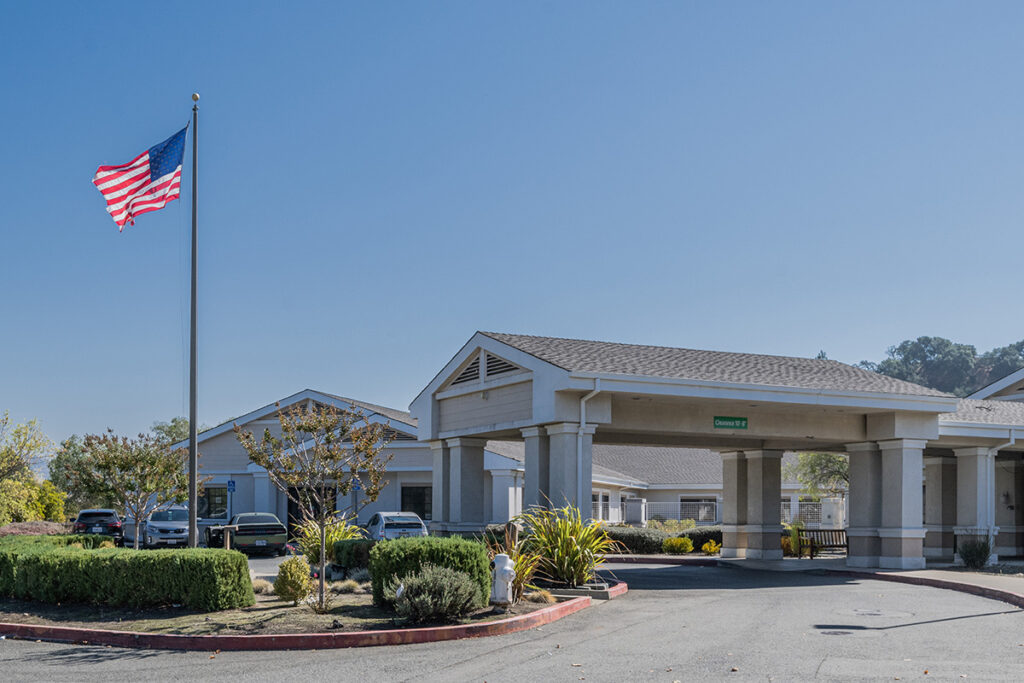
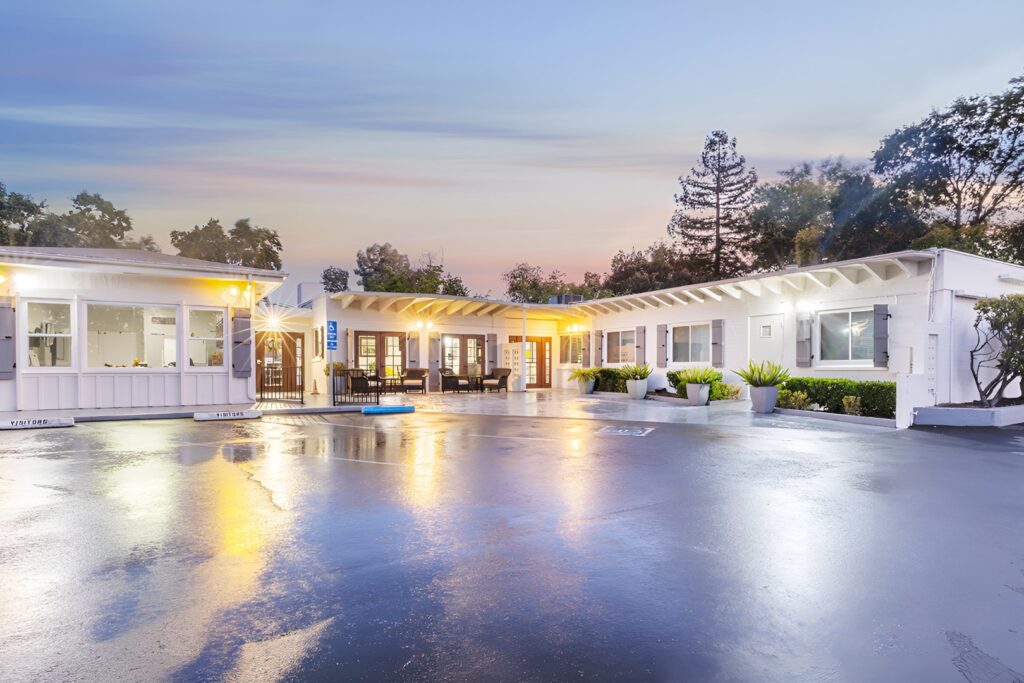
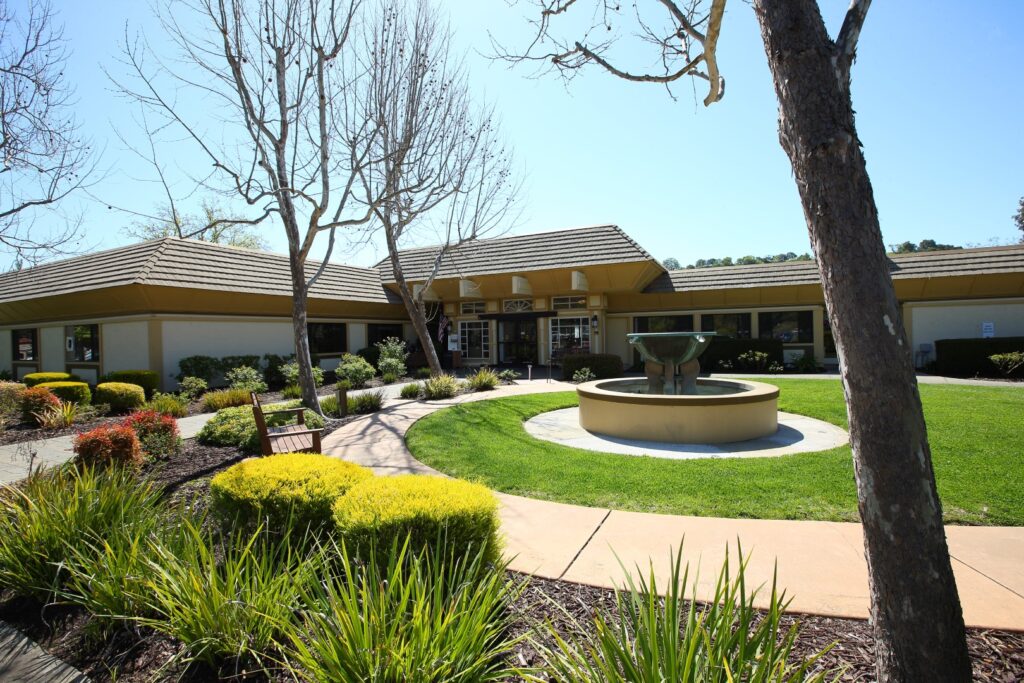
Surrounded by delightful local amenities in Rossmoor Parkway, Walnut Creek, CA, Walnut Creek Skilled Nursing & Rehabilitation Center is an esteemed community that offers skilled nursing, rehabilitation, and sub-acute care. Dedicated to improving residents’ well-being, the community provides exceptional care 24/7 with a compassionate and highly qualified team. Residents can rest their worries and meet their complex needs with the community’s clinical capabilities provided in a cozy and nurturing environment.
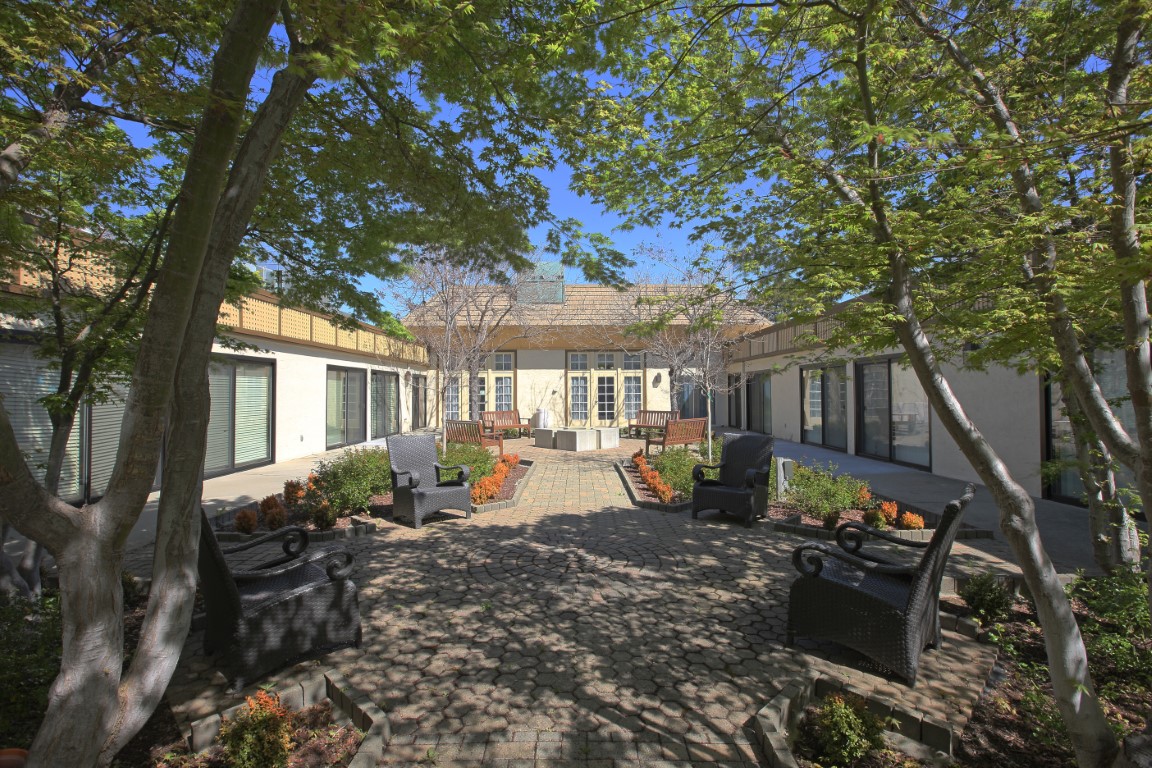
Residents’ holistic wellness is prioritized, conducting fun recreational activities and enriching programs to keep them physically active and socially engaged. Mealtimes are also something to look forward to, with delightful and healthy meals that cater to their dietary needs and preferences. The community is an enticing option for those seeking exceptional care for their unique needs, especially with its top-notch services and purposely designed amenities.
Offers a balance of services and community atmosphere.
Lower occupancy suggests more openings may be available.
Residents typically stay for brief periods, with frequent admissions and discharges throughout the year.
15% of new residents, usually for short-term rehab.
81% of new residents, often for short stays.
4% of new residents, often for long-term daily care.
California average: 73%
Walnut Creek Skilled Nursing & Rehabilitation Center is legally operated by Wg Valley View Sh Lp; Atria Management Co Llc.
Accept Medicaid: Yes
Total Residents: 154 Residents
Housing Options: Private / Semi-Private Rooms
Building Type: Single-story
Dining Services
Beauty Services
In California, the Department of Social Services (for assisted living facilities) and the Department of Public Health (for nursing homes) conduct inspections to ensure resident safety and regulatory compliance.
California average: 16 visits
8 total complaint visits
9 other visits
![]() Other visits include regulatory visits that are not routine inspections or complaint investigations, such as administrative check-ins, follow-up reviews, or licensing-related visits.
Other visits include regulatory visits that are not routine inspections or complaint investigations, such as administrative check-ins, follow-up reviews, or licensing-related visits.
13 total complaint visits
7 other visits
Investigations can have many visits.
California average: 10 complaint investigations
California average: 4 official inspections
A violation that poses an immediate risk to resident health or safety, or represents a substantial failure to comply with licensing requirements.
California average: 3 serious citations
A violation that does not pose an immediate risk to resident health or safety but requires correction to remain in compliance.
California average: 4 moderate citations
Deficiencies indicate regulatory issues. A higher number implies the facility had several areas requiring improvement.
California average: 8 deficiencies
Most inspections found no deficiencies, with the facility consistently meeting licensing requirements and maintaining proper safety, medication storage, and emergency preparedness. Several complaint investigations were unsubstantiated, including allegations about inadequate food service, staffing, and resident care. The only substantiated issues occurred in October 2021, when a staff member verbally abused a resident and the facility failed to report suspected abuse promptly; no fines or enforcement actions were listed in the available reports. Since then, inspections have been clean, including the most recent annual inspection on May 23, 2025, which had no deficiencies. This indicates improvement and a stable compliance record over time.
California average 12.5
Last Health inspection on Jun 2025
California average 50.2
California average 4.65
Health citations are formal notices following inspections when they fail to comply with safety and care standards.
30 of 54 citations resulted from standard inspections; 21 of 54 resulted from complaint investigations; and 3 of 54 came from combined inspections (standard and complaint).
California average: 0.4
California average: 1
Data sourced from CMS Health Deficiencies reports. Citation severity codes range from A (least serious) to L (most serious). Immediate Jeopardy (J-L) citations indicate situations where the facility's noncompliance has placed residents at risk of death or serious harm.
Memory Care Secured, specialized care for people living with Alzheimer's or dementia. Staff trained in cognitive impairment, with higher staff-to-resident ratios and an environment designed to reduce confusion and wandering risk.
Nursing Home Licensed facility providing 24/7 skilled nursing care for residents with complex, ongoing medical needs. Staffed by RNs, LPNs, and CNAs. Inspected and star-rated annually by CMS. Accepts Medicare (short-term rehab) and Medicaid (long-term care).
Nursing Home Licensed facility providing 24/7 skilled nursing care for residents with complex, ongoing medical needs. Staffed by RNs, LPNs, and CNAs. Inspected and star-rated annually by CMS. Accepts Medicare (short-term rehab) and Medicaid (long-term care).
Nursing Home Licensed facility providing 24/7 skilled nursing care for residents with complex, ongoing medical needs. Staffed by RNs, LPNs, and CNAs. Inspected and star-rated annually by CMS. Accepts Medicare (short-term rehab) and Medicaid (long-term care).
Nursing Home Licensed facility providing 24/7 skilled nursing care for residents with complex, ongoing medical needs. Staffed by RNs, LPNs, and CNAs. Inspected and star-rated annually by CMS. Accepts Medicare (short-term rehab) and Medicaid (long-term care).
Nursing Home Licensed facility providing 24/7 skilled nursing care for residents with complex, ongoing medical needs. Staffed by RNs, LPNs, and CNAs. Inspected and star-rated annually by CMS. Accepts Medicare (short-term rehab) and Medicaid (long-term care).
![]() 4.2 miles from city center
4.2 miles from city center
![]() 1224 Rossmoor Pkwy, Walnut Creek, CA 94595
1224 Rossmoor Pkwy, Walnut Creek, CA 94595
Add your location
This data corresponds to Q2 2025 and is based on CMS Payroll-Based Journal.
California average ratio: 0.00:1
California average: 7.7 hours
Manages medical care and health needs.
No contractors work on this role.
Assists with medical care and medications.
No contractors work on this role.
Helps with daily care and mobility.
No contractors work on this role.
Total hours from contractors
0 contractor hours this quarter
No contractor roles were reported this quarter.
| Certified Nursing Assistant | 89 | 0 | 89 | 30,064 | 91 | 100% | 7.4 |
| Licensed Practical Nurse | 63 | 0 | 63 | 23,239 | 91 | 100% | 8.5 |
| Registered Nurse | 26 | 0 | 26 | 8,652 | 91 | 100% | 9.4 |
| Qualified Activities Professional | 22 | 0 | 22 | 6,802 | 91 | 100% | 9.4 |
| RN Director of Nursing | 8 | 0 | 8 | 3,179 | 68 | 75% | 8 |
| Other Dietary Services Staff | 6 | 0 | 6 | 2,237 | 91 | 100% | 8.1 |
| Physical Therapy Assistant | 5 | 0 | 5 | 2,037 | 83 | 91% | 7.4 |
| Respiratory Therapy Technician | 5 | 0 | 5 | 1,041 | 75 | 82% | 6.6 |
| Occupational Therapy Aide | 2 | 0 | 2 | 1,000 | 64 | 70% | 8 |
| Dental Services Staff | 2 | 0 | 2 | 832 | 78 | 86% | 7.6 |
| Speech Language Pathologist | 4 | 0 | 4 | 789 | 71 | 78% | 7.1 |
| Clinical Nurse Specialist | 3 | 0 | 3 | 720 | 65 | 71% | 8 |
| Administrator | 1 | 0 | 1 | 512 | 64 | 70% | 8 |
| Mental Health Service Worker | 1 | 0 | 1 | 496 | 62 | 68% | 8 |
| Nurse Practitioner | 1 | 0 | 1 | 480 | 60 | 66% | 8 |
| Qualified Social Worker | 2 | 0 | 2 | 477 | 67 | 74% | 7.1 |
| Therapeutic Recreation Specialist | 1 | 0 | 1 | 412 | 55 | 60% | 7.5 |
| Diagnostic X-ray Services Staff | 1 | 0 | 1 | 336 | 42 | 46% | 8 |
| Dietitian | 1 | 0 | 1 | 95 | 13 | 14% | 7.3 |
| Physical Therapy Aide | 1 | 0 | 1 | 74 | 12 | 13% | 6.1 |
Source: CMS Long-Term Care Facility Characteristics (Data as of Jan 2026)
Residents meet regularly to discuss policies, care quality, and activities
Organized group of residents that meets regularly to discuss facility policies, quality of life, and activities.
Data sourced from CMS Long-Term Care Facility Characteristics quarterly report. Payer mix reflects the current resident census by primary payment source.
These measures show how residents usually do over time at this home, based on health outcomes and preventive care.
California average: 6.6
California average: 11.3
California average: 11.1%
California average: 12.0%
California average: 11.3%
California average: 1.7%
California average: 5.0%
California average: 1.2%
California average: 4.2%
California average: 6.7%
California average: 10.1%
California average: 98.5%
California average: 98.2%
California average: 2.25
California average: 1.59
California average: 94.0%
California average: 1.5%
California average: 93.2%
California average: 23.2%
California average: 11.2%
California average: 0.8%
California average: 53.7%
California average: 50.6%
Quality measures are calculated from Minimum Data Set (MDS) assessments. For most measures, lower percentages indicate better care quality.
Historical financial and operational data for Walnut Creek Skilled Nursing & Rehabilitation Center based on CMS SNF Cost Reports.
Loading trend charts...
Care Cost Calculator: See Prices in Your Area
Nursing Home Data Explorer
Don’t Wait Too Long: 7 Red Flag Signs Your Parent Needs Assisted Living Now
The True Cost of Assisted Living in 2025 – And How Families Are Paying For It
Understanding Senior Living Costs: Pricing Models, Discounts & Financial Assistance

Touring a community? Use this expert-backed checklist to stay organized, ask the right questions, and find the perfect fit.
We'll send you a PDF version of the touring checklist.