Warwick Forest
Nursing Home, Assisted Living, Independent Living & Memory Care · Newport News, VA
CMS overall rating Info CMS (the Centers for Medicare & Medicaid Services) is the federal agency that rates nursing home quality. Its Overall Rating runs from 1 to 5 stars, combining health inspections, staffing, and quality measures, with inspections weighted most heavily.

Warwick Forest

Nursing Home, Assisted Living, Independent Living & Memory Care · Newport News, VA
CMS overall rating Info CMS (the Centers for Medicare & Medicaid Services) is the federal agency that rates nursing home quality. Its Overall Rating runs from 1 to 5 stars, combining health inspections, staffing, and quality measures, with inspections weighted most heavily.
Calculator: See prices in your area
Warwick Forest accepts Medicare, Medicaid, and private pay.

Overview of Warwick Forest

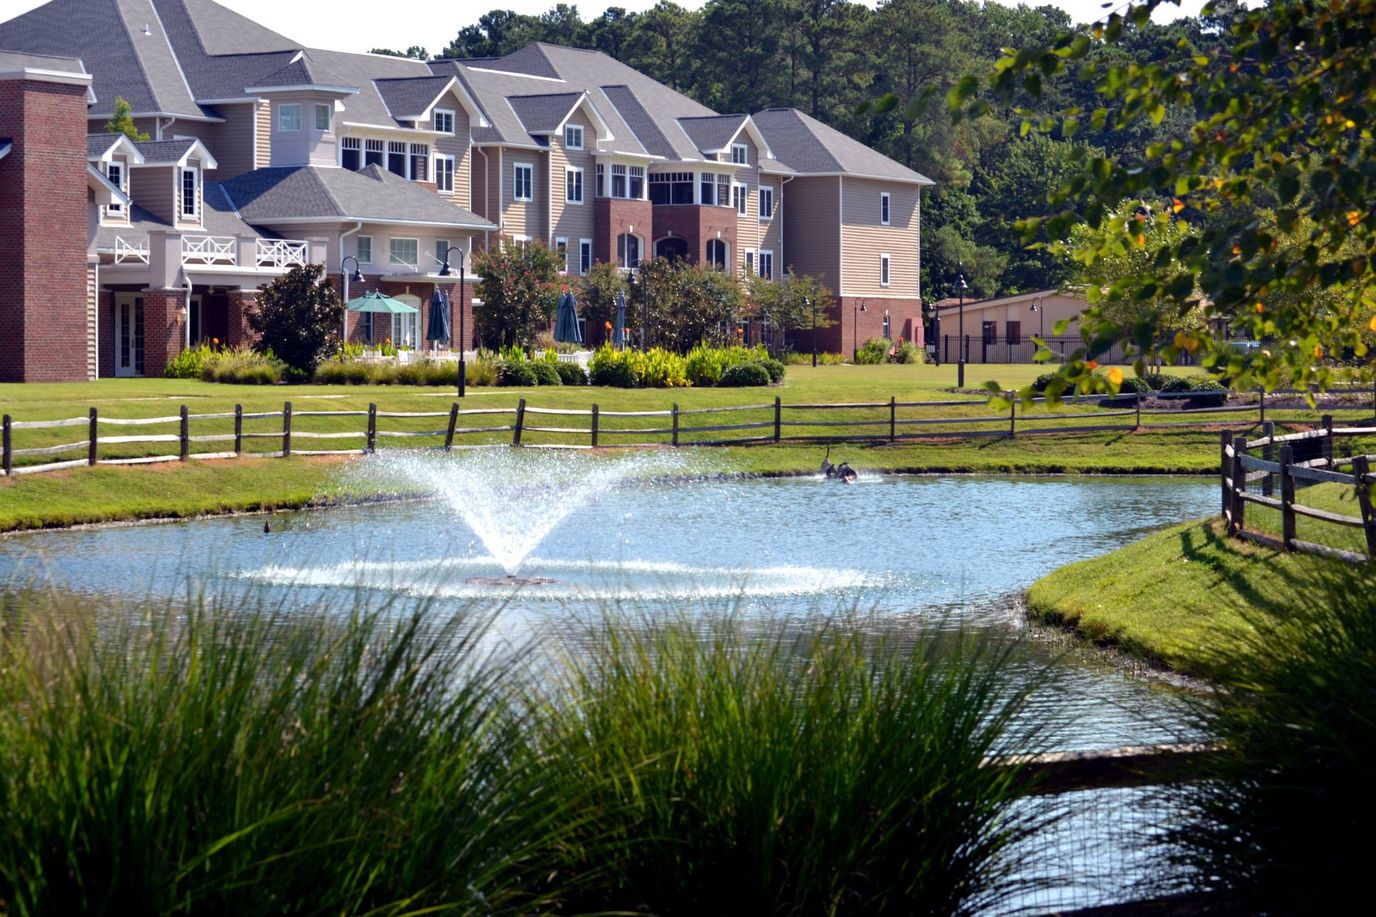
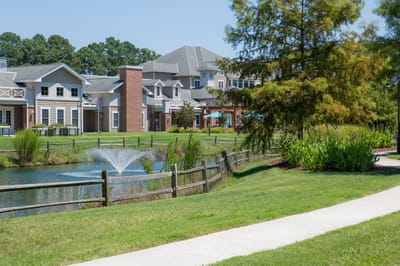
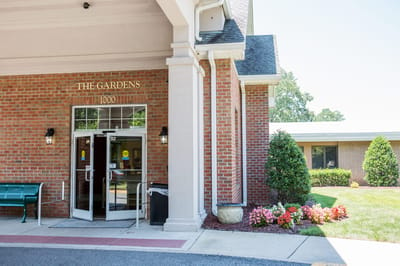
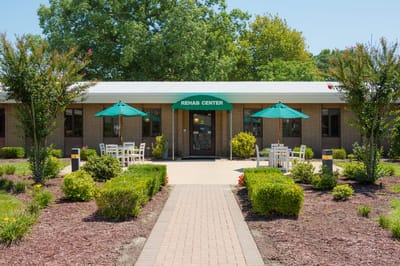
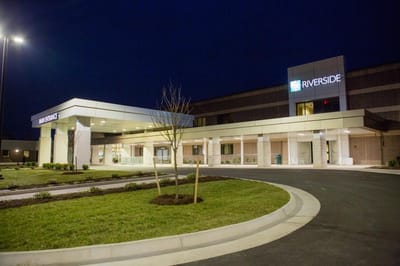
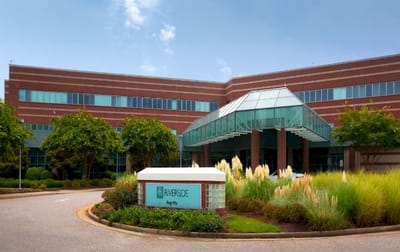
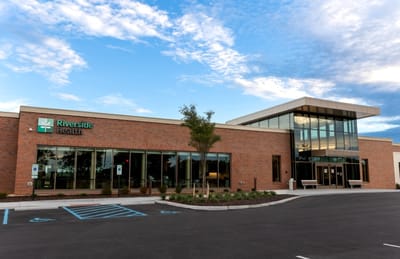
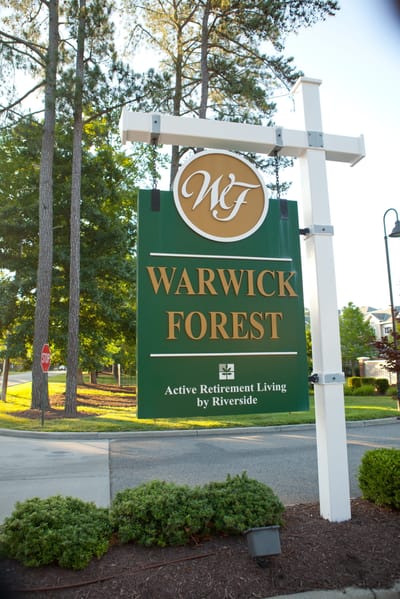
Warwick Forest is a continuing care retirement community in Newport News, Virginia, that offers a range of independent living options, including cottages and apartments. Beyond its exceptional amenities, Warwick Forest is a unique family of individuals, each contributing a distinctive story to the community. Celebrating diversity and fostering deep connections among neighbors, Warwick Forest takes pride in its inclusive and united environment.

Recognized for its unwavering commitment to enhancing residents’ quality of life, Warwick Forest has earned accreditation from the Commission on the Accreditation of Rehabilitation Facilities (CARF), a testament to its dedication and tireless efforts. Nestled along the Newport News and York County border, this community provides seniors with the perfect blend of tranquility and convenience, serving as a gateway to the best of both worlds. 

Quality ratings

Measured by Centers for Medicare & Medicaid Services (CMS)

Overall rating Info The Overall CMS Rating combines results from health inspections, staffing levels and quality measures. Health inspections carry the most weight. Staffing and quality scores can increase or decrease the final rating based on performance compared to state and national standards.
Health Inspection Info Based on the results of the facility's three most recent standard inspections and any complaint investigations. CMS reviews the number, scope, and severity of deficiencies, with more recent findings weighted more heavily.
Staffing Info Measures average nursing staff hours per resident per day, including Registered Nurses (RNs) and total nursing staff. Ratings are adjusted based on the level of care residents require and are compared to state and national benchmarks.
Quality Measures Info Based on clinical and physical health indicators reported to CMS, such as hospital readmissions, falls, pressure ulcers, and improvements in mobility. These measures reflect how well residents' health needs are being managed.

Staffing hours breakdown

Info Daily nursing hours per resident by staff type, reported to CMS. Higher is generally better — compare this facility to state and national averages to see where staffing stands.

Hours per resident per day — compared to state averages

Staff typeHours / Day / Residentvs state avg
Registered Nurse (RN) Info RNs hold the highest nursing license and can assess residents, interpret test results, and direct care plans. More RN hours per day often signals stronger clinical oversight and faster response to health changes. 32m per day
LPN / LVN Info Licensed Practical Nurses (LPNs) or Licensed Vocational Nurses (LVNs) deliver routine hands-on care — medication administration, wound dressing, and monitoring vital signs. They work under RN supervision and make up a large share of daily bedside care. 1h 4m per day
Nurse Aide Info Certified Nurse Aides (CNAs) provide the most direct day-to-day assistance: bathing, dressing, feeding, and mobility. Nurse aide hours are typically the largest staffing category and directly affect residents' quality of life. 1h 46m per day
Weekend Total Nursing Info Combined nursing hours (RN + LPN + Nurse Aide) per resident per day on weekends. Staffing often drops on weekends — this figure reveals whether the facility maintains adequate coverage outside of weekday hours. 2h 58m per day
Physical Therapist Info Hours per resident per day provided by licensed Physical Therapists (PTs) or PT Assistants. PT services help residents recover mobility after injury or illness and are especially important for post-acute (short-stay) rehabilitation. 3m per day
Weekend RN Info Registered nurse hours specifically on weekends. Facilities sometimes reduce RN presence on Saturdays and Sundays — a low weekend RN figure compared to weekday hours can indicate reduced clinical oversight when most administrative staff are absent. 21m per day

Capacity and availability

This home usually has limited availability

Similar occupancy to the state average
Occupancy rate
90.1% Rank #46 / 314Occupancy rate — State benchmarkedThis home is ranked 46th out of 314 homes in Virginia. Shows this facility's occupancy rate versus the Virginia average, with its Statewide rank out of 314. Higher occupancy signals strong local demand and financial stability.Rankings are based only on facilities in Virginia that report data for that category. Facilities without available data are excluded from the ranking.Click the rank badge to see the full State ranking.Click here to see the full State ranking.
Avg. Length of Stay
43 days
Bed community size
209-bed community Rank #17 / 371Bed count — State benchmarkedThis home is ranked 17th out of 371 homes in Virginia. Shows this facility's certified or reported bed count compared to other Virginia facilities. Larger communities may offer more amenities, programs, and on-site services for residents and families.Rankings are based only on facilities in Virginia that report data for that category. Facilities without available data are excluded from the ranking.Click the rank badge to see the full State ranking.Click here to see the full State ranking.
A large-scale community that may provide a wide range of amenities, services, and structured programs.
Walk Score
Walk Score: 12 / 100 Rank #398 / 449Walk Score — State benchmarkedThis home is ranked 398th out of 449 homes in Virginia. Shows how walkable this facility's neighborhood is compared to the average Walk Score across Virginia facilities. Higher scores benefit residents, families, and staff.Rankings are based only on facilities in Virginia that report data for that category. Facilities without available data are excluded from the ranking.Click the rank badge to see the full State ranking.Click here to see the full State ranking.
Car-dependent. Most errands require a car, with limited nearby walkable options.

About this community

Awards

AVP exemplary recognition seal for 2025

License Details

CMS Certification Number495071
CertificationsCARF
AccreditationsCARF

Ownership & Operating Entity

Profit StatusNonprofit

Therapy & Rehabilitation

3 services
Rehabilitation Services
Respite Care
Short-Term Rehab

Memory & Specialized Care

1 service
No Alzheimer's certification

Additional Services

1 service
Home Care

Amenities & Lifestyle

Fitness Center
Library
Spa
Garden
Specific ProgramsBack to Riverside Online
Touring HoursThursday 6:00 PM - 8:00 PM; Tuesday 1:00 PM - 2:30 PM; Tuesday 7:00 PM - 8:30 PM; Wednesday 6:00 PM - 7:15 PM

Pricing & Financial Information

Starting Price$5,234 - $7,579 per month
Starting Price$8,298 per month

Contact Warwick Forest

Health Inspection History

Inspections since 2018
Total health inspections 4

State average N/A


Last Health inspection on Aug 2025

Total health citations
58 Rank #76 / 90Health citations — State benchmarkedThis home is ranked 76th out of 90 homes in Virginia. Shows this facility's total health deficiency citations benchmarked to the Virginia State average, with a ranking across all 90 VA facilities. Lower citation counts earn a better rank.Rankings are based only on facilities in Virginia that report data for that category. Facilities without available data are excluded from the ranking.Click the rank badge to see the full State ranking.Click here to see the full State ranking.

State average N/A

Citations per inspection
14.5 Rank #78 / 90Citations per inspection — State benchmarkedThis home is ranked 78th out of 90 homes in Virginia. Shows average deficiency citations per CMS inspection for this facility versus the Virginia mean across 90 facilities with citation data. Lower is better.Rankings are based only on facilities in Virginia that report data for that category. Facilities without available data are excluded from the ranking.Click the rank badge to see the full State ranking.Click here to see the full State ranking.

State average N/A


Health citations are formal notices following inspections when they fail to comply with safety and care standards.

48 of 58 citations resulted from standard inspections; 7 of 58 resulted from complaint investigations; and 3 of 58 came from combined inspections (standard and complaint).

Breakdown of citation severity (last 8 years)
Critical health citations
0
In line with State average

State average: N/A


Serious health citations
4
In line with State average

State average: N/A

0 critical citations State average: N/A

4 serious citations State average: N/A

54 moderate citations State average: N/A

0 minor citations State average: N/A
Citations history (last 8 years)
Administration moderate citation Aug 25, 2025
Corrected

Pharmacy moderate citation Aug 25, 2025
Corrected

Quality of Care serious citation Aug 25, 2025
Corrected

Quality of Care moderate citation Aug 25, 2025
Corrected

Staffing Data

Reporting period: October 1 – December 31, 2025 (Q4 2025). Source: CMS Payroll-Based Journal report.

Total staff 264
Employees 211
Contractors 53
Staff to resident ratio 1.36 : 1
0% compared with State average

State average ratio: 0 : 0

Avg staff/day 100
Average shift 7.8 hours
0% compared with State average

State average: 0 hours

Total staff hours (quarter) 72,142

Nursing staff breakdown

Q4 2025 · Oct 1 – Dec 31 More info This data comes from the CMS Payroll-Based Journal report covering October 1 – December 31, 2025.
Registered Nurse

Manages medical care and health needs.

RN Staff Info 17 total: 8 full-time employees and 9 contractors. 17
Average shift length Info Average shift length. Calculated as total hours divided by days worked and average staff per day. 8.1 hours
Licensed Practical Nurse

Assists with medical care and medications.

LPN Staff Info 57 total: 39 full-time employees and 18 contractors. 57
Average shift length Info Average shift length. Calculated as total hours divided by days worked and average staff per day. 8.8 hours
Certified Nursing Assistant

Helps with daily care and mobility.

CNA Staff Info 119 total: 94 full-time employees and 25 contractors. 119
Average shift length Info Average shift length. Calculated as total hours divided by days worked and average staff per day. 7.7 hours

Contractor staffing

Q4 2025 · Oct 1 – Dec 31 More info This data comes from the CMS Payroll-Based Journal report covering October 1 – December 31, 2025.

Total hours from contractors

11.6%

8,404 contractor hours this quarter

Certified Nursing Assistant: 25 Licensed Practical Nurse: 18 Registered Nurse: 9 Medical Director: 1

Staff by category

Q4 2025 · Oct 1 – Dec 31 More info This data comes from the CMS Payroll-Based Journal report covering October 1 – December 31, 2025.
Certified Nursing Assistant942511930,91092100%7.7
Licensed Practical Nurse39185717,84392100%8.8
Clinical Nurse Specialist150155,57892100%7.5
Registered Nurse89173,57192100%8.1
Speech Language Pathologist7071,9397076%7
RN Director of Nursing4041,6327784%10.1
Nurse Aide in Training9091,5188693%7.4
Mental Health Service Worker3031,4316571%8
Physical Therapy Aide6061,3457278%7.1
Physical Therapy Assistant4041,0087177%6.4
Respiratory Therapy Technician8081,0017582%5.5
Occupational Therapy Aide3038936571%7.9
Dietitian1014936267%7.9
Qualified Social Worker4044756773%5.1
Nurse Practitioner1014725964%8
Administrator1014645863%8
Other Social Services Staff1014245358%8
Therapeutic Recreation Specialist1013764953%7.7
Other Dietary Services Staff1013684852%7.7
Occupational Therapy Assistant1013524448%8
Medical Director011522527%2.1
119 Certified Nursing Assistant
% of Days 100%
57 Licensed Practical Nurse
% of Days 100%
15 Clinical Nurse Specialist
% of Days 100%
17 Registered Nurse
% of Days 100%
7 Speech Language Pathologist
% of Days 76%
4 RN Director of Nursing
% of Days 84%
9 Nurse Aide in Training
% of Days 93%
3 Mental Health Service Worker
% of Days 71%
6 Physical Therapy Aide
% of Days 78%
4 Physical Therapy Assistant
% of Days 77%
8 Respiratory Therapy Technician
% of Days 82%
3 Occupational Therapy Aide
% of Days 71%
1 Dietitian
% of Days 67%
4 Qualified Social Worker
% of Days 73%
1 Nurse Practitioner
% of Days 64%
1 Administrator
% of Days 63%
1 Other Social Services Staff
% of Days 58%
1 Therapeutic Recreation Specialist
% of Days 53%
1 Other Dietary Services Staff
% of Days 52%
1 Occupational Therapy Assistant
% of Days 48%
1 Medical Director
% of Days 27%

Penalties and fines

Federal penalties imposed by CMS for regulatory violations, including civil money penalties (fines) and denials of payment for new Medicare/Medicaid admissions.

Source: CMS Penalties Database

No penalties in the past 3 years

No civil money penalties or payment denials were reported in the last 3 years.

Quality of care over time

These measures show how residents usually do over time at this home, based on health outcomes and preventive care.

High-risk clinical events score Info A composite score based on pressure ulcers, falls with injury, weight loss, walking ability decline, and activities of daily living decline. 7.9
22% better than State average

State average: 10.1

Functional decline score Info A composite score based on activities of daily living decline, walking ability decline, and incontinence. 15.1
23% better than State average

State average: 19.7

Long-stay resident measures
Need for Help with Daily Activities Increased Info Percent of long-stay residents whose need for help with daily activities has increased 8.4%
50% better than State average

State average: 16.8%

Walking Ability Worsened Info Percent of long-stay residents whose ability to move independently worsened 12.3%
38% better than State average

State average: 19.7%

Low Risk Residents with Bowel/Bladder Incontinence Info Percent of low risk long-stay residents who lose control of their bowels or bladder 24.6%
9% worse than State average

State average: 22.6%

Falls with Major Injury Info Percent of long-stay residents experiencing one or more falls with major injury 2.6%
30% better than State average

State average: 3.6%

High Risk Residents with Pressure Ulcers Info Percent of long-stay high risk residents with pressure ulcers 7.5%
40% worse than State average

State average: 5.4%

Urinary Tract Infection Info Percent of long-stay residents with a urinary tract infection 2.9%
88% worse than State average

State average: 1.5%

Lost Too Much Weight Info Percent of long-stay residents who lose too much weight 8.6%
46% worse than State average

State average: 5.9%

Depressive Symptoms Info Percent of long-stay residents who have depressive symptoms 1.4%
90% better than State average

State average: 14.9%

Antipsychotic Use Info Percent of long-stay residents who received an antipsychotic medication 18.2%
42% worse than State average

State average: 12.9%

Pneumococcal Vaccine Info Percent of long-stay residents assessed and appropriately given the pneumococcal vaccine 97.8%
7% better than State average

State average: 91.3%

Influenza Vaccine Info Percent of long-stay residents assessed and appropriately given the seasonal influenza vaccine 96.6%
In line with State average

State average: 94.0%

Short-stay resident measures
Pneumococcal Vaccine Info Percent of short-stay residents assessed and appropriately given the pneumococcal vaccine 90.6%
21% better than State average

State average: 74.9%

Antipsychotic medication increase Info Percent of short-stay residents who newly received an antipsychotic medication 1.1%
8% better than State average

State average: 1.2%

Influenza Vaccine Info Percent of short-stay residents assessed and appropriately given the seasonal influenza vaccine 83.3%
13% better than State average

State average: 73.6%

Breakdown by payment type

Medicare

75% of new residents, usually for short-term rehab.

Typical stay 24 days

Private pay

19% of new residents, often for short stays.

Typical stay 9 - 10 months

Medicaid

6% of new residents, often for long-term daily care.

Typical stay 6 years

Facility Characteristics

Source: CMS Long-Term Care Facility Characteristics (Data as of Jan 2026)

Total residents 194
Medicare
33
17% of residents
Medicaid
111
57.2% of residents
Private pay or other
50
25.8% of residents
Programs & Services
Residents Group

Residents meet regularly to discuss policies, care quality, and activities

Family Member Group

Family members meet regularly to discuss policies, care quality, and activities

CCRC

Part of a Continuing Care Retirement Community offering multiple care levels

Active Family Council

Organized group of family members that meets regularly to discuss facility policies, resident care, and activities.

Active Resident Council

Organized group of residents that meets regularly to discuss facility policies, quality of life, and activities.

Finances and operations

Based on CMS SNF Cost Report for fiscal year ending in 12/2023.

Nonprofit
Nonprofit Corporation
Net patient revenue Info Net patient revenue — what the home actually collects for resident care, after contractual allowances, bad debt and discounts are subtracted from its gross charges (CMS cost report, Worksheet G-3). It covers resident care only; money the home earns from other sources is shown separately as "Other income."
$22.7M
Net patient income Info Net patient income: net patient revenue minus the home's total operating expenses. A positive figure means it earns more from resident care than it spends to deliver it; a negative figure means the opposite. It excludes non-operating "other income."
-$609.4K
Nonprofit Nonprofit Corporation
Net patient revenue Info Net patient revenue — what the home actually collects for resident care, after contractual allowances, bad debt and discounts are subtracted from its gross charges (CMS cost report, Worksheet G-3). It covers resident care only; money the home earns from other sources is shown separately as "Other income."
$22.7M Rank #8 / 89Revenue — State benchmarkedThis home is ranked 8th out of 89 homes in Virginia. Shows this facility's annual revenue compared to the Virginia average. Higher revenue generally means more resources for staffing and capital — read alongside Payroll %.Rankings are based only on facilities in Virginia that report data for that category. Facilities without available data are excluded from the ranking.Click the rank badge to see the full State ranking.Click here to see the full State ranking.
Net patient income Info Net patient income: net patient revenue minus the home's total operating expenses. A positive figure means it earns more from resident care than it spends to deliver it; a negative figure means the opposite. It excludes non-operating "other income."
-$609.4K
Other income Info Money the home earns outside of resident care — such as investments, grants, rentals and other non-operating sources (CMS cost report, Worksheet G-3). It is tracked separately from net patient revenue: it is not part of that figure, and it is not included in net patient income.
$453.4K
Payroll costs Info Staff salaries plus wage-related costs — benefits such as payroll taxes, health insurance and retirement — from the home's own accounting records (CMS cost report, Worksheet A). Contract or agency labor is counted separately, under other operating costs. Rank #23 / 89Payroll — State benchmarkedThis home is ranked 23rd out of 89 homes in Virginia. Shows total annual staff payroll benchmarked to the Virginia average. Higher payroll investment relative to peers often signals better staffing and less reliance on cheaper contract labor.Rankings are based only on facilities in Virginia that report data for that category. Facilities without available data are excluded from the ranking.Click the rank badge to see the full State ranking.Click here to see the full State ranking.
$11.5M 50.7% of net patient revenue Info Payroll as a share of revenue: staff salaries and wage-related benefits divided by net patient revenue. A higher figure means more of each revenue dollar goes to staff pay. Rank #83 / 89Payroll % — State benchmarkedThis home is ranked 83rd out of 89 homes in Virginia. Shows payroll as a percentage of revenue versus the Virginia average. Well-run Virginia facilities typically land around 51–60% — the top third Statewide. Below 25% may signal understaffing or heavy agency use — read with Staffing ratings.Rankings are based only on facilities in Virginia that report data for that category. Facilities without available data are excluded from the ranking.Click the rank badge to see the full State ranking.Click here to see the full State ranking.
Other operating costs Info Everything it costs to run the home apart from payroll — food, utilities, supplies, maintenance, contract labor and administration. Calculated as total operating expense minus payroll (staff salaries and wage-related benefits).
$11.8M
Total costs Info The home's total operating expense for the year — all the costs of running it, salaries included (CMS cost report, Worksheet G-3).
$23.3M

What does this home offer?

Housing options icon

Housing Options: Private Rooms

Building type icon
Building type icon

Building Type: 3-story

Transportation services icon

Transportation Services

Fitness and recreation icon

Fitness and Recreation

Who this home usually serves

TYPE OF STAY

Mostly short-term rehab stays

Most residents typically stay for a few weeks or months before returning home or moving on.

Most new residents arrive under Medicare (75% of admissions), and a typical Medicare stay runs around 24 days.

Admissions
334 total

Coverage residents most often arrive under.

Medicare 75%
Private pay 19%
Medicaid 6%
Discharges
409 total

Coverage residents most often leave under.

Medicare 56%
Private pay 19%
Medicaid 24%

Managed by Nathan Yowell

Executive Director

Nathan Yowell serves as the Executive Director of Warwick Forest, Active Senior Living by Riverside. He holds a degree from James Madison University’s Health Services Administration Program and began his career as an Administrator at nursing facilities in Virginia. Nathan has extensive leadership experience in senior living communities and is committed to providing compassionate care. He enjoys spending time with his family and engaging in outdoor activities.

Places of interest near Warwick Forest

Address 4.6 miles from city center Info Estimated distance in miles from Newport News's city center to Warwick Forest's address, calculated via Google Maps. — 0.36 miles to nearest hospital (Bon Secours Mary Immaculate Hospital)

Calculate Travel Distance to Warwick Forest

Add your location

Address

Compare Nursing Homes around the area

The information below is reported by the Virginia Department of Social Services and Department of Health.

Warwick Forest
NH
AL
IL
MC
Newport News (Central Newport News) -209 - 12 Private Rooms
The Summit
NH
AL
HC
IL
MC
Lynchburg (Enterprise Drive) -50 A+ 56 1 Bed / 2 Bed
Brandermill Woods Healthcare Communities
NH
AL
IL
MC
Midlothian (Brandermill) -91 - 4 Apartment / Cottage / 1 Bed / 2 Bed / 3 Bed
The Blake at Charlottesville
NH
AL
MC
RC
Charlottesville -130 - 28 Studio / 1 Bed / 2 Bed
The Devonshire Senior Living
NH
AL
IL
MC
RC
Hampton (Coliseum Central) -61 - 63 Studio / 1 Bed / 2 Bed

Frequently Asked Questions about Warwick Forest

What neighborhood is Warwick Forest in?

Warwick Forest is in the Central Newport News neighborhood of Newport News.

Is Warwick Forest in a walkable area?

Warwick Forest has a walk score of 12. Car-dependent. Most errands require a car, with limited nearby walkable options.

What is the occupancy rate at Warwick Forest?

Warwick Forest's occupancy is 90.1%.

Does Warwick Forest operate as a for-profit or non-profit?

Warwick Forest is registered as a non-profit in VA.

Are there photos of Warwick Forest?

Yes — there are 36 photos of Warwick Forest in the photo gallery on this page.

What is the address of Warwick Forest?

Warwick Forest is located at 1004 Old Denbigh Blvd, Newport News, VA 23602.

What is the phone number of Warwick Forest?

(757) 886-2200 will put you in contact with the team at Warwick Forest.

Guides for Better Senior Living

Care Cost Calculator: See Prices in Your Area

Nursing Home Data Explorer

Don’t Wait Too Long: 7 Red Flag Signs Your Parent Needs Assisted Living Now

The True Cost of Assisted Living in 2025 – And How Families Are Paying For It

Understanding Senior Living Costs: Pricing Models, Discounts & Financial Assistance