


Total staff
128
Employees
106
Contractors
22
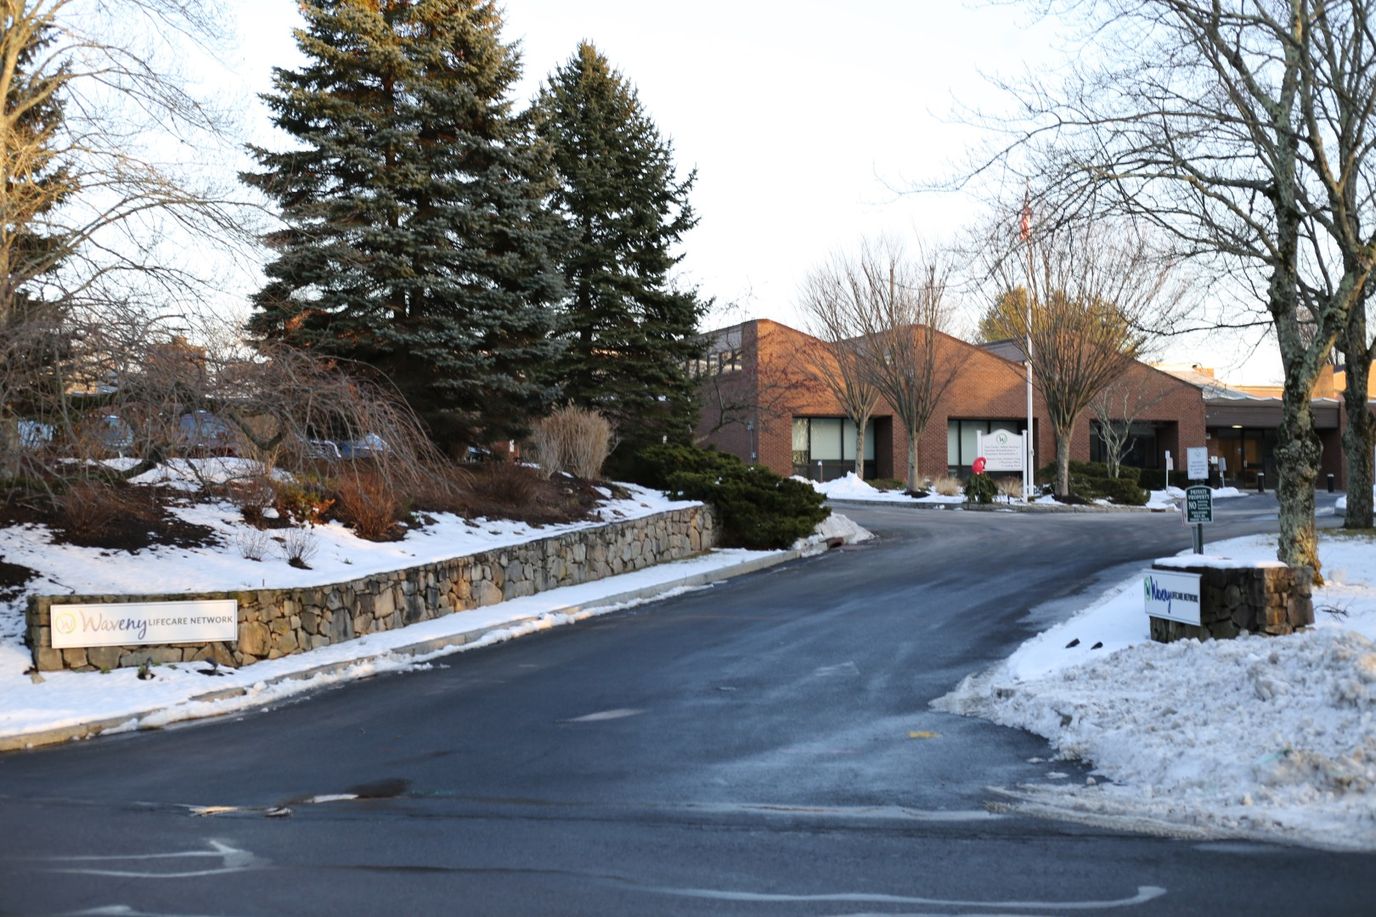


Waveny LifeCare Network is a trusted nursing home in New Canaan, CT, that offers a wide range of care options, including skilled nursing, rehabilitation, and respite care. With its nurturing and supportive environment, older adults receive the utmost attention and care to live comfortably in retirement. Residents can also keep their peace of mind, as 24-hour care, therapy services, and nutritious meals are also provided. Through a holistic approach to care, the community strives to meet residents’ unique needs and preferences.
Music programs, stretching exercises, and various games provide residents with more opportunities to learn new things and gain fun experiences. Accessible communal spaces and cozy living areas also ensure residents can rest and connect with friends. Situated near serene parks and local amenities in New Canaan, the community guarantees accessibility and convenience. As one of the best options for senior living in Connecticut, this nursing home has exceptional standards of care.
| Staff type | Hours / Day / Resident | vs state avg |
|---|---|---|
|
Registered Nurse (RN)
| 1h 23m per day | ▲ 97% State avg: 42m per day · National avg: 41m per day |
|
LPN / LVN
| 44m per day | ▼ 12% State avg: 50m per day · National avg: 52m per day |
|
Nurse Aide
| 3h 16m per day | ▲ 43% State avg: 2h 17m per day · National avg: 2h 21m per day |
|
Weekend Total Nursing
| 4h 21m per day | ▲ 28% State avg: 3h 25m per day · National avg: 3h 26m per day |
|
Physical Therapist
| 11m per day | ▲ 123% State avg: 5m per day · National avg: 4m per day |
|
Weekend RN
| 46m per day | ▲ 63% State avg: 28m per day · National avg: 29m per day |
Reporting period: October 1 – December 31, 2025 (Q4 2025). Source: CMS Payroll-Based Journal report.
Manages medical care and health needs.
Assists with medical care and medications.
Helps with daily care and mobility.
Total hours from contractors
3,856 contractor hours this quarter
| Certified Nursing Assistant | 47 | 0 | 47 | 19,066 | 92 | 100% | 8.4 |
| Registered Nurse | 15 | 0 | 15 | 6,425 | 92 | 100% | 9.3 |
| Licensed Practical Nurse | 16 | 0 | 16 | 4,692 | 92 | 100% | 9.5 |
| Clinical Nurse Specialist | 5 | 0 | 5 | 1,956 | 67 | 73% | 6.6 |
| Nurse Aide in Training | 11 | 0 | 11 | 1,947 | 68 | 74% | 6.7 |
| Respiratory Therapy Technician | 0 | 6 | 6 | 1,191 | 83 | 90% | 7.1 |
| Physical Therapy Assistant | 0 | 9 | 9 | 1,154 | 77 | 84% | 5.8 |
| Qualified Social Worker | 0 | 2 | 2 | 842 | 61 | 66% | 7.5 |
| Dietitian | 5 | 0 | 5 | 777 | 89 | 97% | 3.9 |
| Other Social Services Staff | 3 | 0 | 3 | 568 | 63 | 68% | 4.4 |
| Administrator | 1 | 0 | 1 | 472 | 59 | 64% | 8 |
| Nurse Practitioner | 1 | 0 | 1 | 472 | 59 | 64% | 8 |
| Mental Health Service Worker | 1 | 0 | 1 | 456 | 57 | 62% | 8 |
| Speech Language Pathologist | 0 | 2 | 2 | 326 | 56 | 61% | 5.5 |
| Occupational Therapy Aide | 0 | 1 | 1 | 174 | 57 | 62% | 3.1 |
| Medical Director | 1 | 0 | 1 | 151 | 92 | 100% | 1.6 |
| Occupational Therapy Assistant | 0 | 1 | 1 | 96 | 92 | 100% | 1 |
| Physical Therapy Aide | 0 | 1 | 1 | 73 | 19 | 21% | 3.8 |
Federal penalties imposed by CMS for regulatory violations, including civil money penalties (fines) and denials of payment for new Medicare/Medicaid admissions.
Source: CMS Penalties Database
No penalties in the past 3 years
No civil money penalties or payment denials were reported in the last 3 years.
These measures show how residents usually do over time at this home, based on health outcomes and preventive care.
Connecticut average: 10.4
Connecticut average: 21.1
Connecticut average: 18.9%
Connecticut average: 19.2%
Connecticut average: 24.9%
Connecticut average: 3.5%
Connecticut average: 4.6%
Connecticut average: 1.7%
Connecticut average: 6.3%
Connecticut average: 15.2%
Connecticut average: 17.2%
Connecticut average: 87.5%
Connecticut average: 93.5%
Connecticut average: 2.10
Connecticut average: 1.53
Connecticut average: 70.1%
Connecticut average: 1.5%
Connecticut average: 69.8%
Connecticut average: 25.0%
Connecticut average: 11.1%
Connecticut average: 0.8%
Connecticut average: 53.7%
Connecticut average: 50.6%
Quality measures are calculated from Minimum Data Set (MDS) assessments. For most measures, lower percentages indicate better care quality.
85% of new residents, usually for short-term rehab.
14% of new residents, often for short stays.
2% of new residents, often for long-term daily care.
Source: CMS Long-Term Care Facility Characteristics (Data as of Jan 2026)
Residents meet regularly to discuss policies, care quality, and activities
Organized group of residents that meets regularly to discuss facility policies, quality of life, and activities.
Data sourced from CMS Long-Term Care Facility Characteristics quarterly report. Payer mix reflects the current resident census by primary payment source.
Historical financial and operational data for Waveny LifeCare Network from 2012–2023, based on CMS SNF Cost Reports.
Key figures below are for fiscal year ending in 09/2023.
Based on CMS SNF Cost Report for fiscal year ending in 09/2023.
No pets allowed
Housing Options: Studio / 1 Bed
Building Type: Single-story
Beauty Services
Housekeeping Services
Social and Recreational Activities
Exercise Programs
Most residents typically stay for a few weeks or months before returning home or moving on.
Most new residents arrive under Medicare (85% of admissions), and a typical Medicare stay runs around 3 - 4 months.
Coverage residents most often arrive under.
Coverage residents most often leave under.
![]() 1.4 miles from city center
1.4 miles from city center
![]() Estimated distance in miles from New Canaan's city center to Waveny LifeCare Network's address, calculated via Google Maps.
Estimated distance in miles from New Canaan's city center to Waveny LifeCare Network's address, calculated via Google Maps.
Add your location
Info below is compiled from CMS reports & the CT Dept. of Public Health (DPH), senior community websites & trusted data sources such as Walk Score & BBB.
Communities are listed from highest to lowest based on our ranking methodology.
| The Suffield House | NH AL | Suffield | 128
Facility
128
CT AVG
113
Rank
#43 / 119 |
96.1%
Facility
96.1%
CT AVG
84
Rank
#13 / 104 | +14% | 3.69
Facility
3.69
CT AVG
3.97
Rank
#35 / 65 | -87% | -7% | $0
Facility
$0
CT AVG
$43.8k
Rank
#1 / 67 | 14
Facility
14
CT AVG
32.0
Rank
#8 / 67 | 3.5
Facility
3.5
CT AVG
5.8
Rank
#9 / 67 | - | 123 | - |
2
Facility
2
CT AVG
47
Rank
#261 / 264 | Suffield Snf Operations Holdings LLC | $18.8MFiscal year ending 09/2023
Facility
$18.8MFiscal year ending 09/2023
CT AVG
$19.0M
Rank
#32 / 70 | $11.8MFiscal year ending 09/2023
Facility
$11.8MFiscal year ending 09/2023
CT AVG
$7.2M
Rank
#21 / 70 | 62.7%Fiscal year ending 09/2023
Facility
62.7%Fiscal year ending 09/2023
CT AVG
42.4%
Rank
#29 / 70 | 75347 | ||||
| Regency House Of Wallingford I | NH HOS MC PC RC SNF | Wallingford (Wallingford Center) | 130
Facility
130
CT AVG
113
Rank
#39 / 119 |
93.8%
Facility
93.8%
CT AVG
84
Rank
#27 / 104 | +12% | 3.47
Facility
3.47
CT AVG
3.97
Rank
#47 / 65 | -1% | -13% | $0
Facility
$0
CT AVG
$43.8k
Rank
#1 / 67 | 13
Facility
13
CT AVG
32.0
Rank
#7 / 67 | 4.3
Facility
4.3
CT AVG
5.8
Rank
#16 / 67 | - | 122 | - |
39
Facility
39
CT AVG
47
Rank
#161 / 264 | Barry Bokow 2012 Family Trust | $19.4MFiscal year ending 09/2023
Facility
$19.4MFiscal year ending 09/2023
CT AVG
$19.0M
Rank
#22 / 70 | $10.3MFiscal year ending 09/2023
Facility
$10.3MFiscal year ending 09/2023
CT AVG
$7.2M
Rank
#24 / 70 | 53%Fiscal year ending 09/2023
Facility
53%Fiscal year ending 09/2023
CT AVG
42.4%
Rank
#54 / 70 | 75261 | ||||
| Essex Meadows | NH AL HOS IL SNF | Essex (Ivoryton) | 45
Facility
45
CT AVG
113
Rank
#101 / 119 |
86.7%
Facility
86.7%
CT AVG
84
Rank
#62 / 104 | +3% | 5.71
Facility
5.71
CT AVG
3.97
Rank
#3 / 65 | +62% | +44% | $0
Facility
$0
CT AVG
$43.8k
Rank
#1 / 67 | 15
Facility
15
CT AVG
32.0
Rank
#10 / 67 | 5.0
Facility
5.0
CT AVG
5.8
Rank
#27 / 67 | - | 39 | - |
24
Facility
24
CT AVG
47
Rank
#199 / 264 | Lcs Essex Meadows Jv LLC | $5.4MFiscal year ending 12/2023
Facility
$5.4MFiscal year ending 12/2023
CT AVG
$19.0M
Rank
#31 / 70 | $10.8MFiscal year ending 12/2023
Facility
$10.8MFiscal year ending 12/2023
CT AVG
$7.2M
Rank
#33 / 70 | 199.9%Fiscal year ending 12/2023
Facility
199.9%Fiscal year ending 12/2023
CT AVG
42.4%
Rank
#39 / 70 | 75322 | ||||
| Evergreen Woods | NH AL IL SNF | North Branford | 50
Facility
50
CT AVG
113
Rank
#99 / 119 |
74.0%
Facility
74.0%
CT AVG
84
Rank
#86 / 104 | -12% | 5.16
Facility
5.16
CT AVG
3.97
Rank
#8 / 65 | 0% | +30% | $0
Facility
$0
CT AVG
$43.8k
Rank
#1 / 67 | 15
Facility
15
CT AVG
32.0
Rank
#10 / 67 | 5.0
Facility
5.0
CT AVG
5.8
Rank
#27 / 67 | - | 37 | A+ |
8
Facility
8
CT AVG
47
Rank
#249 / 264 | Senior Living Commuities LLC | $6.0MFiscal year ending 12/2023
Facility
$6.0MFiscal year ending 12/2023
CT AVG
$19.0M
Rank
#30 / 70 | $7.6MFiscal year ending 12/2023
Facility
$7.6MFiscal year ending 12/2023
CT AVG
$7.2M
Rank
#48 / 70 | 126.6%Fiscal year ending 12/2023
Facility
126.6%Fiscal year ending 12/2023
CT AVG
42.4%
Rank
#68 / 70 | 75362 | ||||
| Waveny LifeCare Network | NH AL HC HOS IL MC RC SNF | New Canaan (Farm Road) | 106
Facility
106
CT AVG
113
Rank
#59 / 119 |
65.8%
Facility
65.8%
CT AVG
84
Rank
#90 / 104 | -22% | 5.05
Facility
5.05
CT AVG
3.97
Rank
#10 / 65 | +9% | +27% | $0
Facility
$0
CT AVG
$43.8k
Rank
#1 / 67 | 12
Facility
12
CT AVG
32.0
Rank
#4 / 67 | 4.0
Facility
4.0
CT AVG
5.8
Rank
#13 / 67 | - | 70 | - |
12
Facility
12
CT AVG
47
Rank
#242 / 264 | Kenneth Baldwin | $38.2MFiscal year ending 09/2023
Facility
$38.2MFiscal year ending 09/2023
CT AVG
$19.0M
Rank
#3 / 70 | $26.5MFiscal year ending 09/2023
Facility
$26.5MFiscal year ending 09/2023
CT AVG
$7.2M
Rank
#3 / 70 | 69.3%Fiscal year ending 09/2023
Facility
69.3%Fiscal year ending 09/2023
CT AVG
42.4%
Rank
#21 / 70 | 75361 |
Waveny LifeCare Network is in the Farm Road neighborhood.
Waveny LifeCare Network has a walk score of 12. Car-dependent. Most errands require a car, with limited nearby walkable options.
Waveny LifeCare Network's occupancy is 171.5%.
No, Waveny LifeCare Network has a no-pet policy.
Waveny LifeCare Network is registered as a non-profit.
Yes — there are 5 photos of Waveny LifeCare Network in the photo gallery on this page.
Waveny LifeCare Network is located at 3 Farm Rd, New Canaan, CT 06840.
Care Cost Calculator: See Prices in Your Area
Nursing Home Data Explorer
Don’t Wait Too Long: 7 Red Flag Signs Your Parent Needs Assisted Living Now
The True Cost of Assisted Living in 2025 – And How Families Are Paying For It
Understanding Senior Living Costs: Pricing Models, Discounts & Financial Assistance


