Wedgewood Healthcare Center
Nursing Home & Memory Care · Clarksville, IN
CMS overall rating Info CMS (the Centers for Medicare & Medicaid Services) is the federal agency that rates nursing home quality. Its Overall Rating runs from 1 to 5 stars, combining health inspections, staffing, and quality measures, with inspections weighted most heavily.

Wedgewood Healthcare Center

Nursing Home & Memory Care · Clarksville, IN
CMS overall rating Info CMS (the Centers for Medicare & Medicaid Services) is the federal agency that rates nursing home quality. Its Overall Rating runs from 1 to 5 stars, combining health inspections, staffing, and quality measures, with inspections weighted most heavily.
Calculator: See prices in your area
Wedgewood Healthcare Center accepts Medicare, Medicaid, and private pay.

Overview of Wedgewood Healthcare Center

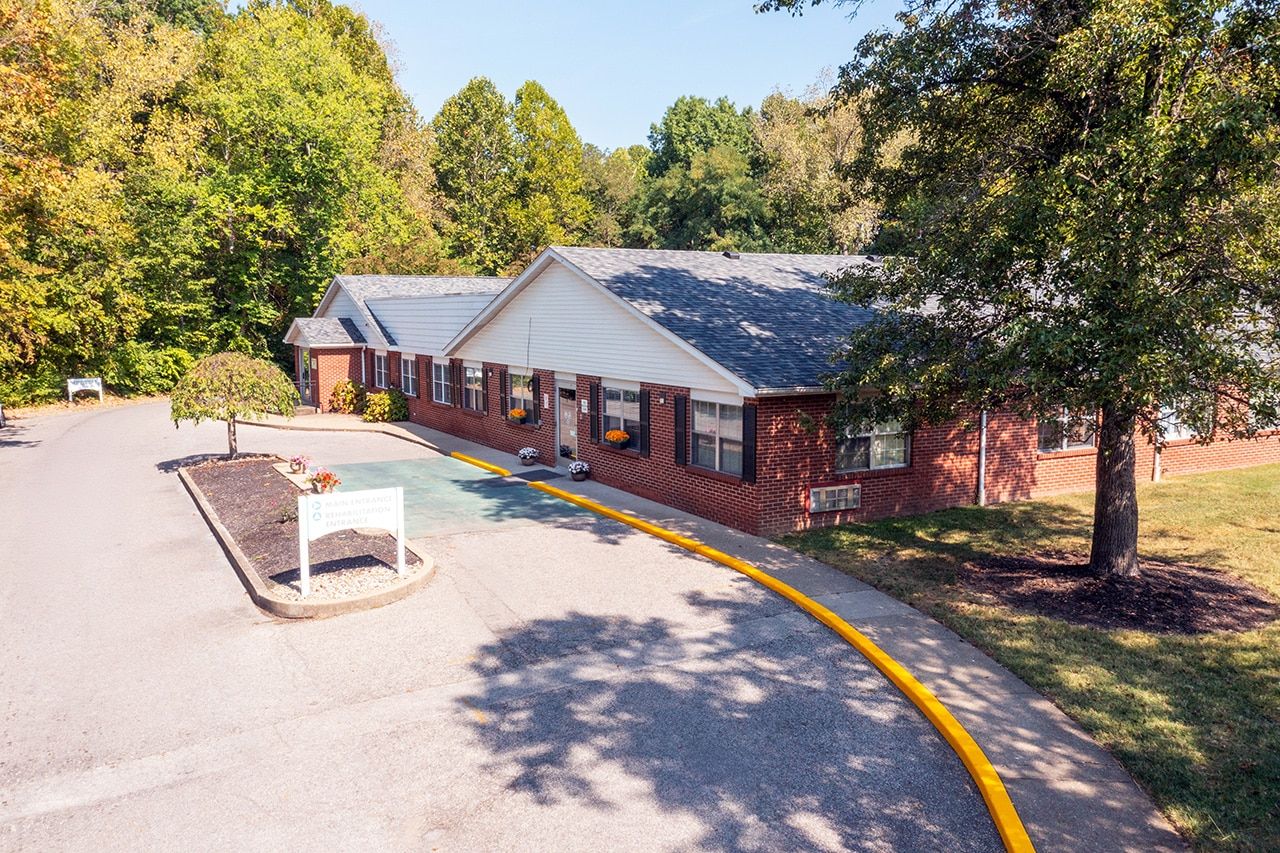
Wedgewood Healthcare Center is a nursing home in Clarksville, IN, offering long-term care, memory care, and rehabilitation. The community’s supportive and welcoming environment also ensures older adults are treated well throughout their stay. With 24-hour care, nutritious meals, and maintenance services, residents receive high-quality services to help maintain their independence with ease. Through a person-centered approach to care, the community also strives to meet residents’ unique needs and preferences.

Summer cookout, outings, and light exercises ensure residents can stay active and gain meaningful experiences. Thoughtfully curated amenities and accessible rooms also ensure residents’ relaxation and wellness. Nestled in the tree-lined neighborhood of Clarksville, the community guarantees a laid-back lifestyle. This nursing home is a great choice for senior living in Indiana, especially with its commitment to older adults’ welfare.

Quality ratings

Measured by Centers for Medicare & Medicaid Services (CMS)

Overall rating Info The Overall CMS Rating combines results from health inspections, staffing levels and quality measures. Health inspections carry the most weight. Staffing and quality scores can increase or decrease the final rating based on performance compared to state and national standards.
▼ 2.8% Below IN avg. ▼ 2.8% Below IN avg.IN average: 3.1Click the badge to see the full State ranking.Click here to see the full State ranking.
Health Inspection Info Based on the results of the facility's three most recent standard inspections and any complaint investigations. CMS reviews the number, scope, and severity of deficiencies, with more recent findings weighted more heavily.
▼ 28.8% Below IN avg. ▼ 28.8% Below IN avg.IN average: 2.8Click the badge to see the full State ranking.Click here to see the full State ranking.
Staffing Info Measures average nursing staff hours per resident per day, including Registered Nurses (RNs) and total nursing staff. Ratings are adjusted based on the level of care residents require and are compared to state and national benchmarks.
▼ 18.6% Below IN avg. ▼ 18.6% Below IN avg.IN average: 2.5Click the badge to see the full State ranking.Click here to see the full State ranking.
Quality Measures Info Based on clinical and physical health indicators reported to CMS, such as hospital readmissions, falls, pressure ulcers, and improvements in mobility. These measures reflect how well residents' health needs are being managed.
▲ 22.3% Above IN avg. ▲ 22.3% Above IN avg.IN average: 4.1Click the badge to see the full State ranking.Click here to see the full State ranking.

Staffing hours breakdown

Info Daily nursing hours per resident by staff type, reported to CMS. Higher is generally better — compare this facility to state and national averages to see where staffing stands.

Hours per resident per day — compared to Indiana state averages

Total nursing care / resident Info This home is ranked 107th out of 291 homes in Indiana for nurse hours. Total adjusted nursing hours per resident per day, combining RN, LPN, and aide time. CMS adjusts this for case-mix so facilities can be fairly compared.
3h 32m per day
Rank #107 / 291Nurse hours — State benchmarkedThis home is ranked 107th out of 291 homes in Indiana. Shows adjusted nurse hours per resident per day benchmarked to the Indiana average, with a ranking across 291 Indiana facilities. More hours mean more direct care. The national average is about 3.5 hrs; below 3.0 is a red flag.Rankings are based only on facilities in Indiana that report data for that category. Facilities without available data are excluded from the ranking.Click the rank badge to see the full State ranking.Click here to see the full State ranking.
This facility Indiana avg (3h 26m per day)
vs Indiana avg
+3%

5 of 6 metrics below state avg

Standout metric LPN / LVN is +10% above state avg
Staff typeHours / Day / Residentvs state avg
Registered Nurse (RN) Info RNs hold the highest nursing license and can assess residents, interpret test results, and direct care plans. More RN hours per day often signals stronger clinical oversight and faster response to health changes. 25m per day ▼ 37% State avg: 39m per day · National avg: 41m per day
LPN / LVN Info Licensed Practical Nurses (LPNs) or Licensed Vocational Nurses (LVNs) deliver routine hands-on care — medication administration, wound dressing, and monitoring vital signs. They work under RN supervision and make up a large share of daily bedside care. 52m per day ▲ 10% State avg: 47m per day · National avg: 52m per day
Nurse Aide Info Certified Nurse Aides (CNAs) provide the most direct day-to-day assistance: bathing, dressing, feeding, and mobility. Nurse aide hours are typically the largest staffing category and directly affect residents' quality of life. 2h 3m per day ▼ 9% State avg: 2h 15m per day · National avg: 2h 20m per day
Weekend Total Nursing Info Combined nursing hours (RN + LPN + Nurse Aide) per resident per day on weekends. Staffing often drops on weekends — this figure reveals whether the facility maintains adequate coverage outside of weekday hours. 3h 8m per day ▼ 4% State avg: 3h 16m per day · National avg: 3h 27m per day
Physical Therapist Info Hours per resident per day provided by licensed Physical Therapists (PTs) or PT Assistants. PT services help residents recover mobility after injury or illness and are especially important for post-acute (short-stay) rehabilitation. 3m per day ▼ 11% State avg: 4m per day · National avg: 4m per day
Weekend RN Info Registered nurse hours specifically on weekends. Facilities sometimes reduce RN presence on Saturdays and Sundays — a low weekend RN figure compared to weekday hours can indicate reduced clinical oversight when most administrative staff are absent. 18m per day ▼ 33% State avg: 27m per day · National avg: 29m per day

Capacity and availability

This home usually has limited availability

Higher occupancy than the Indiana average: 69.4%
Occupancy rate
85.1% Rank #62 / 434Occupancy rate — State benchmarkedThis home is ranked 62nd out of 434 homes in Indiana. Shows this facility's occupancy rate versus the Indiana average, with its Statewide rank out of 434. Higher occupancy signals strong local demand and financial stability.Rankings are based only on facilities in Indiana that report data for that category. Facilities without available data are excluded from the ranking.Click the rank badge to see the full State ranking.Click here to see the full State ranking.
Avg. Length of Stay
80 days
Bed community size
124-bed community Rank #157 / 437Bed count — State benchmarkedThis home is ranked 157th out of 437 homes in Indiana. Shows this facility's certified or reported bed count compared to other Indiana facilities. Larger communities may offer more amenities, programs, and on-site services for residents and families.Rankings are based only on facilities in Indiana that report data for that category. Facilities without available data are excluded from the ranking.Click the rank badge to see the full State ranking.Click here to see the full State ranking.
A larger shared setting that may offer more common spaces and organized community services.
Walk Score
Walk Score: 4 / 100 Rank #527 / 587Walk Score — State benchmarkedThis home is ranked 527th out of 587 homes in Indiana. Shows how walkable this facility's neighborhood is compared to the average Walk Score across Indiana facilities. Higher scores benefit residents, families, and staff.Rankings are based only on facilities in Indiana that report data for that category. Facilities without available data are excluded from the ranking.Click the rank badge to see the full State ranking.Click here to see the full State ranking.
Car-dependent. Most errands require a car, with limited nearby walkable options.

Contact Wedgewood Healthcare Center

Staffing Data

Reporting period: October 1 – December 31, 2025 (Q4 2025). Source: CMS Payroll-Based Journal report.

Total staff 135
Employees 119
Contractors 16
Staff to resident ratio 0.00 : 1
99% fewer staff per resident than Indiana average
Indiana average ratio: 0.00 : 1 Indiana average ratio: 0.00 : 1See full Indiana ranking
Avg staff/day 45
Average shift 8.3 hours
8% better than Indiana average
Indiana average: 7.7 hours Indiana average shift: 7.7 hoursSee full Indiana ranking
Total staff hours (quarter) 34,496

Nursing staff breakdown

Q4 2025 · Oct 1 – Dec 31 More info This data comes from the CMS Payroll-Based Journal report covering October 1 – December 31, 2025.
Registered Nurse

Manages medical care and health needs.

RN Staff Info All 15 RN Staff are full-time employees. No contractors work on this role. 15
Average shift length Info Average shift length. Calculated as total hours divided by days worked and average staff per day. 10.1 hours
Licensed Practical Nurse

Assists with medical care and medications.

LPN Staff Info All 25 LPN Staff are full-time employees. No contractors work on this role. 25
Average shift length Info Average shift length. Calculated as total hours divided by days worked and average staff per day. 9.1 hours
Certified Nursing Assistant

Helps with daily care and mobility.

CNA Staff Info All 53 CNA Staff are full-time employees. No contractors work on this role. 53
Average shift length Info Average shift length. Calculated as total hours divided by days worked and average staff per day. 8.9 hours

Contractor staffing

Q4 2025 · Oct 1 – Dec 31 More info This data comes from the CMS Payroll-Based Journal report covering October 1 – December 31, 2025.

Total hours from contractors

7%

2,400 contractor hours this quarter

Physical Therapy Assistant: 6 Respiratory Therapy Technician: 4 Qualified Social Worker: 3 Medical Director: 1 Physical Therapy Aide: 1 Speech Language Pathologist: 1

Staff by category

Q4 2025 · Oct 1 – Dec 31 More info This data comes from the CMS Payroll-Based Journal report covering October 1 – December 31, 2025.
Certified Nursing Assistant5305317,25092100%8.9
Licensed Practical Nurse250257,53592100%9.1
Registered Nurse150152,6489199%10.1
Other Dietary Services Staff2028517076%7.6
Physical Therapy Assistant0667997379%5.6
Medication Aide/Technician5057336470%9.4
Clinical Nurse Specialist4047316166%7.4
Respiratory Therapy Technician0444847480%5.5
Mental Health Service Worker1014655964%7.9
Dental Services Staff1014405661%7.8
Administrator1014245358%8
Dietitian1014246470%6.6
Speech Language Pathologist0114166166%6.8
Qualified Social Worker0333316166%5.4
Physical Therapy Aide0113195762%5.6
Nurse Practitioner1012302932%7.9
Occupational Therapy Aide3031925560%3.3
Nurse Aide in Training4046878%7.6
RN Director of Nursing202586368%0.9
Medical Director011522325%2.3
Occupational Therapy Assistant1014778%6.7
53 Certified Nursing Assistant
% of Days 100%
25 Licensed Practical Nurse
% of Days 100%
15 Registered Nurse
% of Days 99%
2 Other Dietary Services Staff
% of Days 76%
6 Physical Therapy Assistant
% of Days 79%
5 Medication Aide/Technician
% of Days 70%
4 Clinical Nurse Specialist
% of Days 66%
4 Respiratory Therapy Technician
% of Days 80%
1 Mental Health Service Worker
% of Days 64%
1 Dental Services Staff
% of Days 61%
1 Administrator
% of Days 58%
1 Dietitian
% of Days 70%
1 Speech Language Pathologist
% of Days 66%
3 Qualified Social Worker
% of Days 66%
1 Physical Therapy Aide
% of Days 62%
1 Nurse Practitioner
% of Days 32%
3 Occupational Therapy Aide
% of Days 60%
4 Nurse Aide in Training
% of Days 8%
2 RN Director of Nursing
% of Days 68%
1 Medical Director
% of Days 25%
1 Occupational Therapy Assistant
% of Days 8%

Penalties and fines

Federal penalties imposed by CMS for regulatory violations, including civil money penalties (fines) and denials of payment for new Medicare/Medicaid admissions.

Source: CMS Penalties Database (Data as of Jan 2026)

Total fines amount $63K Rank #285 / 293Federal fines — State benchmarkedThis home is ranked 285th out of 293 homes in Indiana. Shows this facility's cumulative CMS federal fine dollars versus the Indiana average among facilities with fines, and where it ranks among 293 facilities in the pool. Lower total dollars mean a better rank.Rankings are based only on facilities in Indiana that report data for that category. Facilities without available data are excluded from the ranking.Click the rank badge to see the full State ranking.Click here to see the full State ranking.
132% higher than Indiana average

Indiana average: $27K

Number of fines 1
28% fewer fines than Indiana average

Indiana average: 1.4

Payment Denials Info Serious action where Medicare and/or Medicaid temporarily stops payments for new residents until issues are fixed. 0
100% fewer payment denials than Indiana average

Indiana average: 0.4

Fines amount comparison
This facility $63K
Indiana average $27K

No penalties in the past 3 years

No civil money penalties or payment denials were reported in the last 3 years.

Quality of care over time

These measures show how residents usually do over time at this home, based on health outcomes and preventive care.

High-risk clinical events score Info A composite score based on pressure ulcers, falls with injury, weight loss, walking ability decline, and activities of daily living decline. 3.8
52% better than Indiana average

Indiana average: 8.0

Functional decline score Info A composite score based on activities of daily living decline, walking ability decline, and incontinence. 10.8
37% better than Indiana average

Indiana average: 17.1

Long-stay resident measures
Need for Help with Daily Activities Increased Info Percent of long-stay residents whose need for help with daily activities has increased 3.2%
74% better than Indiana average

Indiana average: 12.0%

Walking Ability Worsened Info Percent of long-stay residents whose ability to move independently worsened 7.7%
47% better than Indiana average

Indiana average: 14.4%

Low Risk Residents with Bowel/Bladder Incontinence Info Percent of low risk long-stay residents who lose control of their bowels or bladder 21.5%
12% better than Indiana average

Indiana average: 24.6%

Falls with Major Injury Info Percent of long-stay residents experiencing one or more falls with major injury 2.2%
44% better than Indiana average

Indiana average: 3.9%

High Risk Residents with Pressure Ulcers Info Percent of long-stay high risk residents with pressure ulcers 4.2%
In line with Indiana average

Indiana average: 4.4%

Urinary Tract Infection Info Percent of long-stay residents with a urinary tract infection 0.5%
56% better than Indiana average

Indiana average: 1.2%

Lost Too Much Weight Info Percent of long-stay residents who lose too much weight 1.9%
67% better than Indiana average

Indiana average: 5.7%

Depressive Symptoms Info Percent of long-stay residents who have depressive symptoms 15.2%
37% better than Indiana average

Indiana average: 24.1%

Antipsychotic Use Info Percent of long-stay residents who received an antipsychotic medication 13.9%
11% worse than Indiana average

Indiana average: 12.4%

Pneumococcal Vaccine Info Percent of long-stay residents assessed and appropriately given the pneumococcal vaccine 77.2%
18% worse than Indiana average

Indiana average: 93.7%

Influenza Vaccine Info Percent of long-stay residents assessed and appropriately given the seasonal influenza vaccine 98.0%
In line with Indiana average

Indiana average: 95.4%

Short-stay resident measures
Pneumococcal Vaccine Info Percent of short-stay residents assessed and appropriately given the pneumococcal vaccine 61.1%
25% worse than Indiana average

Indiana average: 81.7%

Antipsychotic medication increase Info Percent of short-stay residents who newly received an antipsychotic medication 1.3%
5% better than Indiana average

Indiana average: 1.4%

Influenza Vaccine Info Percent of short-stay residents assessed and appropriately given the seasonal influenza vaccine 85.4%
8% better than Indiana average

Indiana average: 79.0%

Breakdown by payment type

Medicare

14% of new residents, usually for short-term rehab.

Typical stay 23 days

Private pay

31% of new residents, often for short stays.

Typical stay 1 - 2 months

Medicaid

55% of new residents, often for long-term daily care.

Typical stay 3 - 4 months

Facility Characteristics

Source: CMS Long-Term Care Facility Characteristics (Data as of Jan 2026)

Total residents 100,267,246
Medicare
166
0% of residents
Medicaid
100,267,080
100% of residents
Programs & Services
Residents Group

Residents meet regularly to discuss policies, care quality, and activities

Active Resident Council

Organized group of residents that meets regularly to discuss facility policies, quality of life, and activities.

Finances and operations

Based on CMS SNF Cost Report for fiscal year ending in 11/2023.

For-profit
Corporation
Net patient revenue Info Net patient revenue — what the home actually collects for resident care, after contractual allowances, bad debt and discounts are subtracted from its gross charges (CMS cost report, Worksheet G-3). It covers resident care only; money the home earns from other sources is shown separately as "Other income."
$5.9M
Net patient income Info Net patient income: net patient revenue minus the home's total operating expenses. A positive figure means it earns more from resident care than it spends to deliver it; a negative figure means the opposite. It excludes non-operating "other income."
$222.8K
For-profit Corporation
Net patient revenue Info Net patient revenue — what the home actually collects for resident care, after contractual allowances, bad debt and discounts are subtracted from its gross charges (CMS cost report, Worksheet G-3). It covers resident care only; money the home earns from other sources is shown separately as "Other income."
$5.9M Rank #96 / 294Revenue — State benchmarkedThis home is ranked 96th out of 294 homes in Indiana. Shows this facility's annual revenue compared to the Indiana average. Higher revenue generally means more resources for staffing and capital — read alongside Payroll %.Rankings are based only on facilities in Indiana that report data for that category. Facilities without available data are excluded from the ranking.Click the rank badge to see the full State ranking.Click here to see the full State ranking.
Net patient income Info Net patient income: net patient revenue minus the home's total operating expenses. A positive figure means it earns more from resident care than it spends to deliver it; a negative figure means the opposite. It excludes non-operating "other income."
$222.8K
Other income Info Money the home earns outside of resident care — such as investments, grants, rentals and other non-operating sources (CMS cost report, Worksheet G-3). It is tracked separately from net patient revenue: it is not part of that figure, and it is not included in net patient income.
$611
Payroll costs Info Staff salaries plus wage-related costs — benefits such as payroll taxes, health insurance and retirement — from the home's own accounting records (CMS cost report, Worksheet A). Contract or agency labor is counted separately, under other operating costs. Rank #80 / 294Payroll — State benchmarkedThis home is ranked 80th out of 294 homes in Indiana. Shows total annual staff payroll benchmarked to the Indiana average. Higher payroll investment relative to peers often signals better staffing and less reliance on cheaper contract labor.Rankings are based only on facilities in Indiana that report data for that category. Facilities without available data are excluded from the ranking.Click the rank badge to see the full State ranking.Click here to see the full State ranking.
$2.8M 47.8% of net patient revenue Info Payroll as a share of revenue: staff salaries and wage-related benefits divided by net patient revenue. A higher figure means more of each revenue dollar goes to staff pay. Rank #140 / 294Payroll % — State benchmarkedThis home is ranked 140th out of 294 homes in Indiana. Shows payroll as a percentage of revenue versus the Indiana average. Well-run Indiana facilities typically land around 54–68% — the top third Statewide. Below 25% may signal understaffing or heavy agency use — read with Staffing ratings.Rankings are based only on facilities in Indiana that report data for that category. Facilities without available data are excluded from the ranking.Click the rank badge to see the full State ranking.Click here to see the full State ranking.
Other operating costs Info Everything it costs to run the home apart from payroll — food, utilities, supplies, maintenance, contract labor and administration. Calculated as total operating expense minus payroll (staff salaries and wage-related benefits).
$2.9M
Total costs Info The home's total operating expense for the year — all the costs of running it, salaries included (CMS cost report, Worksheet G-3).
$5.7M

What does this home offer?

Building type icon
Building type icon

Building Type: Single-story

On-site medical care and health services icon

On-site Medical Care and Health Services

Rehabilitative support icon

Rehabilitative Support

Who this home usually serves

TYPE OF STAY

Mostly long-term care residents

Most residents stay for extended periods and receive ongoing daily care.

Most new residents arrive under Medicaid (55% of admissions), and a typical Medicaid stay runs around 3 - 4 months.

Admissions
201 total

Coverage residents most often arrive under.

Medicare 14%
Private pay 31%
Medicaid 55%
Discharges
202 total

Coverage residents most often leave under.

Medicare 6%
Private pay 50%
Medicaid 44%

Places of interest near Wedgewood Healthcare Center

Address 3.1 miles from city center Info Estimated distance in miles from Clarksville's city center to Wedgewood Healthcare Center's address, calculated via Google Maps.

Calculate Travel Distance to Wedgewood Healthcare Center

Add your location

Address

Compare Nursing Homes around Jeffersonville

The information below is reported by the Indiana Department of Health, Division of Long Term Care.

3 facilities compared · CMS & IN Dept. of Health data

Hillcrest Village
NH
HC
NC
PC
RC
Jeffersonville
149
Facility 149
IN AVG 116
Rank #93 / 437
82.6%
Facility 82.6%
IN AVG 69.4%
Rank #80 / 434
+19%
2.83
Facility 2.83
IN AVG 3.44
Rank #245 / 291
0%-18%
$0
Facility $0
IN AVG $31.4k
Rank #1 / 293
70
Facility 70
IN AVG 83
Rank #326 / 384
31
Facility 31
IN AVG 25.0
Rank #195 / 292
2.8
Facility 2.8
IN AVG 4.1
Rank #69 / 292
-115-
66
Facility 66
IN AVG 37
Rank #103 / 587
Mark Bowman
$15.2M
Facility $15.2M
IN AVG $10.7M
Rank #82 / 294
$8.4M
Facility $8.4M
IN AVG $4.2M
Rank #40 / 294
55.6%
Facility 55.6%
IN AVG 42%
Rank #72 / 294
155203
Wedgewood Healthcare Center
NH
MC
Clarksville
124
Facility 124
IN AVG 116
Rank #157 / 437
85.1%
Facility 85.1%
IN AVG 69.4%
Rank #62 / 434
+23%
3.53
Facility 3.53
IN AVG 3.44
Rank #107 / 291
+13%+3%
$63.4k
Facility $63.4k
IN AVG $31.4k
Rank #285 / 293
-
46
Facility 46
IN AVG 25.0
Rank #254 / 292
5.1
Facility 5.1
IN AVG 4.1
Rank #207 / 292
296-
4
Facility 4
IN AVG 37
Rank #527 / 587
-
$5.9M
Facility $5.9M
IN AVG $10.7M
Rank #96 / 294
$2.8M
Facility $2.8M
IN AVG $4.2M
Rank #80 / 294
47.8%
Facility 47.8%
IN AVG 42%
Rank #140 / 294
155265
Green Valley Care Center
NH
New Albany
141
Facility 141
IN AVG 116
Rank #106 / 437
83.1%
Facility 83.1%
IN AVG 69.4%
Rank #76 / 434
+20%
3.45
Facility 3.45
IN AVG 3.44
Rank #130 / 291
-38%0%
$0
Facility $0
IN AVG $31.4k
Rank #1 / 293
-
24
Facility 24
IN AVG 25.0
Rank #153 / 292
2.2
Facility 2.2
IN AVG 4.1
Rank #37 / 292
1121-
4
Facility 4
IN AVG 37
Rank #527 / 587
Gregory Dattilo
$15.9M
Facility $15.9M
IN AVG $10.7M
Rank #40 / 294
$8.8M
Facility $8.8M
IN AVG $4.2M
Rank #30 / 294
55.2%
Facility 55.2%
IN AVG 42%
Rank #136 / 294
155070

Financial Assistance for
Nursing Home in Indiana

Wedgewood Healthcare Center is located in Clarksville, Indiana.
Here are the financial assistance programs available to residents in Indiana.

Get Financial aid guidance

Aged and Disabled Waiver

Indiana Medicaid A&D Waiver

Age 65+ or disabled
General Indiana resident, Medicaid-eligible, nursing home-level care need.
Income Limits (2025) ~$2,829/month 300% FBR, individual
Asset Limits $2,000 (individual), $3,000 (couple).
IN

Requires level-of-care determination.

Benefits
Personal care (5-7 hours/day) Respite (240 hours/year) Adult day care (~$60/day) Home health services

CHOICE Program

Indiana CHOICE

Age 60+
General Indiana resident, at risk of nursing home.
Income Limits ~$2,000/month varies
Asset Limits $10,000 individual
IN

Limited funding; regional variation.

Benefits
In-home care (3-5 hours/week) Respite (up to 10 days/year) Transportation (~5 trips/month)

Residential Care Assistance Program (RCAP)

Indiana Residential Care Assistance Program

Age 65+
General or blind, or disabled, Indiana resident, in approved facility, low-income or SSI recipient.
Income Limits (2025) ~$1,004/month including SSI
Asset Limits $2,000 (individual), $3,000 (couple).
IN

~50 facilities statewide; per diem rate set by FSSA.

Benefits
Room/board Laundry Minimal care coordination (~$20-$50/day subsidy)

Medicare Savings Program (MSP)

Indiana Medicare Savings Program

Age 65+ or disabled
General Indiana resident, Medicare Part A/B.
Income Limits (2025) ~$2,510/month (QMB), ~$3,380/month (SLMB), ~$3,598/month (QI)—individual.
Asset Limits $9,430 (individual), $14,130 (couple).
IN

Three tiers; no waitlist.

Benefits
Covers Part B premiums ($174.70/month) Deductibles ($240/year) Copays (~20%)

National Family Caregiver Support Program (NFCSP) Respite

Indiana NFCSP Respite Care

Age
General Caregivers of 60+ needing care or 55+ caregivers of others; Indiana resident; functional needs (2+ ADLs).
Income Limits (2025) Prioritizes ~$24,980/year (individual); no strict cap.
Asset Limits Not assessed; need-based.
IN

16 AAAs; prioritizes low-income, rural caregivers.

Benefits
Respite (4-6 hours/week or 5 days/year) Adult day care ($60/day) Caregiver training

VA Aid and Attendance (A&A) and Housebound Benefits

Indiana VA Aid and Attendance/Housebound

Age 65+ or disabled veteran/spouse
General Indiana resident, wartime service, need for ADL help (A&A) or homebound.
Income Limits (2025) Net income < ~$1,984/month (veteran with dependent, A&A); pension offsets income.
Asset Limits ~$155,356 net worth limit
IN

High veteran demand statewide.

Benefits
Cash (~$1,433-$2,642/month veteran, ~$951-$1,318 spouse) for care costs (e.g., in-home, assisted living)

Frequently Asked Questions about Wedgewood Healthcare Center

Is Wedgewood Healthcare Center in a walkable area?

Wedgewood Healthcare Center has a walk score of 4. Car-dependent. Most errands require a car, with limited nearby walkable options.

What is the occupancy rate at Wedgewood Healthcare Center?

Wedgewood Healthcare Center's occupancy is 85.1%.

Does Wedgewood Healthcare Center operate as a for-profit or non-profit?

Wedgewood Healthcare Center is registered as a for-profit.

Are there photos of Wedgewood Healthcare Center?

Yes — there are 6 photos of Wedgewood Healthcare Center in the photo gallery on this page.

What is the address of Wedgewood Healthcare Center?

Wedgewood Healthcare Center is located at 101 Potters Ln, Clarksville, IN 47129.

What is the phone number of Wedgewood Healthcare Center?

(812) 948-0808 will put you in contact with the team at Wedgewood Healthcare Center.

Is Wedgewood Healthcare Center Medicare or Medicaid certified?

Yes — Wedgewood Healthcare Center is a CMS-certified provider of Medicare and Medicaid.

Guides for Better Senior Living

Care Cost Calculator: See Prices in Your Area

Nursing Home Data Explorer

Don’t Wait Too Long: 7 Red Flag Signs Your Parent Needs Assisted Living Now

The True Cost of Assisted Living in 2025 – And How Families Are Paying For It

Understanding Senior Living Costs: Pricing Models, Discounts & Financial Assistance