


Re-hospitalized after SNF stay
 Percentage of short-stay residents who were re-hospitalized after their nursing home admission.
31.4%
Percentage of short-stay residents who were re-hospitalized after their nursing home admission.
31.4%
Ohio average: 25.1%


Wesley Glen Retirement Community, situated in Columbus, Ohio, has everything you or your loved one needs. The senior home aims to enhance the quality of living for their memory care residents. Management and staff strive to be worthy of the trust that many families have placed in them. Wesley Glen ensures that aging is a seamless process for seniors– having them age with grace and fulfillment.
The retirement home offers engaging memory care activities and programs, to name a few recreational, fitness, and entertainment programs available for residents to participate in. Residents who need assistance are guaranteed personalized services uniquely designed to meet their needs, especially those suffering from dementia and Alzheimer’s, delivered by the professional nursing staff ready to supervise and guide their physicians whenever required.
Staffing hours
![]() Daily nursing hours per resident by staff type, reported to CMS. Higher is generally better — compare this facility to state and national averages to see where staffing stands.
Daily nursing hours per resident by staff type, reported to CMS. Higher is generally better — compare this facility to state and national averages to see where staffing stands.
Hours per resident per day vs Ohio averages
Total nursing care
![]() This home is ranked 6th out of 177 homes in Ohio for nurse hours. Total adjusted nursing hours per resident per day, combining RN, LPN, and aide time. CMS adjusts this for case-mix so facilities can be fairly compared.
This home is ranked 6th out of 177 homes in Ohio for nurse hours. Total adjusted nursing hours per resident per day, combining RN, LPN, and aide time. CMS adjusts this for case-mix so facilities can be fairly compared.
5h 33m
57% above state avgAll 6 underlying metrics are above the state average
Wesley Glen is administered by Tom Widney.
In Ohio, the Department of Health, Bureau of Survey and Certification conducts unannounced onsite inspections to evaluate the quality of care and environment in all licensed facilities.
Citations
| This Facility | OH Average | vs. OH Avg |
|---|---|---|---|
|
Total citations
| 4 | 2 | This facility has 100% more total citations than a typical Ohio nursing home (4 vs. OH avg 2).↑ 100% worse |
Every two years, the Ohio Department of Aging and the Office of the State Long-Term Care Ombudsman organizations conduct a satisfaction survey among residents in long-term care facilities to assess their quality of care and life.
Ohio average: 86 / 100
Ohio average: 89 / 100
Ohio average: 95 / 100
Ohio average: 82 / 100
Ohio average: 86 / 100
Ohio average: 89 / 100
Ohio average: 80 / 100
Ohio average: 81 / 100
Based on the RCF Resident Satisfaction Survey 2022-23, Final Results
Have you gotten or are you getting physical therapy, occupational therapy or speech therapy, while living at this care facility?
This facility54/100
Ohio average46/100
Did (Do) the therapists help you set goals?
This facility75/100
Ohio average89/100
Did (Do) you know who to speak to about your therapy progress?
This facility88/100
Ohio average85/100
Did (Does) the therapy help you meet your goals?
This facility94/100
Ohio average88/100
Can you decide how to spend your day?
This facility97/100
Ohio average94/100
Scores represent percent of positive resident responses for each item, excluding "don't know" and "not applicable" responses and instances where the question was skipped.
Based on the RCF Resident Satisfaction Survey 2022-23, Final Results
Are you able to get around the building if you want to?
This facility86/100
Ohio average95/100
Can you enjoy the outdoors if you want to?
This facility89/100
Ohio average91/100
Do you feel you have enough privacy?
This facility95/100
Ohio average95/100
Can you find a place to be alone if you want to be alone?
This facility97/100
Ohio average96/100
Is it easy for you to get around in your room (or apartment)?
This facility97/100
Ohio average96/100
Is it very clean here?
This facility100/100
Ohio average96/100
Are your personal items safe here?
This facility100/100
Ohio average92/100
Do you feel safe here?
This facility100/100
Ohio average98/100
Scores represent percent of positive resident responses for each item, excluding "don't know" and "not applicable" responses and instances where the question was skipped.
Based on the RCF Resident Satisfaction Survey 2022-23, Final Results
Did you receive a thorough orientation to WESLEY GLEN, THE HEALTH CENTER?
This facility70/100
Ohio average70/100
Were you given enough information to learn how things work here?
This facility80/100
Ohio average82/100
Did you feel warmly welcomed as a new resident?
This facility88/100
Ohio average93/100
Scores represent percent of positive resident responses for each item, excluding "don't know" and "not applicable" responses and instances where the question was skipped.
Based on the RCF Resident Satisfaction Survey 2022-23, Final Results
Do the people who work here tell you when rules, policies, and procedures change?
This facility60/100
Ohio average78/100
Are you encouraged to speak up about things you don’t like here?
This facility69/100
Ohio average81/100
Are you friends with anyone who lives here?
This facility71/100
Ohio average81/100
Do the people who work here go above and beyond to give you a good life?
This facility79/100
Ohio average87/100
Do the people who work here help you with technology, if needed?
This facility79/100
Ohio average89/100
Are you as involved in decisions about your care as you want to be?
This facility82/100
Ohio average85/100
Would you highly recommend WESLEY GLEN, THE HEALTH CENTER to someone who needs this type of care?
This facility85/100
Ohio average89/100
Overall, are you satisfied with the care you receive here?
This facility86/100
Ohio average94/100
Do the people who work here seem happy to work here?
This facility88/100
Ohio average92/100
Are your concerns taken care of in a timely way?
This facility92/100
Ohio average86/100
Scores represent percent of positive resident responses for each item, excluding "don't know" and "not applicable" responses and instances where the question was skipped.
Based on the RCF Resident Satisfaction Survey 2022-23, Final Results
Do you feel confident the people who work here would come quickly anytime you needed help?
This facility69/100
Ohio average85/100
Do the same people take care of you most of the time?
This facility80/100
Ohio average84/100
Do the people who care for you explain your care and services to you?
This facility81/100
Ohio average85/100
Do the people who work here do things the way you want them done?
This facility83/100
Ohio average88/100
Do the people who work here check on you often enough to see if you need anything?
This facility83/100
Ohio average81/100
Do the people who work here ever get angry at you?
This facility84/100
Ohio average88/100
Are the people who work here knowledgeable about your medical conditions and treatments?
This facility86/100
Ohio average90/100
Do the people who work here do everything they can to protect you from getting sick?
This facility91/100
Ohio average94/100
Do the people who work here support you to do as much for yourself as you are able to do?
This facility94/100
Ohio average96/100
Do you have opportunities to maintain your health and wellness, if you want?
This facility94/100
Ohio average92/100
Do the people who work here make sure you are comfortable when they provide care or services?
This facility97/100
Ohio average95/100
Scores represent percent of positive resident responses for each item, excluding "don't know" and "not applicable" responses and instances where the question was skipped.
Based on the RCF Resident Satisfaction Survey 2022-23, Final Results
Do you have enough opportunities to go on outings and special events?
This facility69/100
Ohio average73/100
Are there enjoyable things to do on the weekends, if you want?
This facility69/100
Ohio average63/100
Are you as connected to the community as you want to be?
This facility69/100
Ohio average71/100
Do you have something to look forward to most days?
This facility72/100
Ohio average77/100
Do you usually enjoy how you spend your time?
This facility77/100
Ohio average87/100
Do you have plenty of opportunities to do things that are meaningful to you?
This facility77/100
Ohio average83/100
Do you like the activities here?
This facility81/100
Ohio average83/100
Do you feel included in life here?
This facility86/100
Ohio average89/100
Are you able to do the activities offered here, if you want?
This facility89/100
Ohio average93/100
Scores represent percent of positive resident responses for each item, excluding "don't know" and "not applicable" responses and instances where the question was skipped.
Based on the RCF Resident Satisfaction Survey 2022-23, Final Results
Do you have input on the food that is served?
This facility58/100
Ohio average68/100
Does the menu change often enough?
This facility78/100
Ohio average77/100
Do you look forward to mealtimes?
This facility81/100
Ohio average80/100
Do you get enough fresh food options here?
This facility89/100
Ohio average81/100
Do you like the food here?
This facility97/100
Ohio average81/100
Do you get enough to eat here?
This facility97/100
Ohio average95/100
Scores represent percent of positive resident responses for each item, excluding "don't know" and "not applicable" responses and instances where the question was skipped.
The Scripps Gerontology Center at Miami University conducts a satisfaction survey among residents' family members, friends and guardians to assess quality of care and life.
Ohio average: 77 / 100
Ohio average: 80 / 100
Ohio average: 78 / 100
Ohio average: 85 / 100
Ohio average: 78 / 100
Ohio average: 78 / 100
Ohio average: 68 / 100
Ohio average: 67 / 100
Profile of respondents of this survey
100=Definitely Yes, 67=Probably Yes, 33=Probably No, 0=Definitely No
Does this living arrangement help the resident maintain their independence?:
This facility77/100
Ohio average84/100
Do you have enough opportunities for input into decisions about your resident’s care?:
This facility62/100
Ohio average78/100
Do you get enough information to make decisions with or about your resident?:
This facility61/100
Ohio average77/100
Scores represent percent of positive responses for each item based on the latest Family Satisfaction Survey results
100=Definitely Yes, 67=Probably Yes, 33=Probably No, 0=Definitely No
Is the residential care facility thoroughly clean?:
This facility89/100
Ohio average83/100
Can the resident get outside often enough?:
This facility52/100
Ohio average74/100
Are the resident’s belongings safe?:
This facility79/100
Ohio average79/100
Scores represent percent of positive responses for each item based on the latest Family Satisfaction Survey results
100=Definitely Yes, 67=Probably Yes, 33=Probably No, 0=Definitely No
When the resident moved in, were you given thorough information to help you know
This facility—/100
Ohio average—/100
what to expect?:
This facility80/100
Ohio average85/100
Was the resident given a thorough orientation to residential care?:
This facility63/100
Ohio average80/100
Did you feel warmly welcomed as a new family member?:
This facility90/100
Ohio average90/100
Scores represent percent of positive responses for each item based on the latest Family Satisfaction Survey results
100=Definitely Yes, 67=Probably Yes, 33=Probably No, 0=Definitely No
Are you encouraged to speak up when you have a problem?:
This facility83/100
Ohio average83/100
Are your concerns addressed in a timely way?:
This facility65/100
Ohio average78/100
Are you kept well informed about how things are going with your resident?:
This facility58/100
Ohio average76/100
Do the staff seem happy to work at the residential care facility?:
This facility80/100
Ohio average77/100
Do the staff go above and beyond to give your resident a good life?:
This facility60/100
Ohio average76/100
Do you feel confident that staff would help your resident beyond their personal care
This facility—/100
Ohio average—/100
needs if you could not (eg, paperwork, purchasing clothing)?:
This facility45/100
Ohio average69/100
Do you have peace of mind about the care your resident is getting when you aren’t at
This facility—/100
Ohio average—/100
the residential care facility?:
This facility68/100
Ohio average82/100
Would you highly recommend this residential care facility to a family member or friend?:
This facility71/100
Ohio average79/100
Scores represent percent of positive responses for each item based on the latest Family Satisfaction Survey results
100=Definitely Yes, 67=Probably Yes, 33=Probably No, 0=Definitely No
Do you feel confident the staff is knowledgeable about the resident’s medical
This facility—/100
Ohio average—/100
condition(s) and treatment(s)?:
This facility70/100
Ohio average79/100
Do the staff know what the resident likes and doesn’t like?:
This facility65/100
Ohio average79/100
Do the staff regularly check to see if the resident needs anything?:
This facility56/100
Ohio average77/100
Have you gotten to know the staff who care for your resident?:
This facility77/100
Ohio average78/100
Do the staff encourage your resident to be as independent as they are able to be?:
This facility73/100
Ohio average82/100
Do you feel confident staff would come quickly anytime your resident needed help?:
This facility57/100
Ohio average77/100
Scores represent percent of positive responses for each item based on the latest Family Satisfaction Survey results
100=Definitely Yes, 67=Probably Yes, 33=Probably No, 0=Definitely No
Does the resident have something enjoyable to look forward to most days?:
This facility67/100
Ohio average71/100
Do the staff do a good job keeping the resident connected to the community?:
This facility57/100
Ohio average72/100
Does the resident have plenty of opportunities to do things that are meaningful to them?:
This facility67/100
Ohio average71/100
Does the residential care facility have enough opportunities for your resident to go on
This facility—/100
Ohio average—/100
special outings and events?:
This facility65/100
Ohio average63/100
Does the resident like the provided activities?:
This facility65/100
Ohio average69/100
Does the residential care facility provide things the resident enjoys doing on the
This facility—/100
Ohio average—/100
weekend?:
This facility48/100
Ohio average56/100
Do you have plenty of opportunities to be involved in the residential care facility?:
This facility74/100
Ohio average72/100
Scores represent percent of positive responses for each item based on the latest Family Satisfaction Survey results
100=Definitely Yes, 67=Probably Yes, 33=Probably No, 0=Definitely No
Is there a lot of variety in the meals?:
This facility71/100
Ohio average70/100
Are you included in mealtimes if you want to be?:
This facility37/100
Ohio average65/100
Is the food good?:
This facility65/100
Ohio average68/100
Scores represent percent of positive responses for each item based on the latest Family Satisfaction Survey results
Federal penalties imposed by CMS for regulatory violations, including civil money penalties (fines) and denials of payment for new Medicare/Medicaid admissions.
Source: CMS Penalties Database
No penalties in the past 3 years
No civil money penalties or payment denials were reported in the last 3 years.
These measures show how residents usually do over time at this home, based on health outcomes and preventive care.
Ohio average: 25.1%
Ohio average: 12.5%
Ohio average: 0.8%
Ohio average: 53.7%
Ohio average: 50.6%
Quality measures are calculated from Minimum Data Set (MDS) assessments. For most measures, lower percentages indicate better care quality.
18% of new residents, usually for short-term rehab.
81% of new residents, often for short stays.
1% of new residents, often for long-term daily care.
Based on CMS SNF Cost Report for fiscal year ending in 12/2023.
Minimum Age: 55 Years Old
Pets Allowed
Housing Options: Studio / 1 Bed
Building Type: Mid-rise
Transportation Services
Fitness and Recreation
Residents typically stay for brief periods, with frequent admissions and discharges throughout the year.
Most new residents arrive under private pay (81% of admissions), and a typical private pay stay runs around 1 months.
Coverage residents most often arrive under.
Coverage residents most often leave under.
![]() 7.4 miles from city center
7.4 miles from city center
![]() Estimated distance in miles from Columbus's city center to Wesley Glen's address, calculated via Google Maps.
— 2.7 miles to nearest hospital (OhioHealth Riverside Methodist Hospital and Emergency Department)
Estimated distance in miles from Columbus's city center to Wesley Glen's address, calculated via Google Maps.
— 2.7 miles to nearest hospital (OhioHealth Riverside Methodist Hospital and Emergency Department)
Add your location
Info below is compiled from CMS reports & the OH Dept. of Health, senior community websites & trusted data sources such as Walk Score & BBB.
Communities are listed from highest to lowest based on our ranking methodology.
| Westerwood | NH AL IL MC RC SNF | Columbus (Northland) | 75
Facility
75
OH AVG
75
Rank
#149 / 306 |
83.1%
Facility
83.1%
OH AVG
81.7
Rank
#82 / 135 | +2% | 4.39
Facility
4.39
OH AVG
3.54
Rank
#21 / 177 | +26% | +24% | $0
Facility
$0
OH AVG
$74.0k
Rank
#1 / 178 | 16
Facility
16
OH AVG
30.9
Rank
#40 / 178 | 2.3
Facility
2.3
OH AVG
4.6
Rank
#15 / 178 | - | 62 | - |
26
Facility
26
OH AVG
42
Rank
#489 / 673 | United Church Homes Management, Inc | $8.5MFiscal year ending 06/2024
Facility
$8.5MFiscal year ending 06/2024
OH AVG
$9.6M
Rank
#95 / 172 | $5.7MFiscal year ending 06/2024
Facility
$5.7MFiscal year ending 06/2024
OH AVG
$5.2M
Rank
#55 / 172 | 66.8%Fiscal year ending 06/2024
Facility
66.8%Fiscal year ending 06/2024
OH AVG
55.7%
Rank
#24 / 172 | 365399 | ||||
| Worthington Christian Village | NH AL IL SNF | Columbus (Olentangy High Bluffs) | 40
Facility
40
OH AVG
75
Rank
#247 / 306 |
80.0%
Facility
80.0%
OH AVG
81.7
Rank
#92 / 135 | -2% | 5.68
Facility
5.68
OH AVG
3.54
Rank
#5 / 177 | +29% | +60% | $0
Facility
$0
OH AVG
$74.0k
Rank
#1 / 178 | 11
Facility
11
OH AVG
30.9
Rank
#24 / 178 | 5.5
Facility
5.5
OH AVG
4.6
Rank
#138 / 178 | - | 32 | A+ |
30
Facility
30
OH AVG
42
Rank
#446 / 673 | Lynn Borton | $3.8MFiscal year ending 12/2023
Facility
$3.8MFiscal year ending 12/2023
OH AVG
$9.6M
Rank
#162 / 172 | $2.7MFiscal year ending 12/2023
Facility
$2.7MFiscal year ending 12/2023
OH AVG
$5.2M
Rank
#150 / 172 | 70.5%Fiscal year ending 12/2023
Facility
70.5%Fiscal year ending 12/2023
OH AVG
55.7%
Rank
#11 / 172 | 365671 | ||||
| Ohio Living Westminster – Thurber | NH AL IL MC SNF | Columbus (Harrison West) | 73
Facility
73
OH AVG
75
Rank
#153 / 306 |
39.7%
Facility
39.7%
OH AVG
81.7
Rank
#131 / 135 | -51% | 5.17
Facility
5.17
OH AVG
3.54
Rank
#9 / 177 | +14% | +46% | $14.7k
Facility
$14.7k
OH AVG
$74.0k
Rank
#137 / 178 | 22
Facility
22
OH AVG
30.9
Rank
#64 / 178 | 3.7
Facility
3.7
OH AVG
4.6
Rank
#69 / 178 | 2 | 29 | A+ |
71
Facility
71
OH AVG
42
Rank
#62 / 673 | Sydney Mcbride | $4.5MFiscal year ending 06/2024
Facility
$4.5MFiscal year ending 06/2024
OH AVG
$9.6M
Rank
#153 / 172 | $2.9MFiscal year ending 06/2024
Facility
$2.9MFiscal year ending 06/2024
OH AVG
$5.2M
Rank
#147 / 172 | 65.1%Fiscal year ending 06/2024
Facility
65.1%Fiscal year ending 06/2024
OH AVG
55.7%
Rank
#31 / 172 | 365416 | ||||
| Wesley Glen Retirement Community | NH AL HOS IL MC SNF | Columbus (Sharon Heights) | 29
Facility
29
OH AVG
75
Rank
#277 / 306 | - | - | 5.54
Facility
5.54
OH AVG
3.54
Rank
#6 / 177 | -26% | +57% | $0
Facility
$0
OH AVG
$74.0k
Rank
#1 / 178 | 30
Facility
30
OH AVG
30.9
Rank
#93 / 178 | 6.0
Facility
6.0
OH AVG
4.6
Rank
#151 / 178 | 1 | 51 | - |
81
Facility
81
OH AVG
42
Rank
#22 / 673 | Celia Conlon | $6.5MFiscal year ending 12/2023
Facility
$6.5MFiscal year ending 12/2023
OH AVG
$9.6M
Rank
#132 / 172 | $5.1MFiscal year ending 12/2023
Facility
$5.1MFiscal year ending 12/2023
OH AVG
$5.2M
Rank
#76 / 172 | 78.2%Fiscal year ending 12/2023
Facility
78.2%Fiscal year ending 12/2023
OH AVG
55.7%
Rank
#5 / 172 | 365504 |
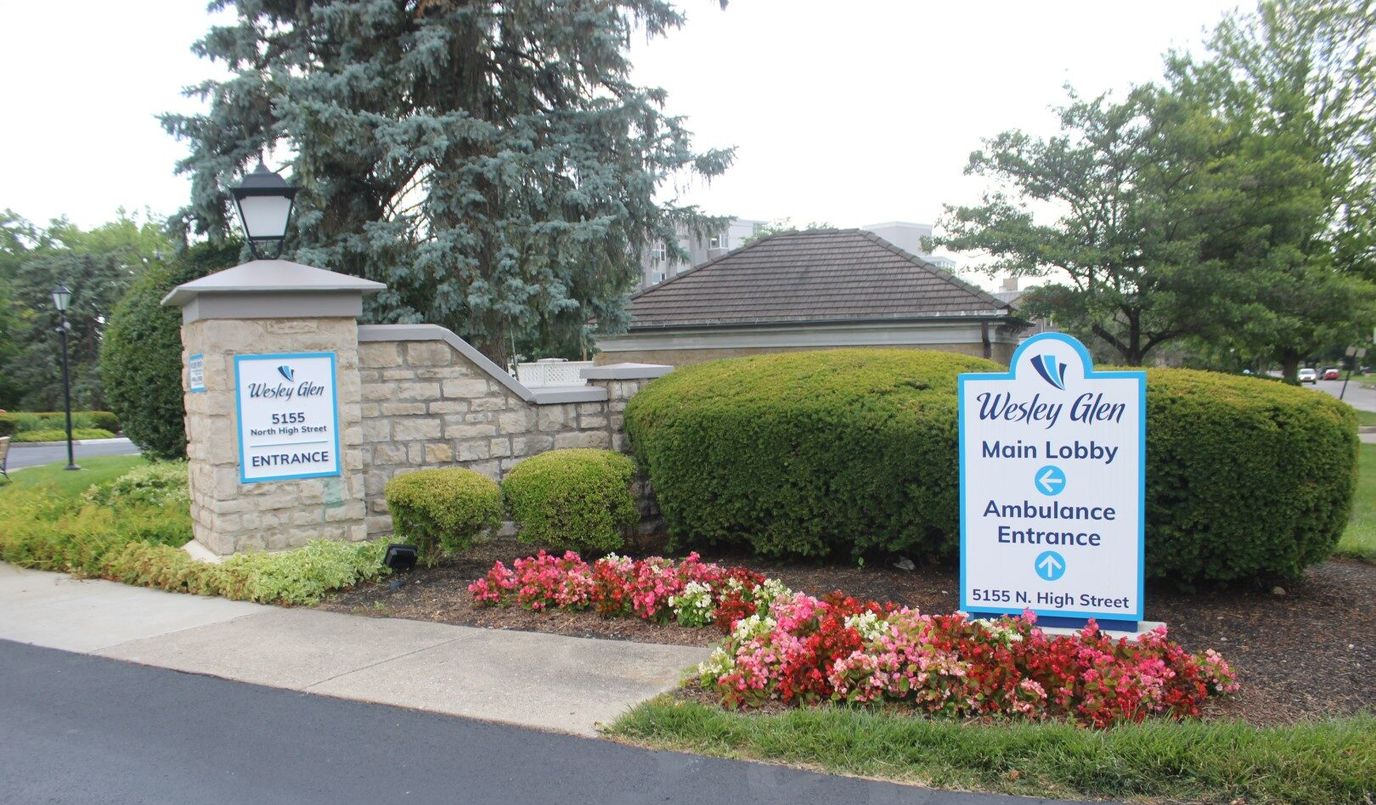
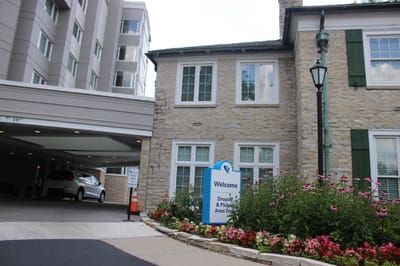
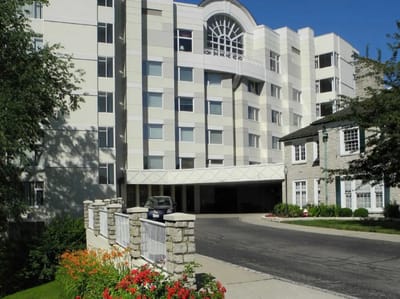
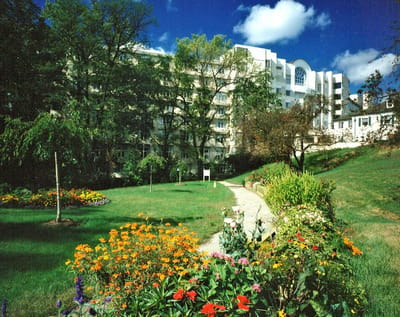
Wesley Glen is located in Columbus, Ohio.
Here are the financial assistance programs available to residents in Ohio.
Wesley Glen is in the Sharon Heights neighborhood of Columbus.
Wesley Glen has a walk score of 81. Very walkable. Most errands can be accomplished on foot, and many essentials are within a short walk.
Wesley Glen's occupancy is 76.4%.
Yes, Wesley Glen allows residents to bring their pets.
Wesley Glen is registered as a non-profit in OH.
Tom Widney is the administrator of Wesley Glen.
Wesley Glen has 29 beds.
Care Cost Calculator: See Prices in Your Area
Nursing Home Data Explorer
Don’t Wait Too Long: 7 Red Flag Signs Your Parent Needs Assisted Living Now
The True Cost of Assisted Living in 2025 – And How Families Are Paying For It
Understanding Senior Living Costs: Pricing Models, Discounts & Financial Assistance


