Explore Open Rooms
1 Contact details
2 What type of senior care service are you looking for?
3 What budget do you have in mind for senior care?
4 How soon do you need to find care?
5 Additional details

Thank you for your interest!

Our team will be in touch shortly to help with next steps.

Nursing Home in Warwick

CMS overall rating Info The Overall CMS Rating combines results from health inspections, staffing levels and quality measures. Health inspections carry the most weight. Staffing and quality scores can increase or decrease the final rating based on performance compared to state and national standards.

West View Nursing & Rehabilitation Center

Overview of West View Nursing & Rehabilitation Center

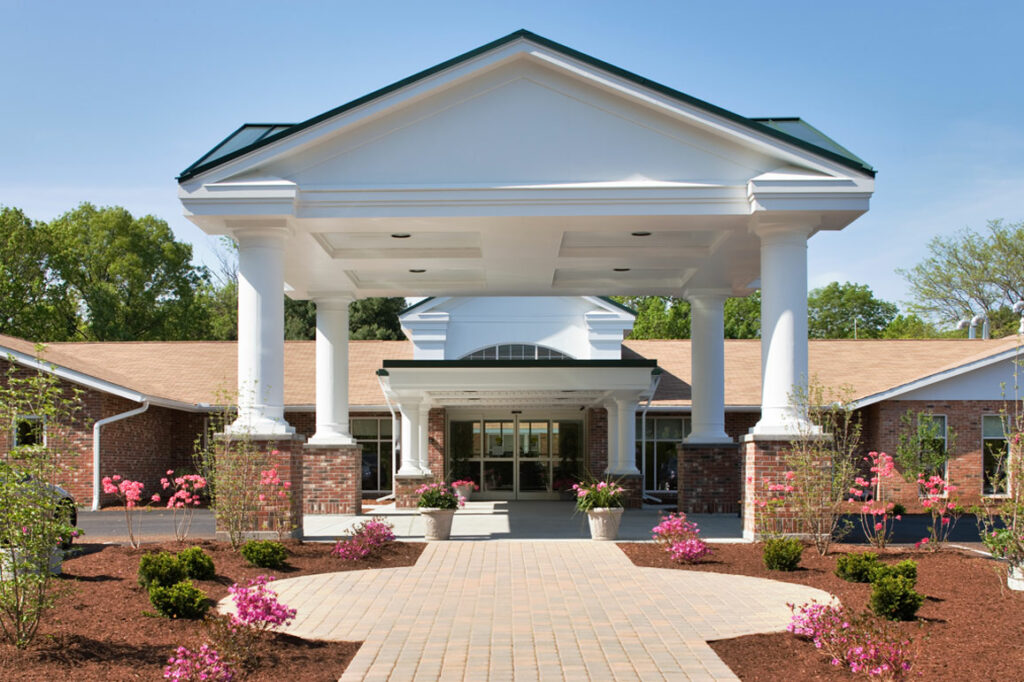
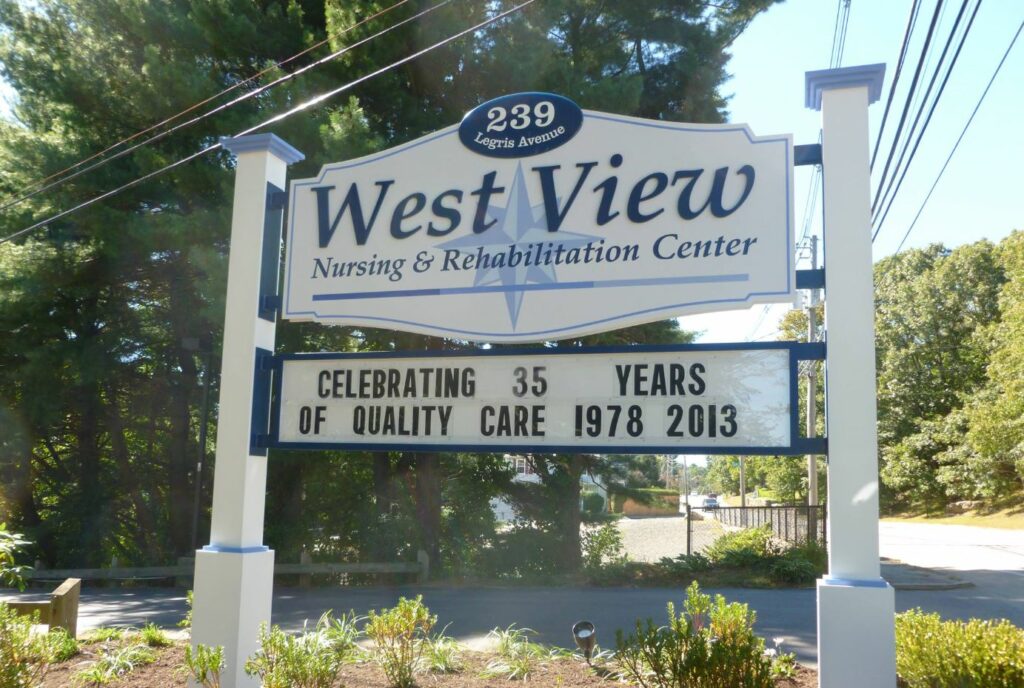
Situated in West Warwick, RI, West View Nursing & Rehabilitation is a trusted senior care provider, offering rehabilitation, skilled nursing care, and hospice care. Their team of healthcare professionals collaborate closely with every resident and their family to achieve the highest level of recovery and satisfaction, all in a warm and caring environment. They achieve this goal through a variety of services including therapeutic activities, social work, dietitian counseling, and chaplaincy services.

Ensuring all aspects of its residents well-being are given utmost attention, West View organizes a broad range of stimulating activities and provides access to an array of convenient amenities. Residents enjoy the convenience of having housekeeping, laundry, dietary, and salon services all at the comfort of their community. Physical, occupational and speech therapy are available to help residents regain their strengths and continue living the lifestyle they desire.

(401) 828-9000

Managed by Marissa Murphy

Administrator

Over 15 years of experience

Marissa Murphy is the Administrator at West View Nursing & Rehabilitation Center, bringing over 15 years of experience in nursing facility management. She specializes in regulatory compliance, business development, and workforce management. Marissa oversees the center’s financial and clinical operations with a strong focus on quality care and exceptional customer service. She is a licensed nursing home administrator and holds an MBA in Healthcare Management.

Quality ratings

Measured by Centers for Medicare & Medicaid Services (CMS)

Overall rating Info The Overall CMS Rating combines results from health inspections, staffing levels and quality measures. Health inspections carry the most weight. Staffing and quality scores can increase or decrease the final rating based on performance compared to state and national standards.
1/5
Rhode Island average: 2.9/5
Health Inspection Info Based on the results of the facility's three most recent standard inspections and any complaint investigations. CMS reviews the number, scope, and severity of deficiencies, with more recent findings weighted more heavily.
1/5
Rhode Island average: 2.7/5
Staffing Info Measures average nursing staff hours per resident per day, including Registered Nurses (RNs) and total nursing staff. Ratings are adjusted based on the level of care residents require and are compared to state and national benchmarks.
3/5
Rhode Island average: 3.7/5
Quality Measures Info Based on clinical and physical health indicators reported to CMS, such as hospital readmissions, falls, pressure ulcers, and improvements in mobility. These measures reflect how well residents' health needs are being managed.
2/5
Rhode Island average: 3.1/5

Nursing care per resident

Info This shows how many total hours of nursing staff time are available per resident each day. Higher numbers usually mean more staff support.
3h 11m per day

This home provides 22% less nursing time per resident than the Rhode Island average.

Rhode Island average: 4h 6m per day

Staffing hours breakdown

Info Hours of care per resident per day, broken down by staff type. Data from CMS Medicare.
Staff type Facility State avg National avg
Registered Nurse (RN) Info Registered nurse hours per resident per day. 1h 16m per day 46m per day 41m per day
Nurse Aide Info Nurse aide hours per resident per day. 2h 23m per day 2h 28m per day 2h 21m per day
Total Nursing (Weekend) Info Total number of nurse staff hours per resident per day on weekends. 3h 32m per day 3h 18m per day 3h 26m per day
Physical Therapist Info Physical therapist staff hours per resident per day. 4m per day 3m per day 4m per day
RN (Weekend) Info Registered nurse hours per resident per day on weekends. 1h 3m per day 34m per day 29m per day

Capacity and availability

Medium-capacity home

Offers a balance of services and community atmosphere.

Total beds 120

This home usually has availability

Lower occupancy suggests more openings may be available.

Lower demand than the Rhode Island average
Occupancy rate 73.5%
Residents per day (avg) 98
Occupancy rate
73.5%
Residents per day (avg)
98

Who this home usually serves

TYPE OF STAY

Primarily short stays

Residents typically stay for brief periods, with frequent admissions and discharges throughout the year.

Might be optimal for
Post-acute recovery Temporary care Transitional stays

Breakdown by payment type

Medicare

29% of new residents, usually for short-term rehab.

Typical stay 20 days

Private pay

65% of new residents, often for short stays.

Typical stay 1 - 2 months

Medicaid

6% of new residents, often for long-term daily care.

Typical stay 1 - 2 years

Finances and operations

Privately-owned community
Operated by a business corporation.
Home revenue
$13.5M
Profit
$1.2M
Privately-owned community Operated by a business corporation.
Home revenue
$13.5M
Profit
$1.2M
Payroll costs Info The portion of the home's budget spent on staff, including nurses, caregivers, and other employees who support care and operations.
$5.8M
42.5% of revenue
Other operating costs Info All remaining costs needed to run the home, such as food, utilities, building maintenance, supplies and administrative expenses.
$6.6M
Total costs $12.3M
Bed community size
120-bed community
A larger shared setting that may offer more common spaces and organized community services.
Years in operation
8 years in operation
An established community with some operational experience and growing routines.
Walk Score
Walk Score: 52 / 100
Moderately walkable. Some errands can be accomplished on foot, with a mix of nearby amenities.

About this community

License Details

Facility TypeNursing Facility
StatusActive
IssuanceJanuary 2, 2018
ExpirationDecember 31, 2025

Additional Licensing Details

License NumberLTC00807
CertificationsSafe Zone Certified

Ownership & Operating Entity

West View Nursing & Rehabilitation Center is legally operated by Marissa Murphy, Administrator.

Type Of Units

Nursing Home
120 units
Total beds
120 units

Payment & Insurance

2 services
Accept Medicaid
Accept Medicare

Therapy & Rehabilitation

1 service
Rehabilitation Services

Staffing & Medical

3 services
Doctor on Staff
Skilled Nursing
24-Hour Staffing

Amenities & Lifestyle

8 amenities
Barber And Beauty Shop
Housekeeping
Laundry
24-Hour Admissions And Discharges
Rapid Response To All Referrals
Preadmission Screening
Case Management
Discharge Planning
Specific ProgramsRehabilitation, Skilled Nursing Care, Hospice Care, Alzheimer’s Program

Pricing & Financial Information

What does this home offer?

Housing options icon

Housing Options: Private Rooms

Building type icon
Building type icon

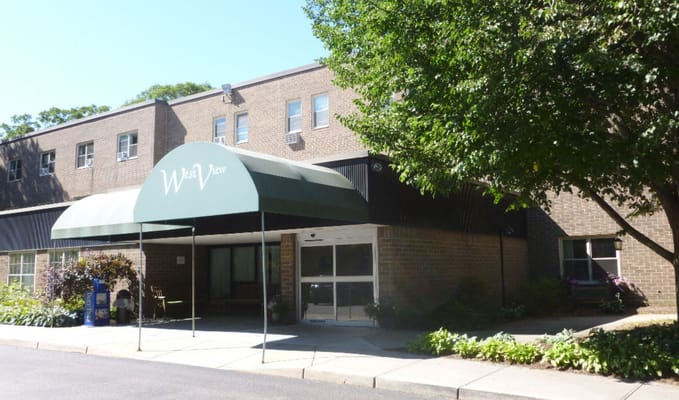
Building Type: Two-story

Types of Care at West View Nursing & Rehabilitation Center

Nursing Home Hospice Care

Access & Eligibility

Ways to qualify for care at this community, including accepted programs and payment options.

Medicaid Accepted

This facility is certified for eligible Medicaid services.

Medicare Accepted

This facility is certified for eligible Medicare services.

Payment & Funding Options

Medicaid Medicare Long-term care insurance

Inspection History

In Rhode Island, the Department of Health, Center for Health Facilities Regulation is the primary authority for inspecting, licensing, and reporting on all long-term care facilities.

6 visits/inspections

2 visits/inspections triggered by complaints

3 routine inspections

Results

6 with issues

0 without issues

Latest inspection

Date December 2, 2025
Complaint Investigation

28 deficiencies

Deficiencies indicate regulatory issues. A higher number implies the facility had several areas requiring improvement.

Rhode Island average: 34 deficiencies

Health Inspection History

Inspections
Total health inspections 5

Rhode Island average 8.3


Last Health inspection on Jun 2025

Total health citations 27

Rhode Island average 28.1

Citations per inspection
5.4

Rhode Island average 3.48


Health citations are formal notices following inspections when they fail to comply with safety and care standards.

23 of 27 citations resulted from standard inspections; and 4 of 27 resulted from complaint investigations.

Breakdown of citation severity (last 3 years)
Critical Health citations More info 2
25% worse than Rhode Island average

Rhode Island average: 1.6


Serious Health citations More info 4
135% worse than Rhode Island average

Rhode Island average: 1.7

2 critical citations More info Rhode Island average: 1.6

4 serious citations More info Rhode Island average: 1.7

20 moderate citations More info Rhode Island average: 24.3

1 minor citation More info Rhode Island average: 0.5
Citations history (last 3 years)
Quality of Care moderate citation Info Issues related to how well residents receive appropriate treatment and support for their medical and daily care needs. Jun 11, 2025
Corrected

Quality of Care moderate citation Info Issues related to how well residents receive appropriate treatment and support for their medical and daily care needs. Jun 11, 2025
Corrected

Abuse/Neglect moderate citation Info Issues related to protecting resident's from harm, including abuse, neglect, or mistreatment. Mar 03, 2025
Corrected

Abuse/Neglect critical citation Info Issues related to protecting resident's from harm, including abuse, neglect, or mistreatment. Mar 03, 2025
Corrected

Compare Nursing Homes around Warwick The information below is reported by the Rhode Island Department of Health, Center for Health Facilities Regulation.

5 facilities compared · CMS & RI Dept. of Health data · Updated Apr 2026

Filter by care type
Kent Regency Center
NH

Nursing Home Licensed facility providing 24/7 skilled nursing care for residents with complex, ongoing medical needs. Staffed by RNs, LPNs, and CNAs. Inspected and star-rated annually by CMS. Accepts Medicare (short-term rehab) and Medicaid (long-term care).

RC

Respite Care Short-term temporary care — days to weeks — to give family caregivers a break. Full care provided during the stay. Often used after hospitalization or to trial a facility before a permanent placement decision.

Warwick
153
94.7%
+13%
2.85
+14%
-29%
0
22
2.4
0
144
-
21
Genesis Ri Holdings Llc
$28.4M
$8.1M
28.7%
415009
Avalon Nursing Home
NH

Nursing Home Licensed facility providing 24/7 skilled nursing care for residents with complex, ongoing medical needs. Staffed by RNs, LPNs, and CNAs. Inspected and star-rated annually by CMS. Accepts Medicare (short-term rehab) and Medicaid (long-term care).

Warwick
31
97.1%
+16%
4.84
+31%
+21%
0
25
5.0
1
30
A+
47
Kowalik, David
-
-
-
415060
Brentwood Nursing Home
AL

Assisted Living A licensed, long-term care setting for seniors or individuals with disabilities who need help with daily activities — like bathing, dressing, and medication management — but not 24-hour skilled nursing. Offers housing, meals, and around-the-clock support while aiming to maximize resident independence.

HC

Home Care Professional care delivered in the person's own home — from companionship and errands to skilled nursing and therapy. Allows seniors to age in place. Medicare covers skilled home health when medically necessary.

NH

Nursing Home Licensed facility providing 24/7 skilled nursing care for residents with complex, ongoing medical needs. Staffed by RNs, LPNs, and CNAs. Inspected and star-rated annually by CMS. Accepts Medicare (short-term rehab) and Medicaid (long-term care).

Warwick
57
91.6%
+9%
3.94
-40%
-2%
3
33
4.1
5
82
C+
23
Pollack, Joseph
$7.2M
$3.4M
47.4%
415023
Sunny View Nursing Home
HC

Home Care Professional care delivered in the person's own home — from companionship and errands to skilled nursing and therapy. Allows seniors to age in place. Medicare covers skilled home health when medically necessary.

NH

Nursing Home Licensed facility providing 24/7 skilled nursing care for residents with complex, ongoing medical needs. Staffed by RNs, LPNs, and CNAs. Inspected and star-rated annually by CMS. Accepts Medicare (short-term rehab) and Medicaid (long-term care).

Warwick
57
92.9%
+11%
3.94
-40%
-2%
3
33
4.1
5
50
-
33
Pollack, Joseph
$7.2M
$3.4M
47.4%
415023
West View Nursing & Rehabilitation Center
NH

Nursing Home Licensed facility providing 24/7 skilled nursing care for residents with complex, ongoing medical needs. Staffed by RNs, LPNs, and CNAs. Inspected and star-rated annually by CMS. Accepts Medicare (short-term rehab) and Medicaid (long-term care).

West Warwick
120
73.5%
-12%
3.18
-13%
-21%
3
27
5.4
6
98
-
52
Westview Holdco Llc
$11.6M
$5.8M
49.7%
415067

Places of interest near West View Nursing & Rehabilitation Center

Address 5.6 miles from city center

Calculate Travel Distance to West View Nursing & Rehabilitation Center

Add your location

Address

Staffing Data (Q2 2025)

This data corresponds to Q2 2025 and is based on CMS Payroll-Based Journal.

Total staff 288
Employees 142
Contractors 146
Staff to resident ratio 2.72:1
55% better than Rhode Island average

Rhode Island average ratio: 1.76:1

Avg staff/day 69
Average shift 7.8 hours
0% compared with Rhode Island average

Rhode Island average: 7.6 hours

Total staff hours (quarter) 48,890
Nursing staff breakdown
Registered Nurse

Manages medical care and health needs.

Total count 35
Average shift length Info Average shift length. Calculated as total hours divided by days worked and average staff per day. 8.5 hours

This role is partially covered by contractors.

Licensed Practical Nurse

Assists with medical care and medications.

Total count 28
Average shift length Info Average shift length. Calculated as total hours divided by days worked and average staff per day. 8.8 hours

This role is partially covered by contractors.

Certified Nursing Assistant

Helps with daily care and mobility.

Total count 151
Average shift length Info Average shift length. Calculated as total hours divided by days worked and average staff per day. 7.8 hours

This role is partially covered by contractors.

Contractor staffing

Total hours from contractors

14.4%

7,040 contractor hours this quarter

Certified Nursing Assistant: 102 Licensed Practical Nurse: 19 Registered Nurse: 15 Occupational Therapy Assistant: 4 Other Physician: 3 Feeding Assistant: 2 Medical Director: 1
Staff by category
Certified Nursing Assistant4910215119,86491100%7.8
Registered Nurse20153510,01991100%8.5
Qualified Activities Professional220224,90491100%6.9
Licensed Practical Nurse919283,13391100%8.8
Medication Aide/Technician6061,7928593%8.5
Physical Therapy Assistant3031,1587886%6.4
Other Dietary Services Staff5051,1428998%6.9
Therapeutic Recreation Specialist6061,0887481%7
Clinical Nurse Specialist4048826673%7.7
Dental Services Staff4048138796%7.5
Respiratory Therapy Technician4047996976%7.5
Dietitian1015546470%8.6
Qualified Social Worker2025436066%7.7
Administrator2025046571%7.6
Respiratory Therapist1013555459%6.6
Occupational Therapy Aide1013124347%7.3
Other Physician0333121314%8
Feeding Assistant0223122730%8
Nurse Practitioner2022262730%8.4
Medical Director0111041314%8
Occupational Therapy Assistant044692831%2.1
Mental Health Service Worker101811%7.8
151 Certified Nursing Assistant
% of Days 100%
35 Registered Nurse
% of Days 100%
22 Qualified Activities Professional
% of Days 100%
28 Licensed Practical Nurse
% of Days 100%
6 Medication Aide/Technician
% of Days 93%
3 Physical Therapy Assistant
% of Days 86%
5 Other Dietary Services Staff
% of Days 98%
6 Therapeutic Recreation Specialist
% of Days 81%
4 Clinical Nurse Specialist
% of Days 73%
4 Dental Services Staff
% of Days 96%
4 Respiratory Therapy Technician
% of Days 76%
1 Dietitian
% of Days 70%
2 Qualified Social Worker
% of Days 66%
2 Administrator
% of Days 71%
1 Respiratory Therapist
% of Days 59%
1 Occupational Therapy Aide
% of Days 47%
3 Other Physician
% of Days 14%
2 Feeding Assistant
% of Days 30%
2 Nurse Practitioner
% of Days 30%
1 Medical Director
% of Days 14%
4 Occupational Therapy Assistant
% of Days 31%
1 Mental Health Service Worker
% of Days 1%

Facility Characteristics

Source: CMS Long-Term Care Facility Characteristics (Data as of Jan 2026)

Total census
106 residents
Residents by payment source
Medicare
43 residents (40.6%)
Medicaid
51 residents (48.1%)
Private pay or other
12 residents (11.3%)
Programs & Services
Residents' Group

Residents meet regularly to discuss policies, care quality, and activities

Nurse Aide Training

State-approved Nurse Aide Training and Competency Evaluation Program on-site

Active Resident Council

Organized group of residents that meets regularly to discuss facility policies, quality of life, and activities.

Quality of care over time

These measures show how residents usually do over time at this home, based on health outcomes and preventive care.

High-risk clinical events score Info A composite score based on pressure ulcers, falls with injury, weight loss, walking ability decline, and activities of daily living decline. 15.1
47% worse than Rhode Island average

Rhode Island average: 10.3

Functional decline score Info A composite score based on activities of daily living decline, walking ability decline, and incontinence. 30.4
50% worse than Rhode Island average

Rhode Island average: 20.2

Long-stay resident measures
Below average Rhode Island avg: 3.2 Info CMS star rating based on long-stay quality measure performance. 5 stars = significantly above average, 1 star = significantly below average.
Need for Help with Daily Activities Increased Info Percent of long-stay residents whose need for help with daily activities has increased 29.8%
53% worse than Rhode Island average

Rhode Island average: 19.5%

Walking Ability Worsened Info Percent of long-stay residents whose ability to move independently worsened 28.5%
57% worse than Rhode Island average

Rhode Island average: 18.2%

Low Risk Residents with Bowel/Bladder Incontinence Info Percent of low risk long-stay residents who lose control of their bowels or bladder 32.8%
44% worse than Rhode Island average

Rhode Island average: 22.9%

Falls with Major Injury Info Percent of long-stay residents experiencing one or more falls with major injury 3.3%
11% better than Rhode Island average

Rhode Island average: 3.7%

High Risk Residents with Pressure Ulcers Info Percent of long-stay high risk residents with pressure ulcers 7.5%
58% worse than Rhode Island average

Rhode Island average: 4.7%

Urinary Tract Infection Info Percent of long-stay residents with a urinary tract infection 0.3%
87% better than Rhode Island average

Rhode Island average: 2.3%

Lost Too Much Weight Info Percent of long-stay residents who lose too much weight 6.4%
19% worse than Rhode Island average

Rhode Island average: 5.4%

Depressive Symptoms Info Percent of long-stay residents who have depressive symptoms 12.5%
7% better than Rhode Island average

Rhode Island average: 13.5%

Antipsychotic Use Info Percent of long-stay residents who received an antipsychotic medication 15.0%
30% better than Rhode Island average

Rhode Island average: 21.5%

Pneumococcal Vaccine Info Percent of long-stay residents assessed and appropriately given the pneumococcal vaccine 97.3%
5% better than Rhode Island average

Rhode Island average: 93.1%

Influenza Vaccine Info Percent of long-stay residents assessed and appropriately given the seasonal influenza vaccine 98.9%
In line with Rhode Island average

Rhode Island average: 95.3%

Hospitalizations per 1,000 days Info Number of hospitalizations per 1,000 long-stay resident days. 1.83
25% worse than Rhode Island average

Rhode Island average: 1.46

ED visits per 1,000 days Info Number of outpatient emergency department visits per 1,000 long-stay resident days. 2.48
44% worse than Rhode Island average

Rhode Island average: 1.72

Short-stay resident measures
Significantly below average Rhode Island avg: 2.3 Info CMS star rating based on short-stay quality measure performance. 5 stars = much above average, 1 star = much below average.
Pneumococcal Vaccine Info Percent of short-stay residents assessed and appropriately given the pneumococcal vaccine 98.5%
29% better than Rhode Island average

Rhode Island average: 76.2%

Antipsychotic medication increase Info Percent of short-stay residents who newly received an antipsychotic medication 0.8%
63% better than Rhode Island average

Rhode Island average: 2.0%

Influenza Vaccine Info Percent of short-stay residents assessed and appropriately given the seasonal influenza vaccine 85.4%
9% better than Rhode Island average

Rhode Island average: 78.2%

Re-hospitalized after SNF stay Info Percentage of short-stay residents who were re-hospitalized after their nursing home admission. 30.3%
21% worse than Rhode Island average

Rhode Island average: 25.1%

Emergency department visits Info Percentage of short-stay residents who had an outpatient emergency department visit. 22.9%
45% worse than Rhode Island average

Rhode Island average: 15.8%

Falls with major injury Info Percentage of SNF residents who experience falls with major injury during their stay. 0.0%
100% better than Rhode Island average

Rhode Island average: 0.8%

Ability to care for self at discharge Info Percentage of residents at or above expected ability to care for themselves at discharge. 55.1%
In line with Rhode Island average

Rhode Island average: 53.7%

Successful return to home or community Info Rate of successful return to home or community from a skilled nursing facility. 41.3%
18% worse than Rhode Island average

Rhode Island average: 50.6%

Penalties and fines

Federal penalties imposed by CMS for regulatory violations, including civil money penalties (fines) and denials of payment for new Medicare/Medicaid admissions.

Source: CMS Penalties Database (Data as of Jan 2026)

Total fines amount $76K
19% lower than Rhode Island average

Rhode Island average: $94K

Number of fines 3
6% more fines than Rhode Island average

Rhode Island average: 2.8

Payment Denials Info Serious action where Medicare and/or Medicaid temporarily stops payments for new residents until issues are fixed. 0
100% fewer payment denials than Rhode Island average

Rhode Island average: 0.4

Fines amount comparison
This facility $76K
Rhode Island average $94K
Penalty History

Penalties are imposed by CMS for violations of federal nursing home regulations.

Civil Money Penalty Info Fines imposed for noncompliance, which can be assessed per day or per instance of violation. Mar 3, 2025
$15K
Civil Money Penalty Info Fines imposed for noncompliance, which can be assessed per day or per instance of violation. Nov 21, 2024
$25K
Civil Money Penalty Info Fines imposed for noncompliance, which can be assessed per day or per instance of violation. Jan 5, 2024
$36K

Last updated: Jan 2026

Guides for Better Senior Living

Care Cost Calculator: See Prices in Your Area

Nursing Home Data Explorer

Don’t Wait Too Long: 7 Red Flag Signs Your Parent Needs Assisted Living Now

The True Cost of Assisted Living in 2025 – And How Families Are Paying For It

Understanding Senior Living Costs: Pricing Models, Discounts & Financial Assistance

Financial Aid for Rhode Island Seniors

Get financial aid guidance

Rhode Island Home and Community Care Services

RI Medicaid HCCS

Age 65+ or disabled, Rhode Island resident, Medicaid-eligible, nursing home-level care need.

~$2,829/month (300% FBR, individual).

$4,000 (individual, higher than most states).

Higher asset limit; small state aids quicker processing.

Rhode Island Caregiver Support Program

RI NFCSP Respite

Caregiver of someone 60+ (or with dementia), Rhode Island resident.

No strict limit; prioritizes low-income.

Not applicable.

Limited slots; urban focus due to small size.

Program of All-Inclusive Care for the Elderly (PACE)

Rhode Island PACE

Age 55+, RI resident (specific counties), NFLOC, safe with PACE support.

~$2,829/month (Medicaid-eligible); private pay option available.

$4,000 (individual), $6,000 (couple) for Medicaid enrollees.

Operated by PACE Organization of Rhode Island; covers 4 counties (Providence, Kent, Washington, Newport).

@Home Cost Share Program

Rhode Island @Home Cost Share

Age 65+, RI resident, need help with 1+ ADL/IADL, not Medicaid-eligible.

~$1,255-$2,829/month (100%-300% FPL); sliding scale fees.

Not strictly assessed; focus on income/need.

Administered by Division of Elderly Affairs (DEA); complements Medicaid.

SSI Enhanced Assisted Living Program

Rhode Island SSI Enhanced AL

Age 65+ (or disabled), RI resident, SSI-eligible, living in approved AL facility.

$943/month (SSI federal rate) + state supplement ($332/month).

$2,000 (individual), $3,000 (couple).

Supplement increases to ~$1,275/month total for AL residents; ~50 facilities participate.

Medicare Savings Program (MSP)

Rhode Island Medicare Savings Program

Age 65+ or disabled, RI resident, Medicare Part A/B.

~$2,510/month (QMB), ~$3,380/month (SLMB), ~$3,598/month (QI)—individual.

$9,430 (individual), $14,130 (couple).

Three tiers; includes Extra Help for Part D; no waitlist.

Low-Income Home Energy Assistance Program (LIHEAP)

Rhode Island LIHEAP

Age 60+ prioritized, RI resident, low-income household.

~$3,970/month (individual, 185% FPL).

Not assessed; income-focused.

Covers gas, electric, oil; emergency aid available.

VA Aid and Attendance (A&A) and Housebound Benefits

Rhode Island VA Aid and Attendance/Housebound

Age 65+ or disabled veteran/spouse, RI resident, wartime service, need for ADL help (A&A) or homebound.

Net income < ~$1,984/month (veteran with dependent, A&A); pension offsets income.

~$155,356 (net worth limit).

High veteran demand; supports rural/urban care needs.

Senior Farmers’ Market Nutrition Program (SFMNP)

Rhode Island SFMNP

Age 60+, RI resident, low-income.

~$2,322/month (individual, 185% FPL).

Not assessed.

Vouchers (~$50/season); serves ~10,000 annually.

Property Tax Relief for Seniors

Rhode Island Property Tax Relief Credit

Age 65+ (or disabled), RI resident, homeowner/renter, low-income.

~$35,000/year (household).

Not assessed; income-focused.

Credit up to $400; local exemptions vary by municipality.