Total health inspections
5
Florida average 4.3
Last Health inspection on Apr 2025

We arrange tours, appointments, and even moving support so you don’t have to
Thank you for your interest!
Our team will be in touch shortly to help with next steps.

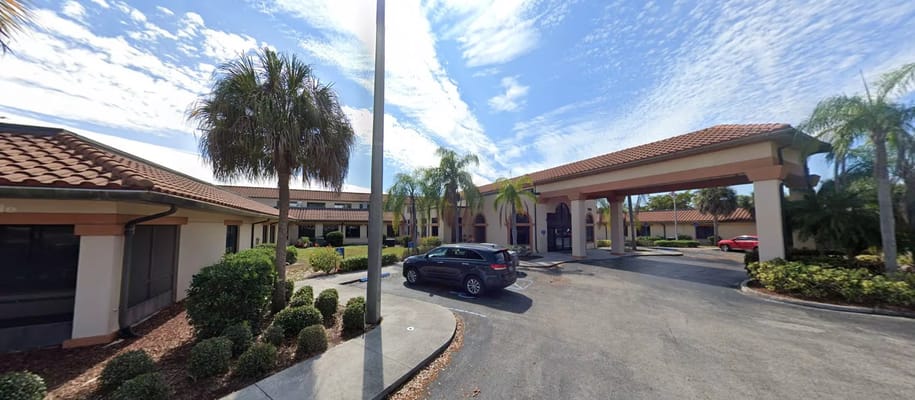
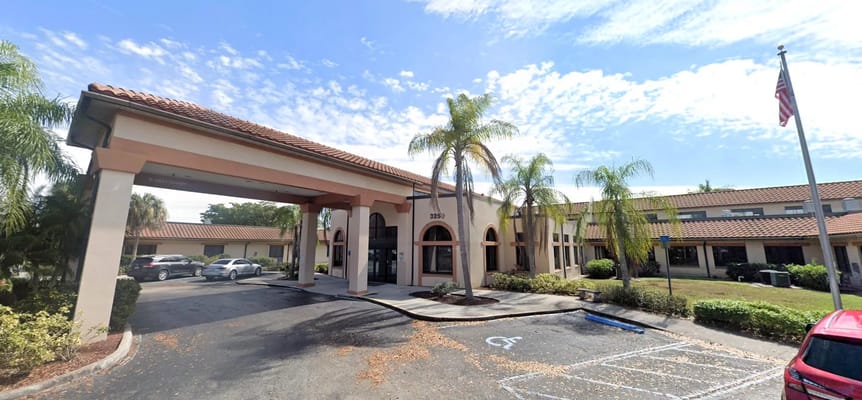


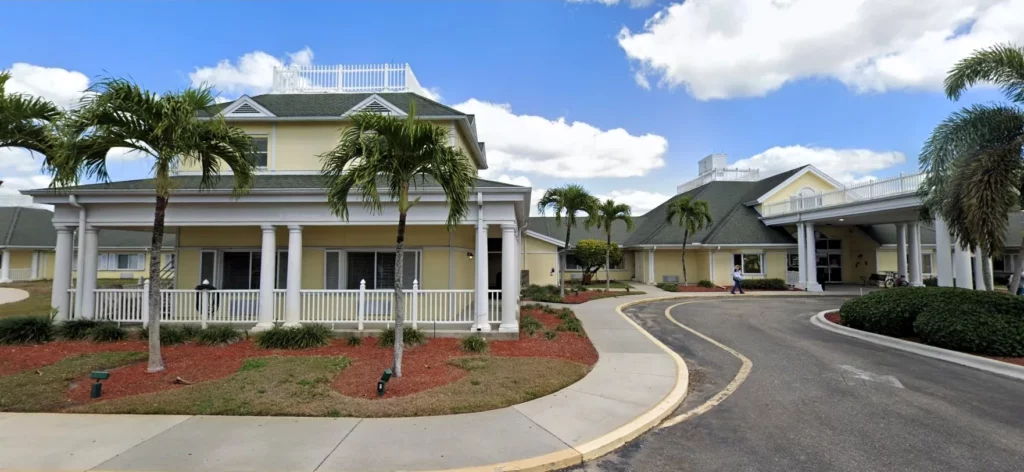
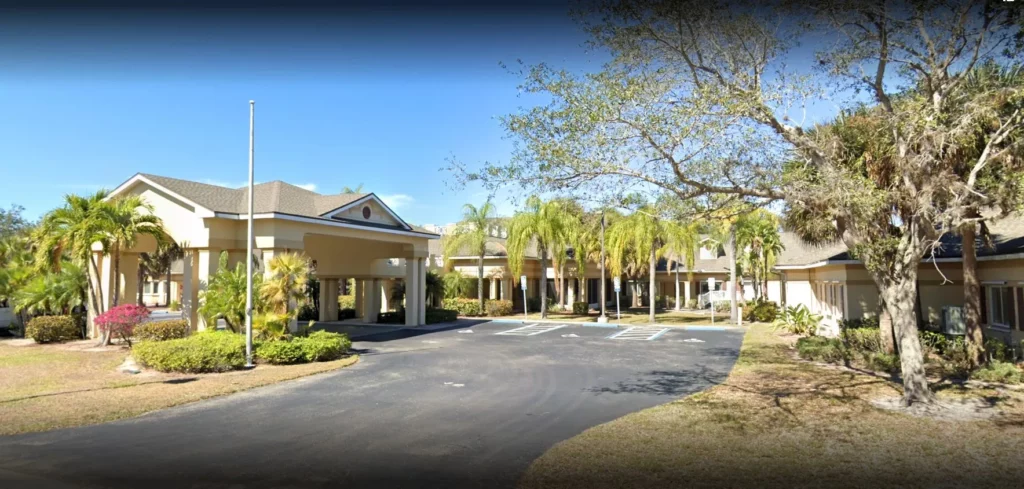
Winkler Court, situated in Fort Myers, Florida, exists as a not-for-profit care center dedicated to providing exceptional post-acute care, rehabilitation programs, and skilled nursing services. What sets them apart is their authentic and compassionate approach to caregiving. With a team of friendly and caring staff, they have perfected the art of efficient, genuine, and heartfelt service.
Winkler Court’s commitment to excellence is evident in their provision of respite care, restorative care, and palliative care, making it a dependable choice for families seeking a clean, attentive, and supportive environment for their loved ones. In the heart of Fort Myers, Winkler Court thrives as a haven where genuine care meets expertise. Families entrust their loved ones to this facility, appreciating not just the professional services but also the warmth and sincerity that define the Winkler Court experience.
Offers a balance of services and community atmosphere.
Occupancy is moderate, suggesting balanced demand.
Most residents typically stay for a few weeks or months before returning home or moving on.
56% of new residents, usually for short-term rehab.
38% of new residents, often for short stays.
6% of new residents, often for long-term daily care.
In Florida, the Agency for Health Care Administration (AHCA) is the primary authority that conducts unannounced inspections and completes official health quality reports for all healthcare facilities.
2 visits/inspections triggered by complaints
3 routine inspections
6 with issues
1 without issues
Deficiencies indicate regulatory issues. A higher number implies the facility had several areas requiring improvement.
Florida average: 19 deficiencies
Florida average: 5 fines
Florida average: $11,623.53
Florida average: 3 legal actions
Florida average 4.3
Last Health inspection on Apr 2025
Florida average 19.7
Florida average 4.48
Health citations are formal notices following inspections when they fail to comply with safety and care standards.
32 of 40 citations resulted from standard inspections; 7 of 40 resulted from complaint investigations; and 1 of 40 came from combined inspections (standard and complaint).
Florida average: 0.8
Florida average: 0.4
Data sourced from CMS Health Deficiencies reports. Citation severity codes range from A (least serious) to L (most serious). Immediate Jeopardy (J-L) citations indicate situations where the facility's noncompliance has placed residents at risk of death or serious harm.
Nursing Home Licensed facility providing 24/7 skilled nursing care for residents with complex, ongoing medical needs. Staffed by RNs, LPNs, and CNAs. Inspected and star-rated annually by CMS. Accepts Medicare (short-term rehab) and Medicaid (long-term care).
Assisted Living A licensed, long-term care setting for seniors or individuals with disabilities who need help with daily activities — like bathing, dressing, and medication management — but not 24-hour skilled nursing. Offers housing, meals, and around-the-clock support while aiming to maximize resident independence.
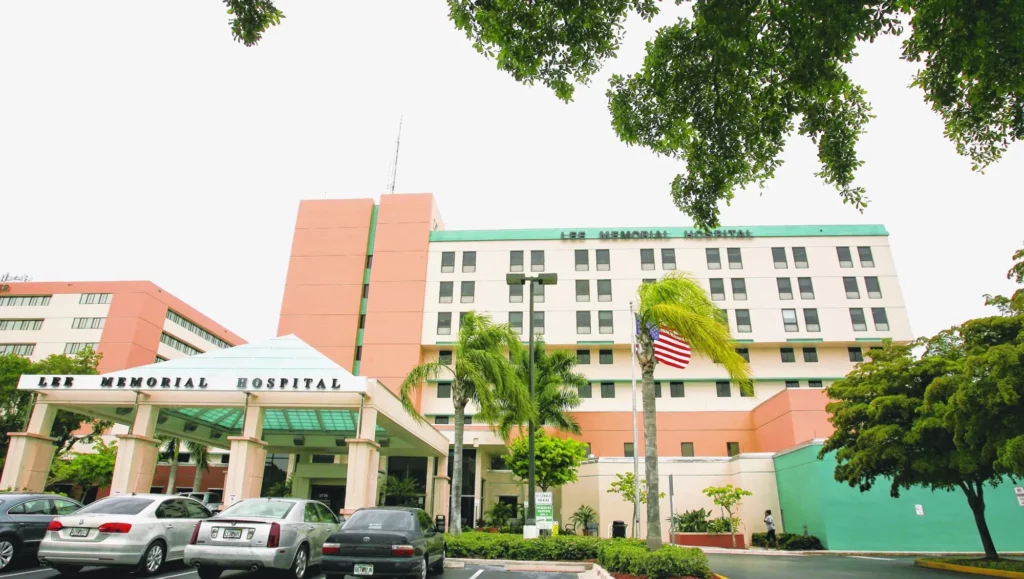
![]() 2.7 miles from city center — 2.41 miles to nearest hospital (GenesisCare)
2.7 miles from city center — 2.41 miles to nearest hospital (GenesisCare)
Add your location
This data corresponds to Q2 2025 and is based on CMS Payroll-Based Journal.
Florida average ratio: 1.52:1
Florida average: 7.9 hours
Manages medical care and health needs.
This role is partially covered by contractors.
Assists with medical care and medications.
No contractors work on this role.
Helps with daily care and mobility.
No contractors work on this role.
Total hours from contractors
7,964 contractor hours this quarter
| Certified Nursing Assistant | 56 | 0 | 56 | 21,553 | 91 | 100% | 8.6 |
| Licensed Practical Nurse | 24 | 0 | 24 | 7,217 | 91 | 100% | 9.1 |
| Registered Nurse | 19 | 1 | 20 | 2,964 | 91 | 100% | 7.6 |
| Clinical Nurse Specialist | 6 | 0 | 6 | 2,691 | 90 | 99% | 8.4 |
| Speech Language Pathologist | 0 | 7 | 7 | 2,644 | 90 | 99% | 6.4 |
| Physical Therapy Aide | 0 | 7 | 7 | 2,302 | 89 | 98% | 7.9 |
| Respiratory Therapy Technician | 0 | 4 | 4 | 1,084 | 75 | 82% | 7.4 |
| Nurse Practitioner | 2 | 0 | 2 | 944 | 65 | 71% | 8 |
| Qualified Social Worker | 0 | 2 | 2 | 909 | 64 | 70% | 7.3 |
| Physical Therapy Assistant | 0 | 5 | 5 | 675 | 77 | 85% | 5.8 |
| Dietitian | 1 | 0 | 1 | 520 | 67 | 74% | 7.8 |
| Administrator | 1 | 0 | 1 | 512 | 64 | 70% | 8 |
| Mental Health Service Worker | 1 | 0 | 1 | 496 | 62 | 68% | 8 |
| Other Dietary Services Staff | 2 | 0 | 2 | 459 | 60 | 66% | 7.6 |
| Occupational Therapy Aide | 1 | 0 | 1 | 414 | 53 | 58% | 7.8 |
| RN Director of Nursing | 1 | 0 | 1 | 371 | 38 | 42% | 9.8 |
| Therapeutic Recreation Specialist | 0 | 1 | 1 | 284 | 53 | 58% | 5.4 |
| Occupational Therapy Assistant | 0 | 2 | 2 | 50 | 8 | 9% | 6.2 |
| Medical Director | 0 | 1 | 1 | 3 | 3 | 3% | 1 |
Source: CMS Long-Term Care Facility Characteristics (Data as of Jan 2026)
Residents meet regularly to discuss policies, care quality, and activities
Organized group of residents that meets regularly to discuss facility policies, quality of life, and activities.
Data sourced from CMS Long-Term Care Facility Characteristics quarterly report. Payer mix reflects the current resident census by primary payment source.
These measures show how residents usually do over time at this home, based on health outcomes and preventive care.
Florida average: 7.4
Florida average: 12.4
Florida average: 10.5%
Florida average: 12.9%
Florida average: 13.5%
Florida average: 2.6%
Florida average: 5.4%
Florida average: 0.9%
Florida average: 6.0%
Florida average: 3.3%
Florida average: 8.0%
Florida average: 97.7%
Florida average: 99.2%
Florida average: 2.10
Florida average: 1.18
Florida average: 94.0%
Florida average: 1.5%
Florida average: 94.7%
Florida average: 26.2%
Florida average: 9.3%
Florida average: 0.8%
Florida average: 53.7%
Florida average: 50.6%
Quality measures are calculated from Minimum Data Set (MDS) assessments. For most measures, lower percentages indicate better care quality.
Federal penalties imposed by CMS for regulatory violations, including civil money penalties (fines) and denials of payment for new Medicare/Medicaid admissions.
Source: CMS Penalties Database (Data as of Jan 2026)
Florida average: $72K
Florida average: 2.6
Florida average: 0.1
Penalties are imposed by CMS for violations of federal nursing home regulations.
Last updated: Jan 2026
Historical financial and operational data for Winkler Court based on CMS SNF Cost Reports.
Loading trend charts...
Care Cost Calculator: See Prices in Your Area
Nursing Home Data Explorer
Don’t Wait Too Long: 7 Red Flag Signs Your Parent Needs Assisted Living Now
The True Cost of Assisted Living in 2025 – And How Families Are Paying For It
Understanding Senior Living Costs: Pricing Models, Discounts & Financial Assistance

Touring a community? Use this expert-backed checklist to stay organized, ask the right questions, and find the perfect fit.
We'll send you a PDF version of the touring checklist.