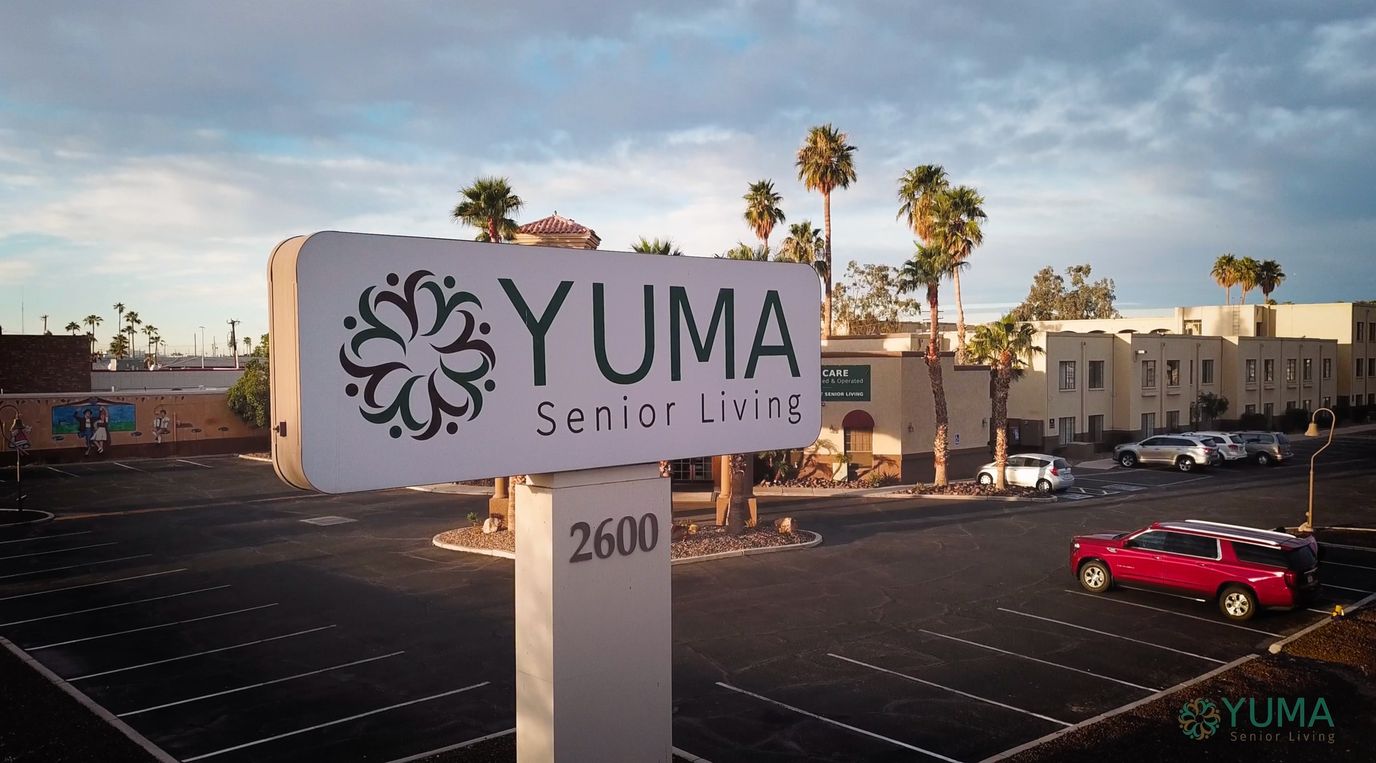
Yuma Senior Living
Nursing Home, Assisted Living, Independent Living, Memory Care & Respite Care · Yuma, AZ
CMS overall rating Info CMS (the Centers for Medicare & Medicaid Services) is the federal agency that rates nursing home quality. Its Overall Rating runs from 1 to 5 stars, combining health inspections, staffing, and quality measures, with inspections weighted most heavily.

Yuma Senior Living

Nursing Home, Assisted Living, Independent Living, Memory Care & Respite Care · Yuma, AZ
CMS overall rating Info CMS (the Centers for Medicare & Medicaid Services) is the federal agency that rates nursing home quality. Its Overall Rating runs from 1 to 5 stars, combining health inspections, staffing, and quality measures, with inspections weighted most heavily.
Calculator: See prices in your area
Yuma Senior Living accepts Medicare, Medicaid, and private pay.

Overview of Yuma Senior Living

Conveniently located near Onvida Health Yuma Medical Center in Yuma, AZ, Yuma Senior Living is an exceptional community that offers independent living, assisted living, memory care, and respite care. Residents experience hassle-free living with a kind and highly trained team attending to their needs 24/7. An emergency call system and an on-site security system are also available to ensure residents’ comfort and safety.

Fun recreational activities and engaging programs are also conducted, promoting an active and vibrant lifestyle. Mealtimes promote social interactions and satisfy dietary needs with delightful and healthy dining options. The community also provides scheduled transportation and on-site physical therapy for residents’ convenience. Residents make the most of their golden years with the community’s dedicated services and state-of-the-art amenities.

Quality ratings

Measured by Centers for Medicare & Medicaid Services (CMS)

Overall rating Info The Overall CMS Rating combines results from health inspections, staffing levels and quality measures. Health inspections carry the most weight. Staffing and quality scores can increase or decrease the final rating based on performance compared to state and national standards.
Health Inspection Info Based on the results of the facility's three most recent standard inspections and any complaint investigations. CMS reviews the number, scope, and severity of deficiencies, with more recent findings weighted more heavily.
Staffing Info Measures average nursing staff hours per resident per day, including Registered Nurses (RNs) and total nursing staff. Ratings are adjusted based on the level of care residents require and are compared to state and national benchmarks.
Quality Measures Info Based on clinical and physical health indicators reported to CMS, such as hospital readmissions, falls, pressure ulcers, and improvements in mobility. These measures reflect how well residents' health needs are being managed.

Staffing hours breakdown

Info Daily nursing hours per resident by staff type, reported to CMS. Higher is generally better — compare this facility to state and national averages to see where staffing stands.

Hours per resident per day — compared to state averages

Total nursing care / resident Info Total adjusted nursing hours per resident per day, combining RN, LPN, and aide time. CMS adjusts this for case-mix so facilities can be fairly compared.
3h 42m per day
Rank #43 / 71Nurse hours — State benchmarkedThis home is ranked 43rd out of 71 homes in Arizona. Shows adjusted nurse hours per resident per day benchmarked to the Arizona average, with a ranking across 71 Arizona facilities. More hours mean more direct care. The national average is about 3.5 hrs; below 3.0 is a red flag.Rankings are based only on facilities in Arizona that report data for that category. Facilities without available data are excluded from the ranking.Click the rank badge to see the full State ranking.Click here to see the full State ranking.
vs avg
Staff typeHours / Day / Residentvs state avg
Registered Nurse (RN) Info RNs hold the highest nursing license and can assess residents, interpret test results, and direct care plans. More RN hours per day often signals stronger clinical oversight and faster response to health changes. 30m per day
LPN / LVN Info Licensed Practical Nurses (LPNs) or Licensed Vocational Nurses (LVNs) deliver routine hands-on care — medication administration, wound dressing, and monitoring vital signs. They work under RN supervision and make up a large share of daily bedside care. 52m per day
Nurse Aide Info Certified Nurse Aides (CNAs) provide the most direct day-to-day assistance: bathing, dressing, feeding, and mobility. Nurse aide hours are typically the largest staffing category and directly affect residents' quality of life. 2h 21m per day
Weekend Total Nursing Info Combined nursing hours (RN + LPN + Nurse Aide) per resident per day on weekends. Staffing often drops on weekends — this figure reveals whether the facility maintains adequate coverage outside of weekday hours. 3h 23m per day
Physical Therapist Info Hours per resident per day provided by licensed Physical Therapists (PTs) or PT Assistants. PT services help residents recover mobility after injury or illness and are especially important for post-acute (short-stay) rehabilitation. 2m per day
Weekend RN Info Registered nurse hours specifically on weekends. Facilities sometimes reduce RN presence on Saturdays and Sundays — a low weekend RN figure compared to weekday hours can indicate reduced clinical oversight when most administrative staff are absent. 17m per day

Capacity and availability

Avg. Length of Stay
33 days
Bed community size
202-bed community
A large-scale community that may provide a wide range of amenities, services, and structured programs.
Years in operation
8 years in operation
An established community with some operational experience and growing routines.
Walk Score
Walk Score: 81 / 100
Very walkable. Most errands can be accomplished on foot, and many essentials are within a short walk.
BBB Rating
BBB Rating: A+ (Not Accredited)
An independent rating from the Better Business Bureau based on factors such as complaint history, transparency, and business practices.
How BBB ratings work

About this community

Occupancy

Occupancy rate
65%
Rank #47 / 76Occupancy rate — State benchmarkedThis home is ranked 47th out of 76 homes in Arizona. Shows this facility's occupancy rate versus the Arizona average, with its Statewide rank out of 76. Higher occupancy signals strong local demand and financial stability.Rankings are based only on facilities in Arizona that report data for that category. Facilities without available data are excluded from the ranking.Click the rank badge to see the full State ranking.Click here to see the full State ranking.
Lower than the Arizona average: 72.7%
Occupied beds
131 / 202
Average occupied beds in Arizona homes 84 beds

License Details

Facility TypeAssisted Living Center
StatusActive
IssuanceNovember 28, 2017
ExpirationOctober 31, 2026
License NumberAL10505C
QualificationHealth Care

Ownership & Operating Entity

Yuma Senior Living is administered by Deborah N Hall.

OwnerYUMA SENIOR LIVING LLC

Staffing

Key information about the people who lead and staff this community.

Leadership

ContactMr. Owner/Manager, Associate

Therapy & Rehabilitation

1 service
Respite Care

Additional Policies & Features

Pets Allowed

Contact Yuma Senior Living

Inspection History

In Arizona, the Department of Health Services, Bureau of Long Term Care Licensing performs regular onsite inspections and investigates complaints for all licensed residential and nursing facilities.

Inspection Scorecard Info This scorecard compares key inspection, deficiency, and complaint metrics at this facility against the Arizona state average. Metrics rated ≥15% worse than average are highlighted in red; those ≥15% better are highlighted in green.

Overall vs. AZ average 2 Worse Metrics worse than Arizona average:
• Enforcement actions (122% above)
• Total inspections (40% above)
1 Better Metrics better than Arizona average:
• Total complaints (33% below)
Latest Inspection August 26, 2025 Complaint;Compliance (Annual) 1 deficiencies

Deficiencies Info Deficiencies are formal regulatory issues recorded during state inspections.

This FacilityAZ Averagevs. AZ Avg
Enforcement actions Info Formal penalties or interventions imposed by Arizona regulators — directed plans of correction, civil monetary penalties, denial of payment, or appointment of temporary management. 20.9 This facility has 122% more enforcement actions than a typical Arizona assisted living residence (2 vs. AZ avg 0.9).↑ 122% worse

Inspections Info State inspections evaluate whether the facility meets health and safety standards.

This FacilityAZ Averagevs. AZ Avg
Total inspections Info Combined count of all routine and focused inspections. Excludes complaint investigations. 75 This facility has 40% more total inspections than a typical Arizona assisted living residence (7 vs. AZ avg 5).↑ 40% worse

Complaints & Investigations Info Complaints are formal concerns filed by residents, families, or staff. Investigations are on-site follow-ups.

This FacilityAZ Averagevs. AZ Avg
Total complaints Info Formal expressions of concern made by residents, families, or staff. 46 This facility has 33% fewer total complaints than a typical Arizona assisted living residence (4 vs. AZ avg 6).↓ 33% better Rank #350 / 500 Total complaints — State benchmarked This home is ranked 350th out of 500 homes in Arizona. Shows this facility's complaint-related visits compared to the Arizona average among 500 comparable communities in the ranking pool. Rankings are based only on facilities in Arizona that report data for that category. Facilities without available data are excluded from the ranking.

Inspection Reports Summary Info An editor-reviewed summary of the themes and findings across this facility's recent inspection reports.

  • The August 26, 2025 complaint investigation found one medication administration deficiency with no other issues.
  • April 18, 2024 enforcement cited a repeat cleanliness deficiency and imposed a $250 fine, paid in full.
  • March 24, 2023 annual inspection found three deficiencies in fall prevention training, premises cleanliness, and bathroom ventilation.

Health Inspection History

Inspections since 2021
Total health inspections 6

State average N/A


Last Health inspection on Oct 2025

Total health citations
28 Rank #48 / 75Health citations — State benchmarkedThis home is ranked 48th out of 75 homes in Arizona. Shows this facility's total health deficiency citations benchmarked to the Arizona State average, with a ranking across all 75 AZ facilities. Lower citation counts earn a better rank.Rankings are based only on facilities in Arizona that report data for that category. Facilities without available data are excluded from the ranking.Click the rank badge to see the full State ranking.Click here to see the full State ranking.

State average N/A

Citations per inspection
4.67 Rank #51 / 75Citations per inspection — State benchmarkedThis home is ranked 51st out of 75 homes in Arizona. Shows average deficiency citations per CMS inspection for this facility versus the Arizona mean across 75 facilities with citation data. Lower is better.Rankings are based only on facilities in Arizona that report data for that category. Facilities without available data are excluded from the ranking.Click the rank badge to see the full State ranking.Click here to see the full State ranking.

State average N/A


Health citations are formal notices following inspections when they fail to comply with safety and care standards.

21 of 28 citations resulted from standard inspections; and 7 of 28 resulted from complaint investigations.

Breakdown of citation severity (last 5 years)
Critical health citations
0
In line with State average

State average: N/A


Serious health citations
0
In line with State average

State average: N/A

0 critical citations State average: N/A

0 serious citations State average: N/A

28 moderate citations State average: N/A

0 minor citations State average: N/A
Citations history (last 5 years)
Abuse/Neglect moderate citation Oct 07, 2025
Corrected

Abuse/Neglect moderate citation Oct 07, 2025
Corrected

Abuse/Neglect moderate citation Mar 14, 2025
Corrected

Abuse/Neglect moderate citation Mar 14, 2025
Corrected

Staffing Data

Reporting period: October 1 – December 31, 2025 (Q4 2025). Source: CMS Payroll-Based Journal report.

Total staff 150
Employees 146
Contractors 4
Staff to resident ratio 1.85 : 1
0% compared with State average

State average ratio: 0 : 0

Avg staff/day 53
Average shift 8.4 hours
0% compared with State average

State average: 0 hours

Total staff hours (quarter) 40,920

Nursing staff breakdown

Q4 2025 · Oct 1 – Dec 31 More info This data comes from the CMS Payroll-Based Journal report covering October 1 – December 31, 2025.
Registered Nurse

Manages medical care and health needs.

RN Staff Info All 12 RN Staff are full-time employees. No contractors work on this role. 12
Average shift length Info Average shift length. Calculated as total hours divided by days worked and average staff per day. 10.3 hours
Licensed Practical Nurse

Assists with medical care and medications.

LPN Staff Info All 20 LPN Staff are full-time employees. No contractors work on this role. 20
Average shift length Info Average shift length. Calculated as total hours divided by days worked and average staff per day. 9.6 hours
Certified Nursing Assistant

Helps with daily care and mobility.

CNA Staff Info All 74 CNA Staff are full-time employees. No contractors work on this role. 74
Average shift length Info Average shift length. Calculated as total hours divided by days worked and average staff per day. 8.2 hours

Contractor staffing

Q4 2025 · Oct 1 – Dec 31 More info This data comes from the CMS Payroll-Based Journal report covering October 1 – December 31, 2025.

Total hours from contractors

0.4%

156 contractor hours this quarter

Occupational Therapy Assistant: 2 Occupational Therapy Aide: 1 Medical Director: 1

Staff by category

Q4 2025 · Oct 1 – Dec 31 More info This data comes from the CMS Payroll-Based Journal report covering October 1 – December 31, 2025.
Certified Nursing Assistant7407420,94592100%8.2
Licensed Practical Nurse200207,42192100%9.6
Registered Nurse120123,23792100%10.3
Medication Aide/Technician8081,8278997%10.1
Clinical Nurse Specialist4041,1378693%8
Physical Therapy Aide3031,0546773%7
RN Director of Nursing3039696773%7.9
Administrator2026166672%8
Physical Therapy Assistant3034976571%6.9
Other Dietary Services Staff6064906065%7.1
Nurse Practitioner1014796065%8
Dietitian1014516065%7.5
Mental Health Service Worker1014405560%8
Speech Language Pathologist3033906267%5.5
Respiratory Therapy Technician2023436470%5.2
Qualified Social Worker1013134953%6.4
Dental Services Staff2021573033%4.6
Occupational Therapy Assistant0226967%9.8
Occupational Therapy Aide011531415%3.8
Medical Director0113533%11.5
74 Certified Nursing Assistant
% of Days 100%
20 Licensed Practical Nurse
% of Days 100%
12 Registered Nurse
% of Days 100%
8 Medication Aide/Technician
% of Days 97%
4 Clinical Nurse Specialist
% of Days 93%
3 Physical Therapy Aide
% of Days 73%
3 RN Director of Nursing
% of Days 73%
2 Administrator
% of Days 72%
3 Physical Therapy Assistant
% of Days 71%
6 Other Dietary Services Staff
% of Days 65%
1 Nurse Practitioner
% of Days 65%
1 Dietitian
% of Days 65%
1 Mental Health Service Worker
% of Days 60%
3 Speech Language Pathologist
% of Days 67%
2 Respiratory Therapy Technician
% of Days 70%
1 Qualified Social Worker
% of Days 53%
2 Dental Services Staff
% of Days 33%
2 Occupational Therapy Assistant
% of Days 7%
1 Occupational Therapy Aide
% of Days 15%
1 Medical Director
% of Days 3%

Penalties and fines

Federal penalties imposed by CMS for regulatory violations, including civil money penalties (fines) and denials of payment for new Medicare/Medicaid admissions.

Source: CMS Penalties Database

No penalties in the past 3 years

No civil money penalties or payment denials were reported in the last 3 years.

Quality of care over time

These measures show how residents usually do over time at this home, based on health outcomes and preventive care.

High-risk clinical events score Info A composite score based on pressure ulcers, falls with injury, weight loss, walking ability decline, and activities of daily living decline. 11.4
50% worse than State average

State average: 7.6

Functional decline score Info A composite score based on activities of daily living decline, walking ability decline, and incontinence. 22.9
42% worse than State average

State average: 16.1

Long-stay resident measures
Need for Help with Daily Activities Increased Info Percent of long-stay residents whose need for help with daily activities has increased 16.9%
51% worse than State average

State average: 11.2%

Walking Ability Worsened Info Percent of long-stay residents whose ability to move independently worsened 28.6%
80% worse than State average

State average: 15.8%

Low Risk Residents with Bowel/Bladder Incontinence Info Percent of low risk long-stay residents who lose control of their bowels or bladder 23.1%
11% worse than State average

State average: 20.8%

Falls with Major Injury Info Percent of long-stay residents experiencing one or more falls with major injury 2.8%
34% worse than State average

State average: 2.1%

High Risk Residents with Pressure Ulcers Info Percent of long-stay high risk residents with pressure ulcers 4.5%
12% better than State average

State average: 5.1%

Urinary Tract Infection Info Percent of long-stay residents with a urinary tract infection 0.4%
69% better than State average

State average: 1.3%

Lost Too Much Weight Info Percent of long-stay residents who lose too much weight 4.2%
24% better than State average

State average: 5.4%

Depressive Symptoms Info Percent of long-stay residents who have depressive symptoms 5.2%
16% worse than State average

State average: 4.5%

Antipsychotic Use Info Percent of long-stay residents who received an antipsychotic medication 12.8%
24% worse than State average

State average: 10.3%

Pneumococcal Vaccine Info Percent of long-stay residents assessed and appropriately given the pneumococcal vaccine 87.9%
10% worse than State average

State average: 97.2%

Influenza Vaccine Info Percent of long-stay residents assessed and appropriately given the seasonal influenza vaccine 85.3%
10% worse than State average

State average: 94.6%

Short-stay resident measures
Pneumococcal Vaccine Info Percent of short-stay residents assessed and appropriately given the pneumococcal vaccine 62.6%
32% worse than State average

State average: 91.5%

Antipsychotic medication increase Info Percent of short-stay residents who newly received an antipsychotic medication 1.0%
In line with State average

State average: 1.0%

Influenza Vaccine Info Percent of short-stay residents assessed and appropriately given the seasonal influenza vaccine 42.6%
51% worse than State average

State average: 87.3%

Breakdown by payment type

Medicare

15% of new residents, usually for short-term rehab.

Typical stay 17 days

Private pay

63% of new residents, often for short stays.

Typical stay 14 days

Medicaid

21% of new residents, often for long-term daily care.

Typical stay 3 - 4 months

Facility Characteristics

Source: CMS Long-Term Care Facility Characteristics (Data as of Jan 2026)

Total residents 81
Medicare
9
11.1% of residents
Medicaid
55
67.9% of residents
Private pay or other
17
21% of residents
Programs & Services
Residents Group

Residents meet regularly to discuss policies, care quality, and activities

Active Resident Council

Organized group of residents that meets regularly to discuss facility policies, quality of life, and activities.

Finances and operations

Based on CMS SNF Cost Report for fiscal year ending in 12/2023.

For-profit
Corporation
Net patient revenue Info Net patient revenue — what the home actually collects for resident care, after contractual allowances, bad debt and discounts are subtracted from its gross charges (CMS cost report, Worksheet G-3). It covers resident care only; money the home earns from other sources is shown separately as "Other income."
$11.1M
Net patient income Info Net patient income: net patient revenue minus the home's total operating expenses. A positive figure means it earns more from resident care than it spends to deliver it; a negative figure means the opposite. It excludes non-operating "other income."
$497.9K
For-profit Corporation
Net patient revenue Info Net patient revenue — what the home actually collects for resident care, after contractual allowances, bad debt and discounts are subtracted from its gross charges (CMS cost report, Worksheet G-3). It covers resident care only; money the home earns from other sources is shown separately as "Other income."
$11.1M Rank #48 / 79Revenue — State benchmarkedThis home is ranked 48th out of 79 homes in Arizona. Shows this facility's annual revenue compared to the Arizona average. Higher revenue generally means more resources for staffing and capital — read alongside Payroll %.Rankings are based only on facilities in Arizona that report data for that category. Facilities without available data are excluded from the ranking.Click the rank badge to see the full State ranking.Click here to see the full State ranking.
Net patient income Info Net patient income: net patient revenue minus the home's total operating expenses. A positive figure means it earns more from resident care than it spends to deliver it; a negative figure means the opposite. It excludes non-operating "other income."
$497.9K
Other income Info Money the home earns outside of resident care — such as investments, grants, rentals and other non-operating sources (CMS cost report, Worksheet G-3). It is tracked separately from net patient revenue: it is not part of that figure, and it is not included in net patient income.
$100.8K
Payroll costs Info Staff salaries plus wage-related costs — benefits such as payroll taxes, health insurance and retirement — from the home's own accounting records (CMS cost report, Worksheet A). Contract or agency labor is counted separately, under other operating costs. Rank #43 / 79Payroll — State benchmarkedThis home is ranked 43rd out of 79 homes in Arizona. Shows total annual staff payroll benchmarked to the Arizona average. Higher payroll investment relative to peers often signals better staffing and less reliance on cheaper contract labor.Rankings are based only on facilities in Arizona that report data for that category. Facilities without available data are excluded from the ranking.Click the rank badge to see the full State ranking.Click here to see the full State ranking.
$6.2M 56.1% of net patient revenue Info Payroll as a share of revenue: staff salaries and wage-related benefits divided by net patient revenue. A higher figure means more of each revenue dollar goes to staff pay. Rank #28 / 79Payroll % — State benchmarkedThis home is ranked 28th out of 79 homes in Arizona. Shows payroll as a percentage of revenue versus the Arizona average. Well-run Arizona facilities typically land around 58–71% — the top third Statewide. Below 25% may signal understaffing or heavy agency use — read with Staffing ratings.Rankings are based only on facilities in Arizona that report data for that category. Facilities without available data are excluded from the ranking.Click the rank badge to see the full State ranking.Click here to see the full State ranking.
Other operating costs Info Everything it costs to run the home apart from payroll — food, utilities, supplies, maintenance, contract labor and administration. Calculated as total operating expense minus payroll (staff salaries and wage-related benefits).
$4.4M
Total costs Info The home's total operating expense for the year — all the costs of running it, salaries included (CMS cost report, Worksheet G-3).
$10.6M

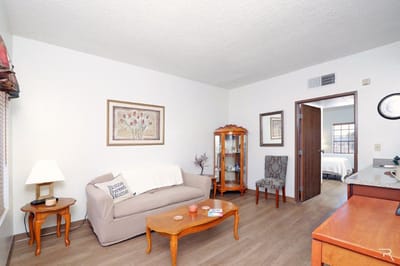
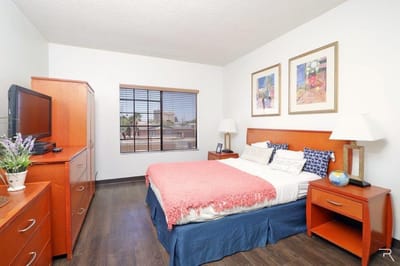
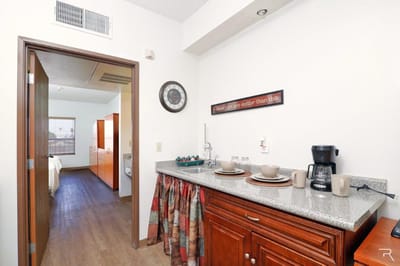
What does this home offer?

Housing options icon

Housing Options: Private / Semi-Private / 1 Bed Suite

Building type icon
Building type icon

Building Type: 3-story

Beauty services icon

Beauty Services

Transportation services icon

Transportation Services

Housekeeping icon
Housekeeping icon

Housekeeping Services

Social and recreational activities icon

Social and Recreational Activities

Security systems icon

Security Systems

Who this home usually serves

TYPE OF STAY

Primarily long-term care, limited rehab

Most residents stay long-term, while a smaller portion are admitted for short-term rehab.

Most new residents arrive under private pay (63% of admissions), and a typical private pay stay runs around 14 days.

Admissions
914 total

Coverage residents most often arrive under.

Medicare 15%
Private pay 63%
Medicaid 21%
Discharges
904 total

Coverage residents most often leave under.

Medicare 11%
Private pay 68%
Medicaid 21%

Places of interest near Yuma Senior Living

Address 1.1 miles from city center Info Estimated distance in miles from Yuma's city center to Yuma Senior Living's address, calculated via Google Maps.

Calculate Travel Distance to Yuma Senior Living

Add your location

Address

Frequently Asked Questions about Yuma Senior Living

Is Yuma Senior Living in a walkable area?

Yuma Senior Living has a walk score of 81. Very walkable. Most errands can be accomplished on foot, and many essentials are within a short walk.

What is the license number of Yuma Senior Living?

According to AZ state health department records, Yuma Senior Living's license number is AL10505C.

When does Yuma Senior Living's license expire?

According to AZ state health department records, Yuma Senior Living's license expires on October 31, 2026.

What is the occupancy rate at Yuma Senior Living?

Yuma Senior Living's occupancy is 65%.

Does Yuma Senior Living operate as a for-profit or non-profit?

Yuma Senior Living is registered as a for-profit in AZ.

Who is the administrator of Yuma Senior Living?

Deborah N Hall is the administrator of Yuma Senior Living.

How many beds does Yuma Senior Living have?

Yuma Senior Living has 202 beds.

Guides for Better Senior Living

Care Cost Calculator: See Prices in Your Area

Nursing Home Data Explorer

Don’t Wait Too Long: 7 Red Flag Signs Your Parent Needs Assisted Living Now

The True Cost of Assisted Living in 2025 – And How Families Are Paying For It

Understanding Senior Living Costs: Pricing Models, Discounts & Financial Assistance