


Hospitalizations per 1,000 days
 Number of hospitalizations per 1,000 long-stay resident days.
2.99
Number of hospitalizations per 1,000 long-stay resident days.
2.99
Mississippi average: 2.44
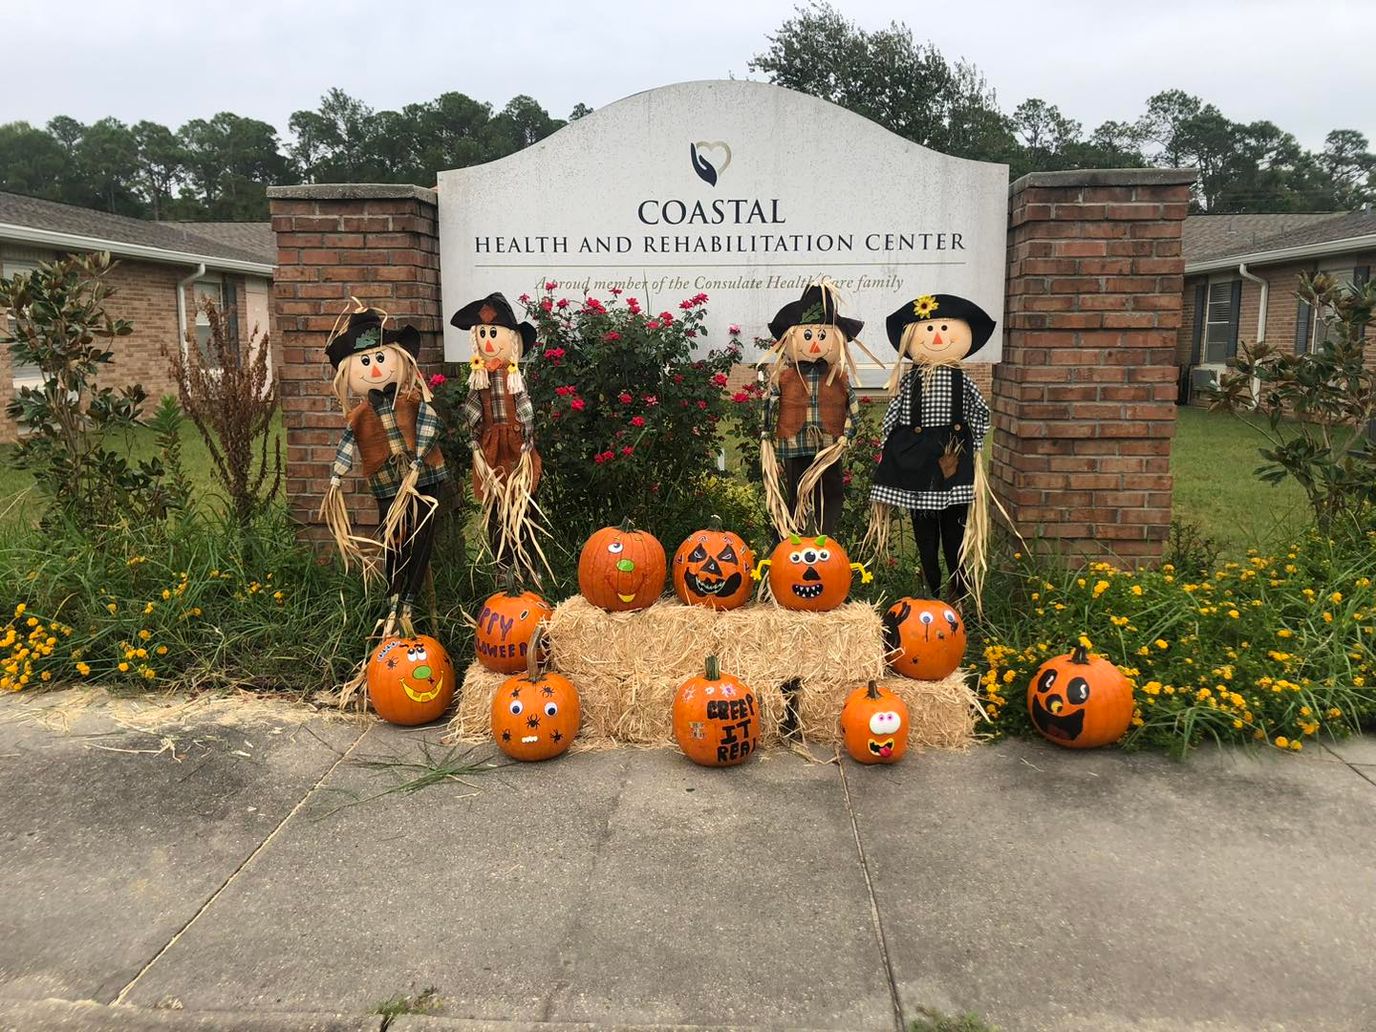
Coastal Health and Rehabilitation Center is dedicated to providing exceptional healthcare services with a touch of class. Their facility is designed to offer a modern and comforting environment that assures residents of personalized attention and advanced medical technologies. The staff is not just highly qualified, but also genuinely passionate about their work. They stress their commitment to delivering extraordinary outcomes.
The home offers specialized care programs such as wound care and short-term rehab, which includes post-surgical care, therapies, and pain management. For long-term care, they provide services such as palliative care, social services, respite, therapeutic recreation, and round-the-clock nursing care. They also provide a variety of amenities, including fine dining, spacious accommodations, private and semi-private rooms, recreational programs, cable TV, and internet services. Coastal Health and Rehabilitation Center continuously strives to redefine healthcare with novel and effective strategies that improve the lives of their residents.
| Staff type | Hours / Day / Resident | vs state avg |
|---|---|---|
|
Registered Nurse (RN)
| 25m per day | ▼ 34% State avg: 38m per day · National avg: 41m per day |
|
LPN / LVN
| 1h 0m per day | ▼ 8% State avg: 1h 5m per day · National avg: 52m per day |
|
Nurse Aide
| 1h 53m per day | ▼ 24% State avg: 2h 29m per day · National avg: 2h 21m per day |
|
Weekend Total Nursing
| 2h 56m per day | ▼ 17% State avg: 3h 31m per day · National avg: 3h 26m per day |
|
Weekend RN
| 14m per day | ▼ 36% State avg: 22m per day · National avg: 29m per day |
These measures show how residents usually do over time at this home, based on health outcomes and preventive care.
Mississippi average: 2.44
Mississippi average: 2.88
Mississippi average: 27.9%
Mississippi average: 15.3%
Mississippi average: 0.8%
Mississippi average: 53.7%
Mississippi average: 50.6%
Quality measures are calculated from Minimum Data Set (MDS) assessments. For most measures, lower percentages indicate better care quality.
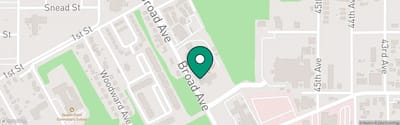
![]() 2.3 miles from city center
2.3 miles from city center
![]() Estimated distance in miles from Gulfport's city center to Coastal Health and Rehabilitation Center – Gulfport's address, calculated via Google Maps.
Estimated distance in miles from Gulfport's city center to Coastal Health and Rehabilitation Center – Gulfport's address, calculated via Google Maps.
Add your location
The information below is reported by the Mississippi State Department of Health, Bureau of Health Facilities Licensure.
| Woodland Village Nursing Center | NH HOS IL MC PC RC SNF | Diamondhead | 132
Facility
132
MS AVG
70
Rank
#18 / 266 |
82.6%
Facility
82.6%
MS AVG
84.3
Rank
#75 / 108 | -2% | 5.03
Facility
5.03
MS AVG
4.63
Rank
#31 / 116 | -73% | +9% | $0
Facility
$0
MS AVG
$40.1k
Rank
#1 / 120 | 18
Facility
18
MS AVG
16.9
Rank
#65 / 115 | 4.5
Facility
4.5
MS AVG
3.8
Rank
#78 / 115 | - | 109 | - |
40
Facility
40
MS AVG
33
Rank
#138 / 319 | City Of Gulfport | $14.3MFiscal year ending 09/2023
Facility
$14.3MFiscal year ending 09/2023
MS AVG
$9.6M
Rank
#11 / 112 | $5.4MFiscal year ending 09/2023
Facility
$5.4MFiscal year ending 09/2023
MS AVG
$3.5M
Rank
#5 / 112 | 37.5%Fiscal year ending 09/2023
Facility
37.5%Fiscal year ending 09/2023
MS AVG
37.9%
Rank
#24 / 112 | 255163 | ||||
| Driftwood Nursing Center | NH HOS RC SNF | Gulfport | 151
Facility
151
MS AVG
70
Rank
#7 / 266 |
67.0%
Facility
67.0%
MS AVG
84.3
Rank
#99 / 108 | -21% | - | -29% | - | $0
Facility
$0
MS AVG
$40.1k
Rank
#1 / 120 | 8
Facility
8
MS AVG
16.9
Rank
#10 / 115 | 2.0
Facility
2.0
MS AVG
3.8
Rank
#4 / 115 | - | 101 | - |
47
Facility
47
MS AVG
33
Rank
#100 / 319 | - | $9.7M*Fiscal year ending 2018These figures are from this home's most recent complete cost report — an older period than most facilities report. Compare with that in mind.
Facility
$9.7M*Fiscal year ending 2018These figures are from this home's most recent complete cost report — an older period than most facilities report. Compare with that in mind.
MS AVG
$9.6M
Rank
#35 / 112 | $4.2M*Fiscal year ending 2018These figures are from this home's most recent complete cost report — an older period than most facilities report. Compare with that in mind.
Facility
$4.2M*Fiscal year ending 2018These figures are from this home's most recent complete cost report — an older period than most facilities report. Compare with that in mind.
MS AVG
$3.5M
Rank
#50 / 112 | 43.5%*Fiscal year ending 2018These figures are from this home's most recent complete cost report — an older period than most facilities report. Compare with that in mind.
Facility
43.5%*Fiscal year ending 2018These figures are from this home's most recent complete cost report — an older period than most facilities report. Compare with that in mind.
MS AVG
37.9%
Rank
#82 / 112 | 255290 | ||||
| Lakeview Nursing Center | NH SNF | Gulfport | 105
Facility
105
MS AVG
70
Rank
#53 / 266 |
77.1%
Facility
77.1%
MS AVG
84.3
Rank
#91 / 108 | -9% | 4.71
Facility
4.71
MS AVG
4.63
Rank
#43 / 116 | -36% | +2% | $35.6k
Facility
$35.6k
MS AVG
$40.1k
Rank
#97 / 120 | 30
Facility
30
MS AVG
16.9
Rank
#96 / 115 | 4.3
Facility
4.3
MS AVG
3.8
Rank
#72 / 115 | 8 | 81 | - |
4
Facility
4
MS AVG
33
Rank
#272 / 319 | Lakeview Corporation | $8.5MFiscal year ending 12/2023
Facility
$8.5MFiscal year ending 12/2023
MS AVG
$9.6M
Rank
#28 / 112 | $4.9MFiscal year ending 12/2023
Facility
$4.9MFiscal year ending 12/2023
MS AVG
$3.5M
Rank
#28 / 112 | 57.1%Fiscal year ending 12/2023
Facility
57.1%Fiscal year ending 12/2023
MS AVG
37.9%
Rank
#69 / 112 | 255182 | ||||
| Gulfport Care Center | NH HOS MC SNF | Gulfport | 90
Facility
90
MS AVG
70
Rank
#80 / 266 |
82.2%
Facility
82.2%
MS AVG
84.3
Rank
#76 / 108 | -2% | 4.67
Facility
4.67
MS AVG
4.63
Rank
#43 / 116 | -28% | +1% | $24.3k
Facility
$24.3k
MS AVG
$40.1k
Rank
#90 / 120 | 24
Facility
24
MS AVG
16.9
Rank
#87 / 115 | 6.0
Facility
6.0
MS AVG
3.8
Rank
#103 / 115 | 5 | 74 | - |
9
Facility
9
MS AVG
33
Rank
#248 / 319 | Gerard And Alison Danos Childrens Tr | $8.6MFiscal year ending 12/2023
Facility
$8.6MFiscal year ending 12/2023
MS AVG
$9.6M
Rank
#86 / 112 | $3.7MFiscal year ending 12/2023
Facility
$3.7MFiscal year ending 12/2023
MS AVG
$3.5M
Rank
#45 / 112 | 43.7%Fiscal year ending 12/2023
Facility
43.7%Fiscal year ending 12/2023
MS AVG
37.9%
Rank
#14 / 112 | 255341 |
Coastal Health and Rehabilitation Center – Gulfport is located in Gulfport, Mississippi.
Here are the financial assistance programs available to residents in Mississippi.
Coastal Health and Rehabilitation Center – Gulfport has a walk score of 34. Somewhat walkable. A few nearby services may be reachable on foot, but most trips require transportation.
Yes — there are 3 photos of Coastal Health and Rehabilitation Center – Gulfport in the photo gallery on this page.
Coastal Health and Rehabilitation Center – Gulfport is located at 1530 Broad Ave, Gulfport, MS 39501.
(228) 864-6544 will put you in contact with the team at Coastal Health and Rehabilitation Center – Gulfport.
Coastal Health and Rehabilitation Center – Gulfport is not currently listed as a CMS-certified provider of Medicare or Medicaid.
Care Cost Calculator: See Prices in Your Area
Nursing Home Data Explorer
Don’t Wait Too Long: 7 Red Flag Signs Your Parent Needs Assisted Living Now
The True Cost of Assisted Living in 2025 – And How Families Are Paying For It
Understanding Senior Living Costs: Pricing Models, Discounts & Financial Assistance


