Freedom Village at Brandywine
Nursing Home, Assisted Living, Independent Living, Memory Care & Respite Care · Coatesville, PA
CMS overall rating Info CMS (the Centers for Medicare & Medicaid Services) is the federal agency that rates nursing home quality. Its Overall Rating runs from 1 to 5 stars, combining health inspections, staffing, and quality measures, with inspections weighted most heavily.

Freedom Village at Brandywine

Nursing Home, Assisted Living, Independent Living, Memory Care & Respite Care · Coatesville, PA
CMS overall rating Info CMS (the Centers for Medicare & Medicaid Services) is the federal agency that rates nursing home quality. Its Overall Rating runs from 1 to 5 stars, combining health inspections, staffing, and quality measures, with inspections weighted most heavily.
Calculator: See prices in your area
Freedom Village at Brandywine accepts Medicare and private pay.

Overview of Freedom Village at Brandywine

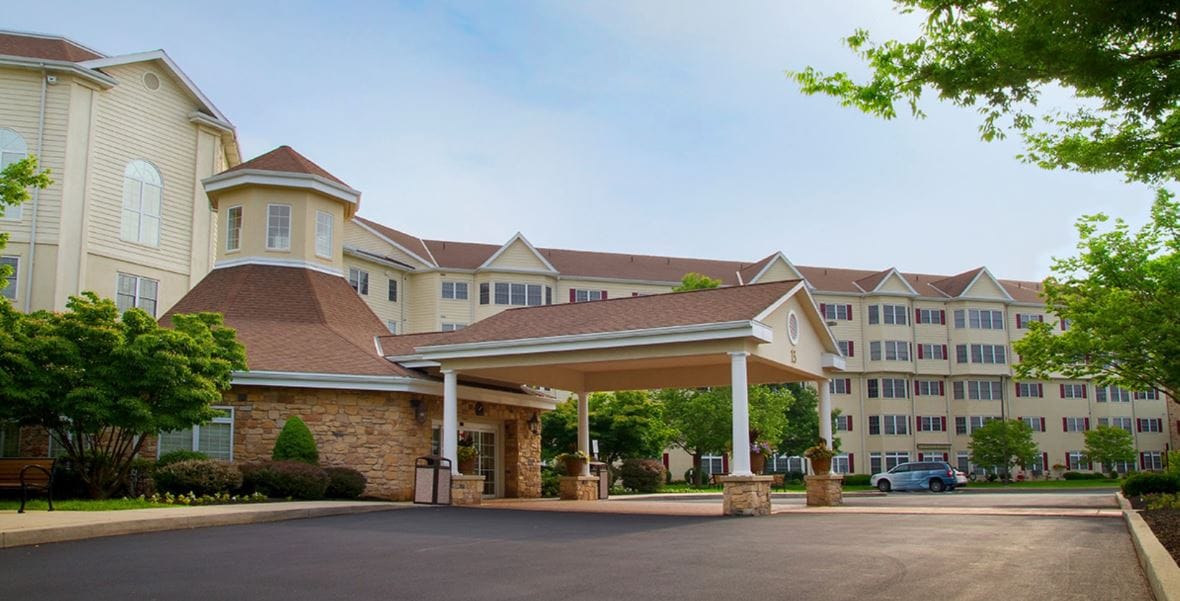
Bask in the sunlight with the esteemed senior living community of Freedom Village at Brandywine which is situated in the lively neighborhood of Freedom Boulevard, Coatesville, PA, offering independent living, memory care, personal care, long-term care, and rehabilitation. With its commitment to providing a safe place for seniors to rest and safely spend their golden years, the community features a variety of cozy and elegant one-bedroom and two-bedroom floor plans. Gain meaningful experiences with the compassionate and specially-trained team that strives to lend extra hands for seniors’ everyday living.

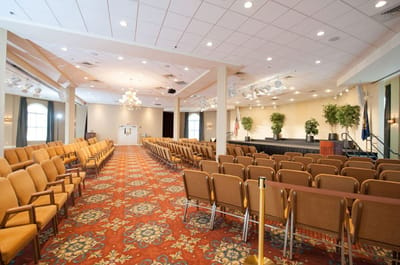
Create wonderful moments with friends and join enjoyable activities and exciting events for an active and well-engaged lifestyle. Focusing on residents’ tastes and nutritional needs, the community meticulously prepares delightful meals for the finest dining experience. Freedom Village at Brandywine is a good place for seniors who want to experience the best things in their golden years. As proof of its unwavering dedication to seniors’ welfare, the community was awarded the Best Nursing Homes for Short-Term Rehabilitation from 2022 to 2023 and Long-Term Care in 2024 by US News and World Report.

Quality ratings

Measured by Centers for Medicare & Medicaid Services (CMS)

Overall rating Info The Overall CMS Rating combines results from health inspections, staffing levels and quality measures. Health inspections carry the most weight. Staffing and quality scores can increase or decrease the final rating based on performance compared to state and national standards.
Health Inspection Info Based on the results of the facility's three most recent standard inspections and any complaint investigations. CMS reviews the number, scope, and severity of deficiencies, with more recent findings weighted more heavily.
Staffing Info Measures average nursing staff hours per resident per day, including Registered Nurses (RNs) and total nursing staff. Ratings are adjusted based on the level of care residents require and are compared to state and national benchmarks.
Quality Measures Info Based on clinical and physical health indicators reported to CMS, such as hospital readmissions, falls, pressure ulcers, and improvements in mobility. These measures reflect how well residents' health needs are being managed.

Staffing hours breakdown

Info Daily nursing hours per resident by staff type, reported to CMS. Higher is generally better — compare this facility to state and national averages to see where staffing stands.

Hours per resident per day — compared to state averages

Total nursing care / resident Info Total adjusted nursing hours per resident per day, combining RN, LPN, and aide time. CMS adjusts this for case-mix so facilities can be fairly compared.
4h 14m per day
Rank #99 / 207Nurse hours — State benchmarkedThis home is ranked 99th out of 207 homes in Pennsylvania. Shows adjusted nurse hours per resident per day benchmarked to the Pennsylvania average, with a ranking across 207 Pennsylvania facilities. More hours mean more direct care. The national average is about 3.5 hrs; below 3.0 is a red flag.Rankings are based only on facilities in Pennsylvania that report data for that category. Facilities without available data are excluded from the ranking.Click the rank badge to see the full State ranking.Click here to see the full State ranking.
vs avg
Staff typeHours / Day / Residentvs state avg
Registered Nurse (RN) Info RNs hold the highest nursing license and can assess residents, interpret test results, and direct care plans. More RN hours per day often signals stronger clinical oversight and faster response to health changes. 1h 3m per day
LPN / LVN Info Licensed Practical Nurses (LPNs) or Licensed Vocational Nurses (LVNs) deliver routine hands-on care — medication administration, wound dressing, and monitoring vital signs. They work under RN supervision and make up a large share of daily bedside care. 1h 4m per day
Nurse Aide Info Certified Nurse Aides (CNAs) provide the most direct day-to-day assistance: bathing, dressing, feeding, and mobility. Nurse aide hours are typically the largest staffing category and directly affect residents' quality of life. 2h 23m per day
Weekend Total Nursing Info Combined nursing hours (RN + LPN + Nurse Aide) per resident per day on weekends. Staffing often drops on weekends — this figure reveals whether the facility maintains adequate coverage outside of weekday hours. 4h 3m per day
Physical Therapist Info Hours per resident per day provided by licensed Physical Therapists (PTs) or PT Assistants. PT services help residents recover mobility after injury or illness and are especially important for post-acute (short-stay) rehabilitation. 9m per day
Weekend RN Info Registered nurse hours specifically on weekends. Facilities sometimes reduce RN presence on Saturdays and Sundays — a low weekend RN figure compared to weekday hours can indicate reduced clinical oversight when most administrative staff are absent. 39m per day

Capacity and availability

This home usually has limited availability

Similar occupancy to the state average
Occupancy rate
90.9% Rank #48 / 518Occupancy rate — State benchmarkedThis home is ranked 48th out of 518 homes in Pennsylvania. Shows this facility's occupancy rate versus the Pennsylvania average, with its Statewide rank out of 518. Higher occupancy signals strong local demand and financial stability.Rankings are based only on facilities in Pennsylvania that report data for that category. Facilities without available data are excluded from the ranking.Click the rank badge to see the full State ranking.Click here to see the full State ranking.
Avg. Length of Stay
74 days
Bed community size
60-bed community Rank #399 / 555Bed count — State benchmarkedThis home is ranked 399th out of 555 homes in Pennsylvania. Shows this facility's certified or reported bed count compared to other Pennsylvania facilities. Larger communities may offer more amenities, programs, and on-site services for residents and families.Rankings are based only on facilities in Pennsylvania that report data for that category. Facilities without available data are excluded from the ranking.Click the rank badge to see the full State ranking.Click here to see the full State ranking.
A moderately sized community that may balance personal attention with shared amenities and social activities.
Years in operation
48 years in operation
A longer operating history, which may indicate experience navigating regulations and delivering ongoing care.
Walk Score
Walk Score: 9 / 100 Rank #603 / 668Walk Score — State benchmarkedThis home is ranked 603rd out of 668 homes in Pennsylvania. Shows how walkable this facility's neighborhood is compared to the average Walk Score across Pennsylvania facilities. Higher scores benefit residents, families, and staff.Rankings are based only on facilities in Pennsylvania that report data for that category. Facilities without available data are excluded from the ranking.Click the rank badge to see the full State ranking.Click here to see the full State ranking.
Car-dependent. Most errands require a car, with limited nearby walkable options.
BBB Rating
BBB Rating: A+ (Not Accredited)
An independent rating from the Better Business Bureau based on factors such as complaint history, transparency, and business practices.
How BBB ratings work

About this community

License Details

AccreditationsAmerica’s Best CCRCs by Newsweek and Statista 2026

Staffing

Key information about the people who lead and staff this community.

Leadership

ContactMs. Denise Warren, Interim CEO

Therapy & Rehabilitation

1 service
Rehabilitation Services

Additional Services

1 service
Personal Care

Amenities & Lifestyle

Volunteer Program

Contact Freedom Village at Brandywine

Health Inspection History

Inspections since 2022
Total health inspections 3

State average N/A


Last Health inspection on Sep 2024

Total health citations
5 Rank #31 / 207Health citations — State benchmarkedThis home is ranked 31st out of 207 homes in Pennsylvania. Shows this facility's total health deficiency citations benchmarked to the Pennsylvania State average, with a ranking across all 207 PA facilities. Lower citation counts earn a better rank.Rankings are based only on facilities in Pennsylvania that report data for that category. Facilities without available data are excluded from the ranking.Click the rank badge to see the full State ranking.Click here to see the full State ranking.

State average N/A

Citations per inspection
1.67 Rank #27 / 207Citations per inspection — State benchmarkedThis home is ranked 27th out of 207 homes in Pennsylvania. Shows average deficiency citations per CMS inspection for this facility versus the Pennsylvania mean across 207 facilities with citation data. Lower is better.Rankings are based only on facilities in Pennsylvania that report data for that category. Facilities without available data are excluded from the ranking.Click the rank badge to see the full State ranking.Click here to see the full State ranking.

State average N/A


Health citations are formal notices following inspections when they fail to comply with safety and care standards.

All 5 citations resulted from standard inspections.

Breakdown of citation severity (last 4 years)
Critical health citations
0
In line with State average

State average: N/A


Serious health citations
0
In line with State average

State average: N/A

0 critical citations State average: N/A

0 serious citations State average: N/A

5 moderate citations State average: N/A

0 minor citations State average: N/A
Citations history (last 4 years)
Pharmacy moderate citation Sep 13, 2024
Corrected

Quality of Care moderate citation Sep 13, 2024
Corrected

Quality of Care moderate citation Oct 20, 2023
Corrected

Abuse/Neglect moderate citation Dec 08, 2022
Corrected

Staffing Data

Reporting period: October 1 – December 31, 2025 (Q4 2025). Source: CMS Payroll-Based Journal report.

Total staff 102
Employees 85
Contractors 17
Staff to resident ratio 2.27 : 1
0% compared with State average

State average ratio: 0 : 0

Avg staff/day 34
Average shift 7.4 hours
0% compared with State average

State average: 0 hours

Total staff hours (quarter) 23,219

Nursing staff breakdown

Q4 2025 · Oct 1 – Dec 31 More info This data comes from the CMS Payroll-Based Journal report covering October 1 – December 31, 2025.
Registered Nurse

Manages medical care and health needs.

RN Staff Info All 16 RN Staff are full-time employees. No contractors work on this role. 16
Average shift length Info Average shift length. Calculated as total hours divided by days worked and average staff per day. 7.1 hours
Licensed Practical Nurse

Assists with medical care and medications.

LPN Staff Info All 19 LPN Staff are full-time employees. No contractors work on this role. 19
Average shift length Info Average shift length. Calculated as total hours divided by days worked and average staff per day. 7.4 hours
Certified Nursing Assistant

Helps with daily care and mobility.

CNA Staff Info All 39 CNA Staff are full-time employees. No contractors work on this role. 39
Average shift length Info Average shift length. Calculated as total hours divided by days worked and average staff per day. 8.2 hours

Contractor staffing

Q4 2025 · Oct 1 – Dec 31 More info This data comes from the CMS Payroll-Based Journal report covering October 1 – December 31, 2025.

Total hours from contractors

7.1%

1,654 contractor hours this quarter

Physical Therapy Assistant: 6 Respiratory Therapy Technician: 3 Qualified Social Worker: 3 Physical Therapy Aide: 3 Speech Language Pathologist: 2

Staff by category

Q4 2025 · Oct 1 – Dec 31 More info This data comes from the CMS Payroll-Based Journal report covering October 1 – December 31, 2025.
Certified Nursing Assistant3903910,09192100%8.2
Licensed Practical Nurse190194,54792100%7.4
Registered Nurse160163,08292100%7.1
Clinical Nurse Specialist4049246672%7.7
Respiratory Therapy Technician0336548188%6.3
Physical Therapy Aide0336216267%7.6
Administrator1015286672%8
Dental Services Staff1014966166%8.1
Other Dietary Services Staff1014746166%7.8
Dietitian1014686267%7.5
Occupational Therapy Aide1014656267%7.5
Nurse Practitioner1014586166%7.5
Physical Therapy Assistant0662414145%4.9
Qualified Social Worker0331063841%2.6
Medical Director101334852%0.7
Speech Language Pathologist02233910%3.6
39 Certified Nursing Assistant
% of Days 100%
19 Licensed Practical Nurse
% of Days 100%
16 Registered Nurse
% of Days 100%
4 Clinical Nurse Specialist
% of Days 72%
3 Respiratory Therapy Technician
% of Days 88%
3 Physical Therapy Aide
% of Days 67%
1 Administrator
% of Days 72%
1 Dental Services Staff
% of Days 66%
1 Other Dietary Services Staff
% of Days 66%
1 Dietitian
% of Days 67%
1 Occupational Therapy Aide
% of Days 67%
1 Nurse Practitioner
% of Days 66%
6 Physical Therapy Assistant
% of Days 45%
3 Qualified Social Worker
% of Days 41%
1 Medical Director
% of Days 52%
2 Speech Language Pathologist
% of Days 10%

Penalties and fines

Federal penalties imposed by CMS for regulatory violations, including civil money penalties (fines) and denials of payment for new Medicare/Medicaid admissions.

Source: CMS Penalties Database

No penalties in the past 3 years

No civil money penalties or payment denials were reported in the last 3 years.

Quality of care over time

These measures show how residents usually do over time at this home, based on health outcomes and preventive care.

High-risk clinical events score Info A composite score based on pressure ulcers, falls with injury, weight loss, walking ability decline, and activities of daily living decline. 9.1
17% better than State average

State average: 11.0

Functional decline score Info A composite score based on activities of daily living decline, walking ability decline, and incontinence. 24.0
8% worse than State average

State average: 22.2

Long-stay resident measures
Need for Help with Daily Activities Increased Info Percent of long-stay residents whose need for help with daily activities has increased 11.7%
39% better than State average

State average: 19.0%

Walking Ability Worsened Info Percent of long-stay residents whose ability to move independently worsened 21.8%
In line with State average

State average: 21.1%

Low Risk Residents with Bowel/Bladder Incontinence Info Percent of low risk long-stay residents who lose control of their bowels or bladder 38.6%
44% worse than State average

State average: 26.7%

Falls with Major Injury Info Percent of long-stay residents experiencing one or more falls with major injury 2.1%
35% better than State average

State average: 3.2%

High Risk Residents with Pressure Ulcers Info Percent of long-stay high risk residents with pressure ulcers 3.4%
39% better than State average

State average: 5.5%

Urinary Tract Infection Info Percent of long-stay residents with a urinary tract infection 4.2%
140% worse than State average

State average: 1.8%

Lost Too Much Weight Info Percent of long-stay residents who lose too much weight 6.7%
In line with State average

State average: 6.6%

Depressive Symptoms Info Percent of long-stay residents who have depressive symptoms 7.6%
38% worse than State average

State average: 5.5%

Antipsychotic Use Info Percent of long-stay residents who received an antipsychotic medication 9.2%
46% better than State average

State average: 17.1%

Pneumococcal Vaccine Info Percent of long-stay residents assessed and appropriately given the pneumococcal vaccine 69.4%
20% worse than State average

State average: 86.9%

Influenza Vaccine Info Percent of long-stay residents assessed and appropriately given the seasonal influenza vaccine 100.0%
7% better than State average

State average: 93.5%

Short-stay resident measures
Pneumococcal Vaccine Info Percent of short-stay residents assessed and appropriately given the pneumococcal vaccine 60.0%
13% worse than State average

State average: 68.8%

Antipsychotic medication increase Info Percent of short-stay residents who newly received an antipsychotic medication 1.0%
33% better than State average

State average: 1.5%

Influenza Vaccine Info Percent of short-stay residents assessed and appropriately given the seasonal influenza vaccine 83.8%
22% better than State average

State average: 68.7%

Breakdown by payment type

Medicare

65% of new residents, usually for short-term rehab.

Typical stay 21 days

Private pay

35% of new residents, often for short stays.

Typical stay 1 - 2 years

Facility Characteristics

Source: CMS Long-Term Care Facility Characteristics (Data as of Jan 2026)

Total residents 45
Medicare
6
13.3% of residents
Private pay or other
39
86.7% of residents
Programs & Services
Residents Group

Residents meet regularly to discuss policies, care quality, and activities

CCRC

Part of a Continuing Care Retirement Community offering multiple care levels

Active Resident Council

Organized group of residents that meets regularly to discuss facility policies, quality of life, and activities.

Finances and operations

Based on CMS SNF Cost Report for fiscal year ending in 12/2023.

For-profit
Corporation
Net patient revenue Info Net patient revenue — what the home actually collects for resident care, after contractual allowances, bad debt and discounts are subtracted from its gross charges (CMS cost report, Worksheet G-3). It covers resident care only; money the home earns from other sources is shown separately as "Other income."
$12.5M
Net patient income Info Net patient income: net patient revenue minus the home's total operating expenses. A positive figure means it earns more from resident care than it spends to deliver it; a negative figure means the opposite. It excludes non-operating "other income."
-$24.5M
For-profit Corporation
Net patient revenue Info Net patient revenue — what the home actually collects for resident care, after contractual allowances, bad debt and discounts are subtracted from its gross charges (CMS cost report, Worksheet G-3). It covers resident care only; money the home earns from other sources is shown separately as "Other income."
$12.5M Rank #42 / 209Revenue — State benchmarkedThis home is ranked 42nd out of 209 homes in Pennsylvania. Shows this facility's annual revenue compared to the Pennsylvania average. Higher revenue generally means more resources for staffing and capital — read alongside Payroll %.Rankings are based only on facilities in Pennsylvania that report data for that category. Facilities without available data are excluded from the ranking.Click the rank badge to see the full State ranking.Click here to see the full State ranking.
Net patient income Info Net patient income: net patient revenue minus the home's total operating expenses. A positive figure means it earns more from resident care than it spends to deliver it; a negative figure means the opposite. It excludes non-operating "other income."
-$24.5M
Other income Info Money the home earns outside of resident care — such as investments, grants, rentals and other non-operating sources (CMS cost report, Worksheet G-3). It is tracked separately from net patient revenue: it is not part of that figure, and it is not included in net patient income.
$25.0M
Payroll costs Info Staff salaries plus wage-related costs — benefits such as payroll taxes, health insurance and retirement — from the home's own accounting records (CMS cost report, Worksheet A). Contract or agency labor is counted separately, under other operating costs. Rank #55 / 209Payroll — State benchmarkedThis home is ranked 55th out of 209 homes in Pennsylvania. Shows total annual staff payroll benchmarked to the Pennsylvania average. Higher payroll investment relative to peers often signals better staffing and less reliance on cheaper contract labor.Rankings are based only on facilities in Pennsylvania that report data for that category. Facilities without available data are excluded from the ranking.Click the rank badge to see the full State ranking.Click here to see the full State ranking.
$14.5M 116% of net patient revenue Info Payroll as a share of revenue: staff salaries and wage-related benefits divided by net patient revenue. A higher figure means more of each revenue dollar goes to staff pay. Rank #170 / 209Payroll % — State benchmarkedThis home is ranked 170th out of 209 homes in Pennsylvania. Shows payroll as a percentage of revenue versus the Pennsylvania average. Well-run Pennsylvania facilities typically land around 53–61% — the top third Statewide. Below 25% may signal understaffing or heavy agency use — read with Staffing ratings.Rankings are based only on facilities in Pennsylvania that report data for that category. Facilities without available data are excluded from the ranking.Click the rank badge to see the full State ranking.Click here to see the full State ranking.
Other operating costs Info Everything it costs to run the home apart from payroll — food, utilities, supplies, maintenance, contract labor and administration. Calculated as total operating expense minus payroll (staff salaries and wage-related benefits).
$22.5M
Total costs Info The home's total operating expense for the year — all the costs of running it, salaries included (CMS cost report, Worksheet G-3).
$37.0M

What does this home offer?

Pets allowed icon
Pets allowed icon

Pets Allowed

Housing options icon

Housing Options: 1 Bed / 2 Bed

Building type icon
Building type icon

Building Type: Mid-rise

Transportation services icon

Transportation Services

Fitness and recreation icon

Fitness and Recreation

Who this home usually serves

TYPE OF STAY

Mostly short-term rehab stays

Most residents typically stay for a few weeks or months before returning home or moving on.

Most new residents arrive under Medicare (65% of admissions), and a typical Medicare stay runs around 21 days.

Admissions
218 total

Coverage residents most often arrive under.

Medicare 65%
Private pay 35%
Discharges
263 total

Coverage residents most often leave under.

Medicare 50%
Private pay 50%

Places of interest near Freedom Village at Brandywine

Address 2.6 miles from city center Info Estimated distance in miles from Coatesville's city center to Freedom Village at Brandywine's address, calculated via Google Maps.

Calculate Travel Distance to Freedom Village at Brandywine

Add your location

Address

Compare Nursing Homes around the area

The information below is reported by the Pennsylvania Department of Human Services and Department of Health.

Freedom Village at Brandywine
NH
AL
IL
MC
RC
Coatesville -60 A+ 9 1 Bed / 2 Bed
Barclay Friends
NH
AL
MC
RC
West Chester (North Franklin Street) -103 A+ 35 Private / Shared Suites
Overlook Green Senior Living
NH
MC
Pittsburgh -128 - 30 Studio / 1 Bed
Souderton Mennonite Homes
NH
AL
MC
RC
Souderton -154 - 31 Studio / 1 Bed / 2 Bed
Dock Woods
NH
AL
IL
MC
RC
Lansdale -80 - 21 Studio / 1 Bed / 2 Bed

Frequently Asked Questions about Freedom Village at Brandywine

Is Freedom Village at Brandywine in a walkable area?

Freedom Village at Brandywine has a walk score of 9. Car-dependent. Most errands require a car, with limited nearby walkable options.

What is the occupancy rate at Freedom Village at Brandywine?

Freedom Village at Brandywine's occupancy is 90.9%.

Does Freedom Village at Brandywine operate as a for-profit or non-profit?

Freedom Village at Brandywine is registered as a for-profit in PA.

Are there photos of Freedom Village at Brandywine?

Yes — there are 5 photos of Freedom Village at Brandywine in the photo gallery on this page.

What is the address of Freedom Village at Brandywine?

Freedom Village at Brandywine is located at 15 Freedom Blvd, Coatesville, PA 19320.

What is the phone number of Freedom Village at Brandywine?

(610) 572-2017 will put you in contact with the team at Freedom Village at Brandywine.

Is Freedom Village at Brandywine Medicare or Medicaid certified?

Yes — Freedom Village at Brandywine is a CMS-certified provider of Medicare and Medicaid.

Guides for Better Senior Living

Care Cost Calculator: See Prices in Your Area

Nursing Home Data Explorer

Don’t Wait Too Long: 7 Red Flag Signs Your Parent Needs Assisted Living Now

The True Cost of Assisted Living in 2025 – And How Families Are Paying For It

Understanding Senior Living Costs: Pricing Models, Discounts & Financial Assistance