


Assisted Living of Rockville II


Assisted Living of Rockville II
Overview of Assisted Living of Rockville II
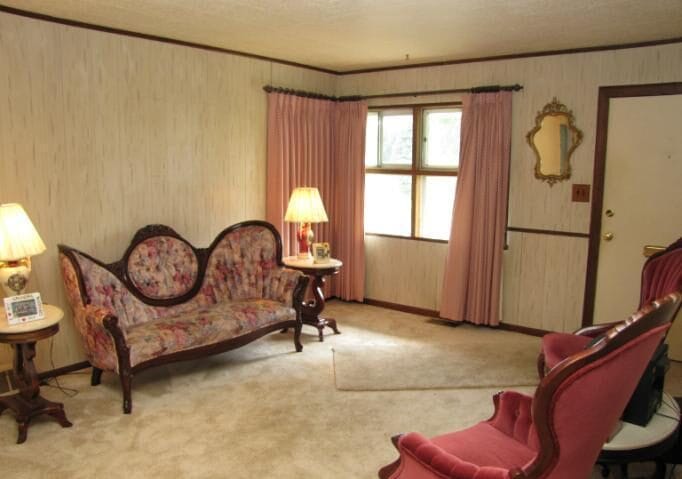
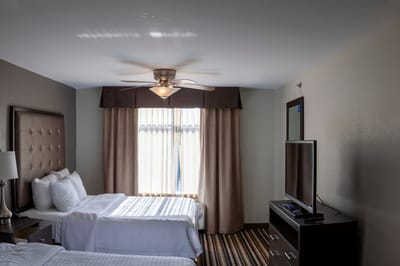
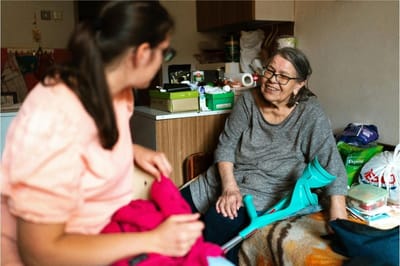
Ideally set in the harmonious residential area of Parkland Drive, Rockville, MD, Assisted Living of Rockville II is an outstanding community that offers assisted living. The community strives to provide the highest quality of care and assistance for up to eight residents with a compassionate and highly skilled team attending to their needs around the clock. With assistance with daily living activities and household responsibilities, residents are guaranteed to enjoy the utmost care and comfort they deserve.
Here, fun activities and engaging programs are also conducted to keep residents active and socially connected. Healthy and delightful meals are served to meet residents’ dietary needs and preferences. The community also works closely with healthcare providers to coordinate residents’ healthcare needs, ensuring their needs are met. Transportation services and medication management are also also available for residents’ convenience. Enjoy your later years without worries with the community’s trusted care.
6-bed community Rank #410 / 697Bed count — State benchmarkedThis home is ranked 410th out of 697 homes in Maryland. Shows this facility's certified or reported bed count compared to other Maryland facilities. Larger communities may offer more amenities, programs, and on-site services for residents and families.Rankings are based only on facilities in Maryland that report data for that category. Facilities without available data are excluded from the ranking.Click the rank badge to see the full State ranking.Click here to see the full State ranking.
A smaller, more intimate setting that may offer a quieter environment and closer staff-resident interactions.
Walk Score: 57 / 100 Rank #349 / 985Walk Score — State benchmarkedThis home is ranked 349th out of 985 homes in Maryland. Shows how walkable this facility's neighborhood is compared to the average Walk Score across Maryland facilities. Higher scores benefit residents, families, and staff.Rankings are based only on facilities in Maryland that report data for that category. Facilities without available data are excluded from the ranking.Click the rank badge to see the full State ranking.Click here to see the full State ranking.
Moderately walkable. Some errands can be accomplished on foot, with a mix of nearby amenities.
About this community
Facility TypeAssisted Living
CountyMontgomery
Safety Features24 Hour Supervision
Rehabilitation Services
Respite Care
Nursing Services
24-Hour Staffing
No mild Alzheimer's level
No moderate Alzheimer's level
No severe Alzheimer's level
Visitor PolicyFamily members can visit anytime.
Linen ServiceYes
Transportation
Housekeeping
Laundry
Dining Services
Wellness Program
Specific ProgramsMemory & Dementia Care, Rehabilitation & Recovery Programs
What does this home offer?
Housing Options: Private Rooms
Building Type: Single-story
Housekeeping Services
Recreational Activities
Places of interest near Assisted Living of Rockville II
![]() 4.2 miles from city center
4.2 miles from city center
![]() Estimated distance in miles from Rockville's city center to Assisted Living of Rockville II's address, calculated via Google Maps.
Estimated distance in miles from Rockville's city center to Assisted Living of Rockville II's address, calculated via Google Maps.
Calculate Travel Distance to Assisted Living of Rockville II
Add your location
Compare Assisted Living around Rockville
The information below is reported by the Maryland Department of Health, Office of Health Care Quality.
| Brightview Fallsgrove | AL MC | Rockville (Glenora Hills) | 100
Facility
100
MD AVG
43
Rank
#117 / 697 | No |
34
Facility
34
MD AVG
43
Rank
#590 / 985 | Studio / 1 Bed | 13
Facility
13
MD AVG
21
Rank
#141 / 208 | - |
19% Male Residents — State Benchmarked 19% of residents are male, compared to the Maryland average of 31%. This facility caters to a majority female resident pool (81% female), consistent with the broader assisted living trend where women significantly outnumber men. |
81% Female Residents — State Benchmarked 81% of residents are female, compared to the Maryland average of 69%. Women comprise the large majority, consistent with national assisted living demographics where women live longer and enter care facilities at higher rates. |
91% White Residents — State Benchmarked 91% of residents are reported as White, compared to the Maryland average of 81%. A higher White share than is typical for assisted living in Maryland in this dataset — compare with peer facilities for local context. |
2% African American Residents — State Benchmarked 2% of residents are reported as African American or Black, compared to the Maryland average of 13%. A lower African American share than is typical in Maryland; local markets still vary widely. |
7% Other Ethnicity Residents — State Benchmarked 7% of residents fall into categories other than White or African American (combined), compared to the Maryland average of 6%. This column aggregates Hispanic, Asian, multiracial, and any other labeled groups that are not classified as White or African American. Reported subgroups in this total: Asian (5%), Other (2%). |
2% Residents Age 65–74 — State Benchmarked 2% of residents are 65–74, compared to the Maryland average of 13%. Fewer younger seniors suggests the resident population skews older, likely requiring higher acuity care and more hands-on support. |
35% Residents Age 75–84 — State Benchmarked 35% of residents are 75–84, compared to the Maryland average of 31%. This is the second most common age bracket in assisted living, representing residents with moderate care needs. |
39% Residents Age 85–94 — State Benchmarked 39% of residents are 85–94, compared to the Maryland average of 44%. This is typically the most common age bracket in assisted living — this facility is in line with the statewide norm. |
19% Residents Age 95+ — State Benchmarked 19% of residents are 95 or older, compared to the Maryland average of 16%. In line with the statewide profile for the oldest resident bracket. |
| Brightview West End | AL IL MC | Rockville | 98
Facility
98
MD AVG
43
Rank
#135 / 697 | Yes |
89
Facility
89
MD AVG
43
Rank
#32 / 985 | Studio / 1 Bed / 2 Bed | 8
Facility
8
MD AVG
21
Rank
#162 / 208 | - |
32% Male Residents — State Benchmarked 32% of residents are male, compared to the Maryland average of 31%. This facility caters to a majority female resident pool (68% female), consistent with the broader assisted living trend where women significantly outnumber men. |
68% Female Residents — State Benchmarked 68% of residents are female, compared to the Maryland average of 69%. Women comprise the large majority, consistent with national assisted living demographics where women live longer and enter care facilities at higher rates. |
84% White Residents — State Benchmarked 84% of residents are reported as White, compared to the Maryland average of 81%. Close to the average for this category among assisted living facilities in Maryland with reported race/ethnicity data. |
4% African American Residents — State Benchmarked 4% of residents are reported as African American or Black, compared to the Maryland average of 13%. A lower African American share than is typical in Maryland; local markets still vary widely. |
12% Other Ethnicity Residents — State Benchmarked 12% of residents fall into categories other than White or African American (combined), compared to the Maryland average of 6%. This column aggregates Hispanic, Asian, multiracial, and any other labeled groups that are not classified as White or African American. Reported subgroups in this total: Other (5%), Asian (4%), Mixed Race (4%). |
14% Residents Age 65–74 — State Benchmarked 14% of residents are 65–74, compared to the Maryland average of 13%. In line with the statewide profile for this youngest senior bracket in assisted living. |
37% Residents Age 75–84 — State Benchmarked 37% of residents are 75–84, compared to the Maryland average of 31%. A high concentration in this mid-range bracket, where residents typically need moderate support with daily activities. |
33% Residents Age 85–94 — State Benchmarked 33% of residents are 85–94, compared to the Maryland average of 44%. The population here skews younger than the statewide norm, which may indicate a more active, lower-acuity community. |
16% Residents Age 95+ — State Benchmarked 16% of residents are 95 or older, compared to the Maryland average of 16%. In line with the statewide profile for the oldest resident bracket. |
| Landow House | AL HC IL MC NH | Rockville (Rollins Park) | 98
Facility
98
MD AVG
43
Rank
#135 / 697 | Yes |
59
Facility
59
MD AVG
43
Rank
#327 / 985 | 1 Bed / 2 Bed | 31
Facility
31
MD AVG
21
Rank
#38 / 208 | - |
31% Male Residents — State Benchmarked 31% of residents are male, compared to the Maryland average of 31%. This facility caters to a majority female resident pool (69% female), consistent with the broader assisted living trend where women significantly outnumber men. |
69% Female Residents — State Benchmarked 69% of residents are female, compared to the Maryland average of 69%. Women comprise the large majority, consistent with national assisted living demographics where women live longer and enter care facilities at higher rates. |
99% White Residents — State Benchmarked 99% of residents are reported as White, compared to the Maryland average of 81%. A higher White share than is typical for assisted living in Maryland in this dataset — compare with peer facilities for local context. |
0% African American Residents — State Benchmarked 0% of residents are reported as African American or Black, compared to the Maryland average of 13%. A lower African American share than is typical in Maryland; local markets still vary widely. |
1% Other Ethnicity Residents — State Benchmarked 1% of residents fall into categories other than White or African American (combined), compared to the Maryland average of 6%. This column aggregates Hispanic, Asian, multiracial, and any other labeled groups that are not classified as White or African American. Reported subgroups in this total: Asian (1%). |
7% Residents Age 65–74 — State Benchmarked 7% of residents are 65–74, compared to the Maryland average of 13%. Fewer younger seniors suggests the resident population skews older, likely requiring higher acuity care and more hands-on support. |
20% Residents Age 75–84 — State Benchmarked 20% of residents are 75–84, compared to the Maryland average of 31%. Below the state norm — the resident mix may skew either younger or older than this typical middle bracket. |
49% Residents Age 85–94 — State Benchmarked 49% of residents are 85–94, compared to the Maryland average of 44%. A high concentration of very elderly residents signals a higher-acuity facility with experience caring for advanced age-related needs. |
24% Residents Age 95+ — State Benchmarked 24% of residents are 95 or older, compared to the Maryland average of 16%. A high proportion of the oldest-old suggests strong end-of-life care experience and very-high-acuity capabilities. |
| Sunrise of Rockville | AL | Rockville (Baltimore Road) | 89
Facility
89
MD AVG
43
Rank
#160 / 697 | Yes |
89
Facility
89
MD AVG
43
Rank
#32 / 985 | Studio / 1 Bed / 2 Bed | 45
Facility
45
MD AVG
21
Rank
#4 / 208 | A- |
23% Male Residents — State Benchmarked 23% of residents are male, compared to the Maryland average of 31%. This facility caters to a majority female resident pool (77% female), consistent with the broader assisted living trend where women significantly outnumber men. |
77% Female Residents — State Benchmarked 77% of residents are female, compared to the Maryland average of 69%. Women comprise the large majority, consistent with national assisted living demographics where women live longer and enter care facilities at higher rates. |
87% White Residents — State Benchmarked 87% of residents are reported as White, compared to the Maryland average of 81%. Close to the average for this category among assisted living facilities in Maryland with reported race/ethnicity data. |
2% African American Residents — State Benchmarked 2% of residents are reported as African American or Black, compared to the Maryland average of 13%. A lower African American share than is typical in Maryland; local markets still vary widely. |
11% Other Ethnicity Residents — State Benchmarked 11% of residents fall into categories other than White or African American (combined), compared to the Maryland average of 6%. This column aggregates Hispanic, Asian, multiracial, and any other labeled groups that are not classified as White or African American. Reported subgroups in this total: Mixed Race (6%), Hispanic (3%), Asian (2%). |
3% Residents Age 65–74 — State Benchmarked 3% of residents are 65–74, compared to the Maryland average of 13%. Fewer younger seniors suggests the resident population skews older, likely requiring higher acuity care and more hands-on support. |
31% Residents Age 75–84 — State Benchmarked 31% of residents are 75–84, compared to the Maryland average of 31%. This is the second most common age bracket in assisted living, representing residents with moderate care needs. |
56% Residents Age 85–94 — State Benchmarked 56% of residents are 85–94, compared to the Maryland average of 44%. A high concentration of very elderly residents signals a higher-acuity facility with experience caring for advanced age-related needs. |
10% Residents Age 95+ — State Benchmarked 10% of residents are 95 or older, compared to the Maryland average of 16%. Most residents here have not yet reached the oldest-old bracket, suggesting a younger overall community. |
| Assisted Living of Rockville II | AL | Rockville | 6
Facility
6
MD AVG
43
Rank
#410 / 697 | No |
57
Facility
57
MD AVG
43
Rank
#349 / 985 | Private Rooms | - | - | - | - | - | - | - | - | - | - | - |
Financial Assistance for
Assisted Living in Maryland
Assisted Living of Rockville II is located in Rockville, Maryland.
Here are the financial assistance programs available to residents in Maryland.
Frequently Asked Questions about Assisted Living of Rockville II
Is Assisted Living of Rockville II in a walkable area?
Assisted Living of Rockville II has a walk score of 57. Moderately walkable. Some errands can be accomplished on foot, with a mix of nearby amenities.
How many beds does Assisted Living of Rockville II have?
Assisted Living of Rockville II has 6 beds.
Are there photos of Assisted Living of Rockville II?
Yes — there are 17 photos of Assisted Living of Rockville II in the photo gallery on this page.
What is the address of Assisted Living of Rockville II?
Assisted Living of Rockville II is located at 13700 Parkland Drive, Rockville, MD 20853.
What is the phone number of Assisted Living of Rockville II?
(301) 356-3453 will put you in contact with the team at Assisted Living of Rockville II.
What county is Assisted Living of Rockville II located in?
Assisted Living of Rockville II is in Montgomery County.
Guides for Better Senior Living
Care Cost Calculator: See Prices in Your Area
Assisted Living Explorer
Don’t Wait Too Long: 7 Red Flag Signs Your Parent Needs Assisted Living Now
The True Cost of Assisted Living in 2025 – And How Families Are Paying For It
Understanding Senior Living Costs: Pricing Models, Discounts & Financial Assistance
Updated on
