HeartLands Senior Living at Ellicott City
Assisted Living, Independent Living & Respite Care · Ellicott City, MD
CMS overall rating Info CMS (the Centers for Medicare & Medicaid Services) is the federal agency that rates nursing home quality. Its Overall Rating runs from 1 to 5 stars, combining health inspections, staffing, and quality measures, with inspections weighted most heavily.

HeartLands Senior Living at Ellicott City

Assisted Living, Independent Living & Respite Care · Ellicott City, MD
CMS overall rating Info CMS (the Centers for Medicare & Medicaid Services) is the federal agency that rates nursing home quality. Its Overall Rating runs from 1 to 5 stars, combining health inspections, staffing, and quality measures, with inspections weighted most heavily.
Calculator: See prices in your area
HeartLands Senior Living at Ellicott City accepts Medicare, Medicaid, and private pay.

Overview of Heartlands Senior Living at Ellicott City

Heartlands Senior Living at Ellicott City operates as a skilled nursing facility in Ellicott City, Maryland, with certification for Medicare and Medicaid services. The facility is part of Discovery Senior Living’s portfolio of 45 senior living communities across multiple states. Located at 3004 North Ridge Road in Howard County, the operation has maintained licensed capacity for 182 beds and is currently serving residents at 87.8% occupancy, above the Maryland average; with an average length of stay of 103 days.

Nursing staff totals 27 registered nurses, 30 licensed practical nurses, and 64 certified nursing assistants among 174 total personnel. The facility provides 3 hours 27 minutes of nursing care per resident daily, below Maryland’s 4 hours 17 minutes standard. Contractor staffing represents 7% of total hours (3,896 hours quarterly), with specialists including physical therapy assistants, speech-language pathologists, respiratory therapy technicians, and qualified social workers supplementing core staff.

CMS assigns a 1-star overall rating, placing the facility 70.7% below Maryland average. Health inspection performance falls 68.8% below state benchmark. Quality measures register 7.2% above Maryland average for clinical outcomes including pressure ulcers, activities of daily living decline, walking ability, urinary tract infection rates, and depressive symptoms. The facility achieved pneumococcal vaccine administration at 99.7% of long-stay residents, and antipsychotic use at 7.8%, favorably below Maryland average of 12.9%.

Between September 2019 and November 2025, the facility accumulated 104 health citations: 1 critical, 2 serious, 101 moderate. Deficiencies concentrated in resident rights (24), quality of life/care (23), administration (8), abuse/neglect (8), and pharmacy services (7). No federal civil money penalties were assessed in the three-year review period. Complaint investigations from March 2025 through June 2025 identified systemic issues in resident dignity, environmental maintenance, care planning, activities of daily living assistance, medical records accuracy, and infection control practices.

Fiscal year 2024 generated $27.4 million gross revenue with net operating loss of $1.8 million and -6.4% profit margin. Payroll comprised $11.9 million (43.6% of revenue), ranked 31st statewide in total investment but 78th in payroll percentage. Payer mix reflects Medicaid dominance at 78.8%, private pay at 12.0%, and Medicare at 9.1%.

The facility accommodates mixed-stay residents through skilled nursing, independent living, and respite care service lines.

Dining emphasizes restaurant-style preparation with executive chef direction. Programs include recreational activities, exercise, beauty services, transportation, and housekeeping.

The car-dependent neighborhood (walk score 14) necessitates facility-provided transportation for community access.

Heartlands Senior Living at Ellicott City provides skilled nursing services within a mixed-pay model, sustained by substantial staffing investment but facing quality and efficiency performance gaps relative to Maryland standards and a persistent operating deficit.

(410) 461-9494

Quality ratings

Measured by Centers for Medicare & Medicaid Services (CMS)

Overall rating Info The Overall CMS Rating combines results from health inspections, staffing levels and quality measures. Health inspections carry the most weight. Staffing and quality scores can increase or decrease the final rating based on performance compared to state and national standards.
▼ 70.7% Below MD avg. ▼ 70.7% Below MD avg.Click the badge to see the full State ranking.Click here to see the full State ranking.
Health Inspection Info Based on the results of the facility's three most recent standard inspections and any complaint investigations. CMS reviews the number, scope, and severity of deficiencies, with more recent findings weighted more heavily.
▼ 68.8% Below MD avg. ▼ 68.8% Below MD avg.Click the badge to see the full State ranking.Click here to see the full State ranking.
Staffing Info Measures average nursing staff hours per resident per day, including Registered Nurses (RNs) and total nursing staff. Ratings are adjusted based on the level of care residents require and are compared to state and national benchmarks.
▲ 13.0% Above MD avg. ▲ 13.0% Above MD avg.Click the badge to see the full State ranking.Click here to see the full State ranking.
Quality Measures Info Based on clinical and physical health indicators reported to CMS, such as hospital readmissions, falls, pressure ulcers, and improvements in mobility. These measures reflect how well residents' health needs are being managed.
▲ 7.2% Above MD avg. ▲ 7.2% Above MD avg.Click the badge to see the full State ranking.Click here to see the full State ranking.

Staffing hours breakdown

Info Daily nursing hours per resident by staff type, reported to CMS. Higher is generally better — compare this facility to state and national averages to see where staffing stands.

Hours per resident per day — compared to Maryland state averages

Total nursing care / resident Info This home is ranked 68th out of 144 homes in Maryland for nurse hours. Total adjusted nursing hours per resident per day, combining RN, LPN, and aide time. CMS adjusts this for case-mix so facilities can be fairly compared.
3h 27m per day
Rank #68 / 144Nurse hours — State benchmarkedThis home is ranked 68th out of 144 homes in Maryland for nurse hours. Shows adjusted nurse hours per resident per day benchmarked to the Maryland average, with a ranking across 144 Maryland SNFs. More hours mean more direct care. The national average is about 3.5 hrs; below 3.0 is a red flag.Click the rank badge to see the full State ranking.Click here to see the full State ranking.
This facility Maryland avg (4h 17m per day)
vs Maryland avg
-19%

5 of 6 metrics below state avg

Standout metric LPN / LVN is +11% above state avg
Staff typeHours / Day / Residentvs state avg
Registered Nurse (RN) Info RNs hold the highest nursing license and can assess residents, interpret test results, and direct care plans. More RN hours per day often signals stronger clinical oversight and faster response to health changes. 40m per day ▼ 19% State avg: 49m per day · National avg: 41m per day
LPN / LVN Info Licensed Practical Nurses (LPNs) or Licensed Vocational Nurses (LVNs) deliver routine hands-on care — medication administration, wound dressing, and monitoring vital signs. They work under RN supervision and make up a large share of daily bedside care. 1h 1m per day ▲ 11% State avg: 55m per day · National avg: 52m per day
Nurse Aide Info Certified Nurse Aides (CNAs) provide the most direct day-to-day assistance: bathing, dressing, feeding, and mobility. Nurse aide hours are typically the largest staffing category and directly affect residents' quality of life. 1h 53m per day ▼ 12% State avg: 2h 8m per day · National avg: 2h 20m per day
Weekend Total Nursing Info Combined nursing hours (RN + LPN + Nurse Aide) per resident per day on weekends. Staffing often drops on weekends — this figure reveals whether the facility maintains adequate coverage outside of weekday hours. 3h 13m per day ▼ 8% State avg: 3h 31m per day · National avg: 3h 27m per day
Physical Therapist Info Hours per resident per day provided by licensed Physical Therapists (PTs) or PT Assistants. PT services help residents recover mobility after injury or illness and are especially important for post-acute (short-stay) rehabilitation. 3m per day ▼ 53% State avg: 6m per day · National avg: 4m per day
Weekend RN Info Registered nurse hours specifically on weekends. Facilities sometimes reduce RN presence on Saturdays and Sundays — a low weekend RN figure compared to weekday hours can indicate reduced clinical oversight when most administrative staff are absent. 26m per day ▼ 29% State avg: 37m per day · National avg: 29m per day

Capacity and availability

This home usually has limited availability

Higher occupancy than the Maryland average: 82.4%
Occupancy rate
87.8% Rank #55 / 146Occupancy rate — State benchmarkedThis home is ranked 55th out of 146 homes in Maryland for occupancy rate. Shows this facility's occupancy rate versus the Maryland average, with its Statewide rank out of 146. Higher occupancy signals strong local demand and financial stability.Click the rank badge to see the full State ranking.Click here to see the full State ranking.
Avg. Length of Stay
103 days
Years in operation
40 years in operation Rank #11 / 208Years in operation — State benchmarkedThis home is ranked 11th out of 208 homes in Maryland for years in operation. Shows how long this facility has been in operation compared to other Maryland SNFs. Longer operating histories may benefit residents, families, and staff.Click the rank badge to see the full State ranking.Click here to see the full State ranking.
A longer operating history, which may indicate experience navigating regulations and delivering ongoing care.
Walk Score
Walk Score: 14 / 100 Rank #788 / 985Walk Score — State benchmarkedThis home is ranked 788th out of 985 homes in Maryland for walk score. Shows how walkable this facility's neighborhood is compared to the average Walk Score across Maryland SNFs. Higher scores benefit residents, families, and staff.Click the rank badge to see the full State ranking.Click here to see the full State ranking.
Car-dependent. Most errands require a car, with limited nearby walkable options.

About this community

Staffing

Key information about the people who lead and staff this community.

Leadership

ContactMr. Clinton Thomas, Executive Director

Contact HeartLands Senior Living at Ellicott City

Inspection History

In Maryland, the Department of Health, Office of Health Care Quality is the state agency that conducts unannounced inspections and issues reports for all assisted living and nursing facilities.

Since 2019 · 7 years of data 94 citations 6 inspections

Inspection Scorecard Info This scorecard compares key inspection, citation, and complaint metrics at this facility against the Maryland state average. Metrics rated ≥15% worse than average are highlighted in red; those ≥15% better are highlighted in green.

Since 2019 vs. Maryland state average
Overall vs. MD average 4 Worse Metrics worse than Maryland average:
• Total citations (2250% above)
• Citations per year (2133% above)
• Citations per inspection (1863% above)
• Total inspections (20% above)
0 Better No metrics in this bucket.
Latest Inspection November 4, 2025 Complaint Investigation

Citations Info Citations are formal regulatory issues recorded during state inspections.

This FacilityMD Averagevs. MD Avg
Total citations Info Formal regulatory issues recorded by inspectors across all inspection types. 944 This facility has 2250% more total citations than a typical Maryland assisted living residence (94 vs. MD avg 4).↑ 2250% worse
Citations per year Info Average citations per year since 2019. 13.40.6 This facility has 2133% more citations per year than a typical Maryland assisted living residence (13.4 vs. MD avg 0.6).↑ 2133% worse
Citations per inspection Info Average citations per inspection. 15.70.8 This facility has 1863% more citations per inspection than a typical Maryland assisted living residence (15.7 vs. MD avg 0.8).↑ 1863% worse

Inspections Info State inspections evaluate whether the facility meets health and safety standards.

This FacilityMD Averagevs. MD Avg
Total inspections Info Combined count of all routine and focused inspections. Excludes complaint investigations. 65 This facility has 20% more total inspections than a typical Maryland assisted living residence (6 vs. MD avg 5).↑ 20% worse

Health Inspection History

Inspections since 2022
Total health inspections 6

Maryland average 3.9


Last Health inspection on Nov 2025

Total health citations
104 Rank #138 / 146Health citations — State benchmarkedThis home is ranked 138th out of 146 homes in Maryland for health citations. Shows this facility's total health deficiency citations benchmarked to the Maryland State average, with a ranking across all 146 MD SNFs. Lower citation counts earn a better rank.Click the rank badge to see the full State ranking.Click here to see the full State ranking.

Maryland average 49.9

Citations per inspection
17.33 Rank #119 / 146Citations per inspection — State benchmarkedThis home is ranked 119th out of 146 homes in Maryland for citations per inspection. Shows average deficiency citations per CMS inspection for this facility versus the Maryland mean across 146 SNFs with citation data. Lower is better.Click the rank badge to see the full State ranking.Click here to see the full State ranking.

Maryland average 12.81


Health citations are formal notices following inspections when they fail to comply with safety and care standards.

60 of 104 citations resulted from standard inspections; 20 of 104 resulted from complaint investigations; and 24 of 104 came from combined inspections (standard and complaint).

Breakdown of citation severity (last 4 years)
Critical health citations
1
100% worse than Maryland average

Maryland average: 0.5


Serious health citations
2
233% worse than Maryland average

Maryland average: 0.6

1 critical citation Maryland average: 0.5

2 serious citations Maryland average: 0.6

101 moderate citations Maryland average: 47.2

0 minor citations Maryland average: 1.7
Citations history (last 4 years)
Nutrition moderate citation Nov 04, 2025

Quality of Care moderate citation Nov 04, 2025

Care Planning moderate citation Nov 04, 2025

Abuse/Neglect moderate citation Jun 27, 2025
Corrected

Staffing Data

Reporting period: October 1 – December 31, 2025 (Q4 2025). Source: CMS Payroll-Based Journal report.

Total staff 174
Employees 143
Contractors 31
Staff to resident ratio 1.08 : 1
40% fewer staff per resident than Maryland average
Maryland average ratio: 1.81 : 1 Maryland average ratio: 1.81 : 1See full Maryland ranking
Avg staff/day 74
Average shift 8.1 hours
0% compared with Maryland average
Maryland average: 8 hours Maryland average shift: 8 hoursSee full Maryland ranking
Total staff hours (quarter) 55,309

Nursing staff breakdown

Q4 2025 · Oct 1 – Dec 31 More info This data comes from the CMS Payroll-Based Journal report covering October 1 – December 31, 2025.
Registered Nurse

Manages medical care and health needs.

RN Staff Info 27 total: 23 full-time employees and 4 contractors. 27
Average shift length Info Average shift length. Calculated as total hours divided by days worked and average staff per day. 8.3 hours
Licensed Practical Nurse

Assists with medical care and medications.

LPN Staff Info All 30 LPN Staff are full-time employees. No contractors work on this role. 30
Average shift length Info Average shift length. Calculated as total hours divided by days worked and average staff per day. 9 hours
Certified Nursing Assistant

Helps with daily care and mobility.

CNA Staff Info All 64 CNA Staff are full-time employees. No contractors work on this role. 64
Average shift length Info Average shift length. Calculated as total hours divided by days worked and average staff per day. 7.8 hours

Contractor staffing

Q4 2025 · Oct 1 – Dec 31 More info This data comes from the CMS Payroll-Based Journal report covering October 1 – December 31, 2025.

Total hours from contractors

7%

3,896 contractor hours this quarter

Physical Therapy Assistant: 6 Speech Language Pathologist: 5 Physical Therapy Aide: 5 Respiratory Therapy Technician: 5 Registered Nurse: 4 Qualified Social Worker: 4 Qualified Activities Professional: 1 Medical Director: 1

Staff by category

Q4 2025 · Oct 1 – Dec 31 More info This data comes from the CMS Payroll-Based Journal report covering October 1 – December 31, 2025.
Certified Nursing Assistant6406424,55092100%7.8
Licensed Practical Nurse3003013,18792100%9
Registered Nurse234277,23892100%8.3
Other Dietary Services Staff3031,4379199%7.6
Clinical Nurse Specialist8081,2496571%8.1
Speech Language Pathologist0551,1737480%7.4
Medication Aide/Technician4049668491%9.7
Physical Therapy Aide0558917683%7.3
Respiratory Therapy Technician0556207076%7
Mental Health Service Worker1015206571%8
Dental Services Staff2025066065%8.3
Administrator1014966267%8
Nurse Practitioner1014966267%8
RN Director of Nursing1014685560%8.5
Occupational Therapy Aide1014635762%8.1
Physical Therapy Assistant0663735560%6.1
Dietitian1013604549%8
Qualified Activities Professional0111432022%7.2
Occupational Therapy Assistant1017089%8.8
Medical Director011543437%1.6
Qualified Social Worker0444078%4.4
Nurse Aide in Training101811%8.3
Diagnostic X-ray Services Staff101411%4
64 Certified Nursing Assistant
% of Days 100%
30 Licensed Practical Nurse
% of Days 100%
27 Registered Nurse
% of Days 100%
3 Other Dietary Services Staff
% of Days 99%
8 Clinical Nurse Specialist
% of Days 71%
5 Speech Language Pathologist
% of Days 80%
4 Medication Aide/Technician
% of Days 91%
5 Physical Therapy Aide
% of Days 83%
5 Respiratory Therapy Technician
% of Days 76%
1 Mental Health Service Worker
% of Days 71%
2 Dental Services Staff
% of Days 65%
1 Administrator
% of Days 67%
1 Nurse Practitioner
% of Days 67%
1 RN Director of Nursing
% of Days 60%
1 Occupational Therapy Aide
% of Days 62%
6 Physical Therapy Assistant
% of Days 60%
1 Dietitian
% of Days 49%
1 Qualified Activities Professional
% of Days 22%
1 Occupational Therapy Assistant
% of Days 9%
1 Medical Director
% of Days 37%
4 Qualified Social Worker
% of Days 8%
1 Nurse Aide in Training
% of Days 1%
1 Diagnostic X-ray Services Staff
% of Days 1%

Penalties and fines

Federal penalties imposed by CMS for regulatory violations, including civil money penalties (fines) and denials of payment for new Medicare/Medicaid admissions.

Source: CMS Penalties Database

No penalties in the past 3 years

No civil money penalties or payment denials were reported in the last 3 years.

Quality of care over time

These measures show how residents usually do over time at this home, based on health outcomes and preventive care.

High-risk clinical events score Info A composite score based on pressure ulcers, falls with injury, weight loss, walking ability decline, and activities of daily living decline. 12.6
In line with Maryland average

Maryland average: 12.9

Functional decline score Info A composite score based on activities of daily living decline, walking ability decline, and incontinence. 25.2
In line with Maryland average

Maryland average: 25.7

Long-stay resident measures
Need for Help with Daily Activities Increased Info Percent of long-stay residents whose need for help with daily activities has increased 21.9%
8% better than Maryland average

Maryland average: 23.7%

Walking Ability Worsened Info Percent of long-stay residents whose ability to move independently worsened 26.4%
5% better than Maryland average

Maryland average: 27.7%

Low Risk Residents with Bowel/Bladder Incontinence Info Percent of low risk long-stay residents who lose control of their bowels or bladder 27.3%
5% worse than Maryland average

Maryland average: 25.9%

Falls with Major Injury Info Percent of long-stay residents experiencing one or more falls with major injury 2.7%
20% worse than Maryland average

Maryland average: 2.3%

High Risk Residents with Pressure Ulcers Info Percent of long-stay high risk residents with pressure ulcers 5.8%
10% better than Maryland average

Maryland average: 6.5%

Urinary Tract Infection Info Percent of long-stay residents with a urinary tract infection 0.3%
79% better than Maryland average

Maryland average: 1.6%

Lost Too Much Weight Info Percent of long-stay residents who lose too much weight 6.2%
7% worse than Maryland average

Maryland average: 5.8%

Depressive Symptoms Info Percent of long-stay residents who have depressive symptoms 5.0%
75% better than Maryland average

Maryland average: 20.2%

Antipsychotic Use Info Percent of long-stay residents who received an antipsychotic medication 7.8%
40% better than Maryland average

Maryland average: 12.9%

Pneumococcal Vaccine Info Percent of long-stay residents assessed and appropriately given the pneumococcal vaccine 99.7%
8% better than Maryland average

Maryland average: 92.0%

Influenza Vaccine Info Percent of long-stay residents assessed and appropriately given the seasonal influenza vaccine 98.8%
In line with Maryland average

Maryland average: 96.6%

Short-stay resident measures
Pneumococcal Vaccine Info Percent of short-stay residents assessed and appropriately given the pneumococcal vaccine 81.2%
In line with Maryland average

Maryland average: 78.4%

Antipsychotic medication increase Info Percent of short-stay residents who newly received an antipsychotic medication 0.3%
76% better than Maryland average

Maryland average: 1.4%

Influenza Vaccine Info Percent of short-stay residents assessed and appropriately given the seasonal influenza vaccine 85.6%
6% better than Maryland average

Maryland average: 80.6%

Breakdown by payment type

Medicare

29% of new residents, usually for short-term rehab.

Typical stay 1 months

Private pay

39% of new residents, often for short stays.

Typical stay 1 months

Medicaid

32% of new residents, often for long-term daily care.

Typical stay 8 - 9 months

Facility Characteristics

Source: CMS Long-Term Care Facility Characteristics (Data as of Jan 2026)

Total residents 161
Medicare
7
4.3% of residents
Medicaid
134
83.2% of residents
Private pay or other
20
12.4% of residents
Programs & Services
Residents Group

Residents meet regularly to discuss policies, care quality, and activities

Active Resident Council

Organized group of residents that meets regularly to discuss facility policies, quality of life, and activities.

Finances and operations

Voluntary non-profit community
Operated by a church.
Home revenue
$27.4M
Operating deficit
-$1.8M
Voluntary non-profit community Operated by a church.
Home revenue
$27.4M Rank #34 / 145Revenue — State benchmarkedThis home is ranked 34th out of 145 homes in Maryland for revenue. Shows this facility's annual revenue compared to the Maryland SNF average. Higher revenue generally means more resources for staffing and capital — read alongside Payroll %.Click the rank badge to see the full State ranking.Click here to see the full State ranking.
Operating deficit
-$1.8M
Payroll costs Info The portion of the home's budget spent on staff, including nurses, caregivers, and other employees who support care and operations. Rank #31 / 145Payroll — State benchmarkedThis home is ranked 31st out of 145 homes in Maryland for payroll. Shows total annual staff payroll benchmarked to the Maryland average. Higher payroll investment relative to peers often signals better staffing and less reliance on cheaper contract labor.Click the rank badge to see the full State ranking.Click here to see the full State ranking.
$11.9M
43.6% of revenue Rank #78 / 145Payroll % — State benchmarkedThis home is ranked 78th out of 145 homes in Maryland for payroll %. Shows payroll as a percentage of revenue versus the Maryland average. Well-run Maryland SNFs typically land around 49–57% — the top third Statewide. Below 25% may signal understaffing or heavy agency use — read with Staffing ratings.Click the rank badge to see the full State ranking.Click here to see the full State ranking.
Other operating costs Info All remaining costs needed to run the home, such as food, utilities, building maintenance, supplies and administrative expenses.
$17.2M
Total costs $29.1M

What does this home offer?

Pets allowed icon
Pets allowed icon

Pets Allowed

Housing options icon

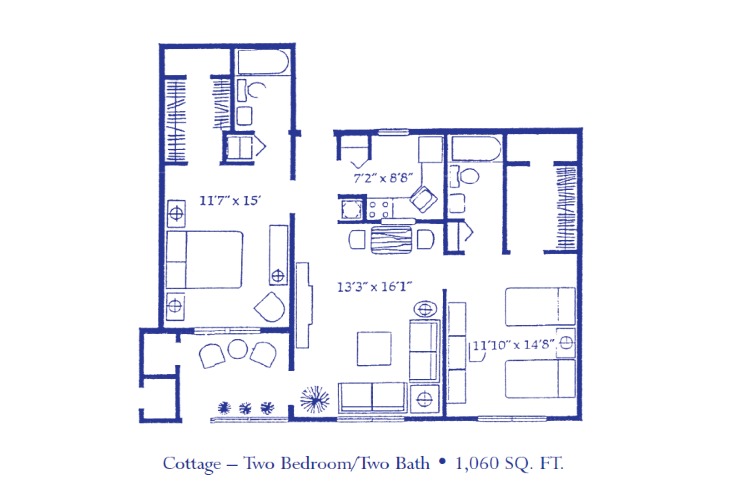
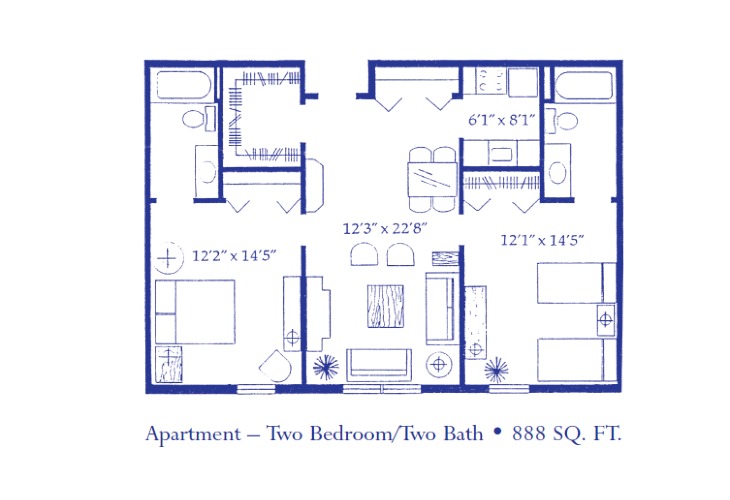
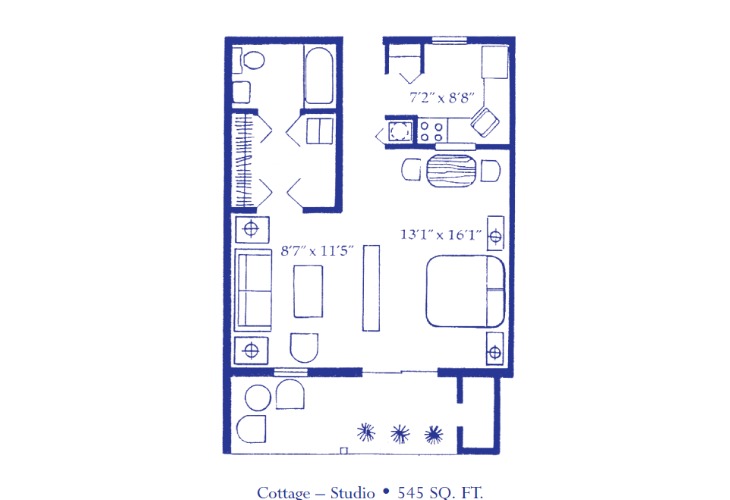
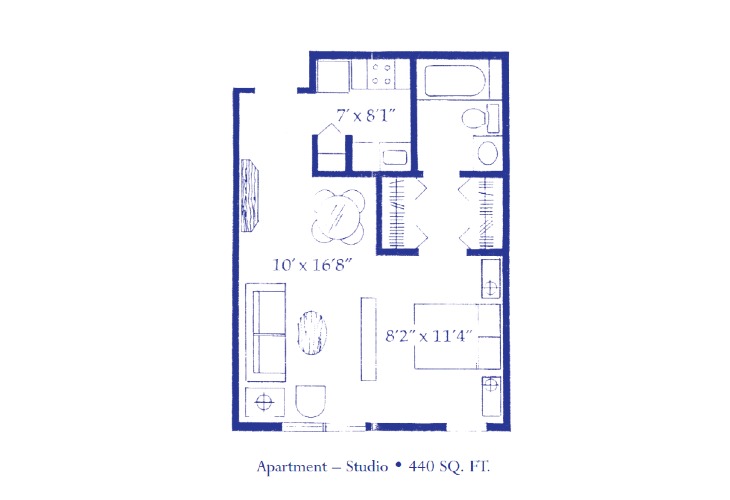
Housing Options: Studio / 1 Bed / 2 Bed

Building type icon
Building type icon

Building Type: Single-story

Beauty services icon

Beauty Services

Transportation services icon

Transportation Services

Housekeeping icon
Housekeeping icon

Housekeeping Services

Recreational activities icon

Recreational Activities

Exercise program icon

Exercise Programs

Who this home usually serves

TYPE OF STAY

Mix of rehab and long-term care

This home supports both short-term rehab and long-term care, with residents staying for a wide range of durations.

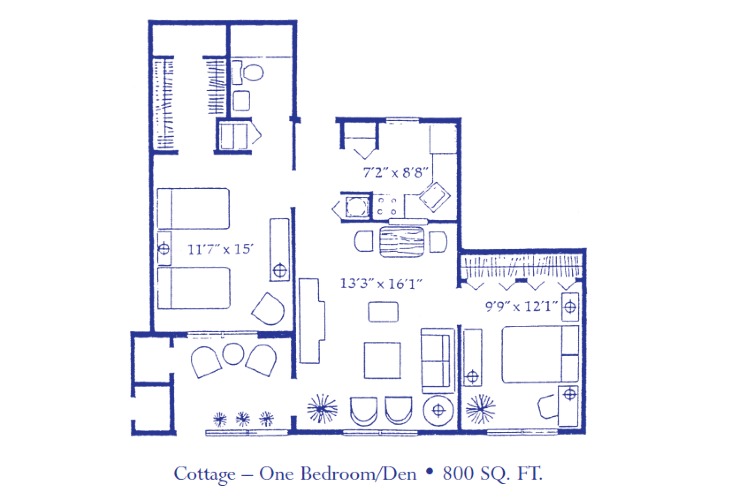
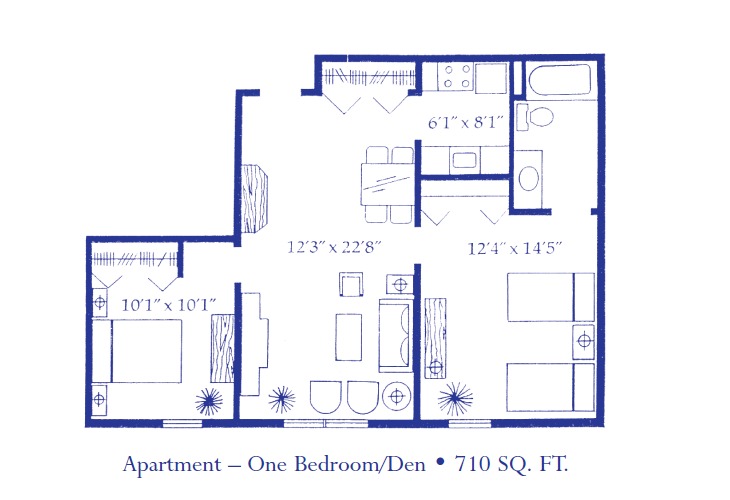
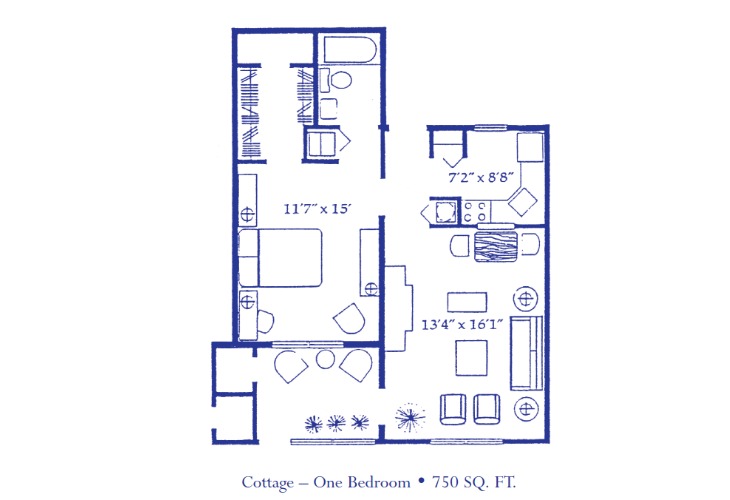
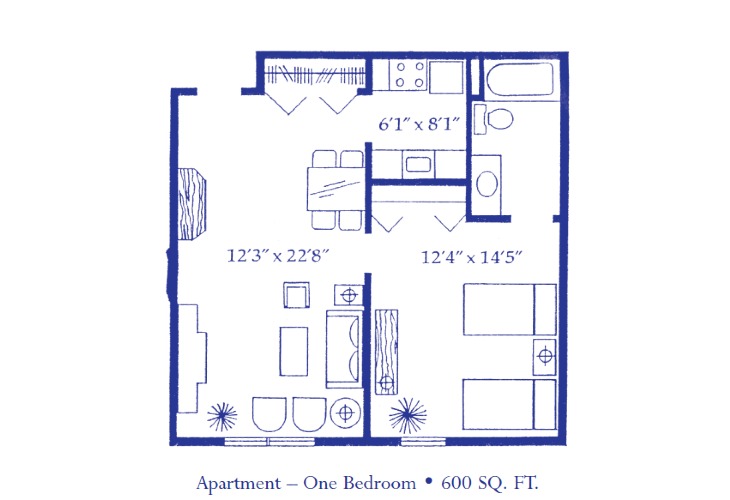
Living Spaces & Floor Plans for HeartLands Senior Living at Ellicott City

Heartlands Ellicott City Il Two 1
Heartlands Ellicott City Il Two
Heartlands Ellicott City Il One 2
Heartlands Ellicott City Il One 1
Heartlands Ellicott City Il One
Heartlands Ellicott City Il Apar
Heartlands Ellicott City Il Stud 1
Heartlands Ellicott City Il Stud

Places of interest near HeartLands Senior Living at Ellicott City

Address 2.8 miles from city center Info Estimated distance in miles from Ellicott City's city center to HeartLands Senior Living at Ellicott City's address, calculated via Google Maps.

Calculate Travel Distance to HeartLands Senior Living at Ellicott City

Add your location

Address

Financial Assistance for
Assisted Living in Maryland

HeartLands Senior Living at Ellicott City is located in Ellicott City, Maryland.
Here are the financial assistance programs available to residents in Maryland.

Get Financial aid guidance

Community Options Waiver

Maryland Medicaid Community Options Waiver

Age 65+ or disabled
General Maryland resident, Medicaid- eligible, nursing home-level care need.
Income Limits (2025) ~$2,829/month 300% FBR, individual
Asset Limits $2,000 (individual), $3,000 (couple) (excludes home, car).
MD

High urban demand; rural outreach efforts.

Benefits
Personal care (5-7 hours/day, e.g., bathing, dressing) Respite care (up to 240 hours/year) Adult day care ($70/day) Home modifications ($1,500 avg.)

Senior Care Program

Maryland Senior Care

Age 65+
General Maryland resident, at risk of nursing home placement.
Income Limits ~$2,000/month individual, varies by county
Asset Limits $11,000 individual
MD

Limited funding; waitlists common in high-demand areas.

Benefits
In-home care (3-5 hours/week) Respite care (up to 10 days/year) Meals (~$6/meal) Transportation (~5 trips/month) Case management

Maryland Nursing Home Medicaid

Maryland Medical Assistance (Medicaid) Nursing Home Program

Age 65+
General Maryland resident, Medicaid-eligible, requires nursing home-level care.
Income Limits (2025) $943/month (individual); most income applied to care costs.
Asset Limits $2,500 (individual), $3,000 (couple); spousal protections up to $155,356.
MD

Home equity limit $636,000; estate recovery applies post-55.

Benefits
24/7 nursing care Meals Therapy Medications (unlimited per medical need)

Senior Assisted Living Subsidy Program

Maryland Senior Assisted Living Group Home Subsidy

Age 62+
General Maryland resident, in or moving to approved assisted living, low/moderate income.
Income Limits (2025) ~$34,000/year individual, varies by county
Asset Limits Not strict; prioritizes low-income.
MD

Not available statewide; facility must be licensed by MDH.

Benefits
Personal care Meals 24-hour supervision (up to $1,500/month subsidy typical)

Veterans Aid and Attendance (A&A) Benefit

Maryland VA Aid and Attendance

Age
General Wartime veteran/spouse, age 65+ or disabled, needs ADL help, Maryland resident.
Income Limits (2025) Net income minus medical expenses < $1,984/month individual with A&A
Asset Limits $155,356 net worth limit
MD

High veteran population in suburban/rural areas.

Benefits
Cash benefit ($1,478-$2,471/month, varies by status) for care costs

Senior Prescription Drug Assistance Program (SPDAP)

Maryland Senior Prescription Drug Assistance Program

Age 65+
General Maryland resident (6+ months), Medicare Part D enrolled.
Income Limits (2025) $48,560/year individual, 300% FPL
Asset Limits None specified.
MD

Supplements Medicare Part D; annual enrollment required.

Benefits
Up to $40/month premium subsidy Reducing drug costs

Medicare Savings Programs (MSP)

Maryland Medicare Savings Programs

Age 65+
General Maryland resident, Medicare Part A/B enrollee.
Income Limits (2025) $2,014/month (QMB), $2,706/month (SLMB/QI, individual).
Asset Limits $9,090 (individual), $13,630 (couple).
MD

Includes QMB, SLMB, QI categories.

Benefits
Covers premiums (up to $174.70/month Part B) Co-pays Deductibles

Community Personal Assistance Services (CPAS)

Maryland Medicaid Community Personal Assistance Services

Age 65+
General Maryland resident, Medicaid-eligible, needs ADL assistance.
Income Limits (2025) $943/month (individual); spend-down available.
Asset Limits $2,500 (individual), $3,000 (couple).
MD

Consumer-directed option allows hiring family caregivers.

Benefits
Personal care (hours vary, typically 20-30/week) Chores Nurse supervision

More homes from the same operator

Frequently Asked Questions about HeartLands Senior Living at Ellicott City

What neighborhood is HeartLands Senior Living at Ellicott City in?

HeartLands Senior Living at Ellicott City is in the Plum Tree neighborhood of Ellicott City.

Is HeartLands Senior Living at Ellicott City in a walkable area?

HeartLands Senior Living at Ellicott City has a walk score of 14. Car-dependent. Most errands require a car, with limited nearby walkable options.

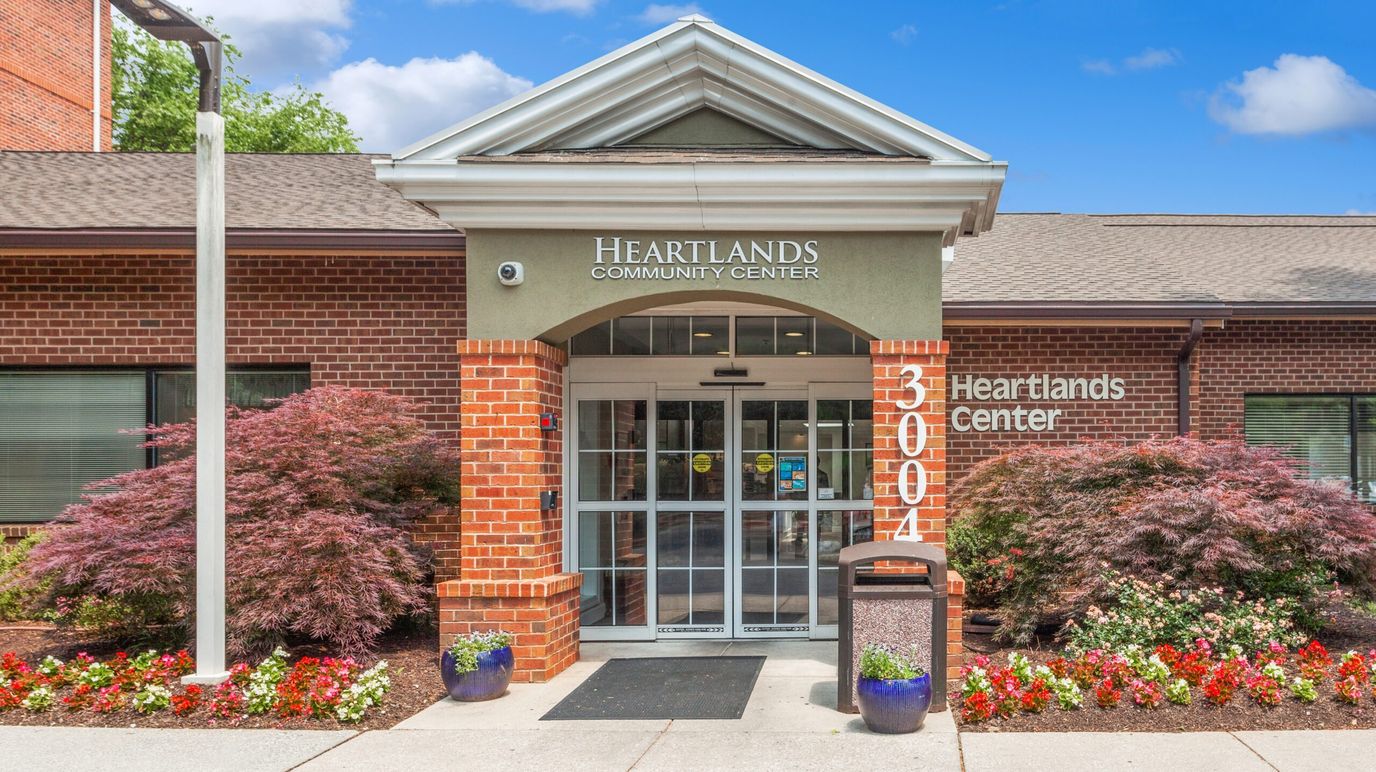
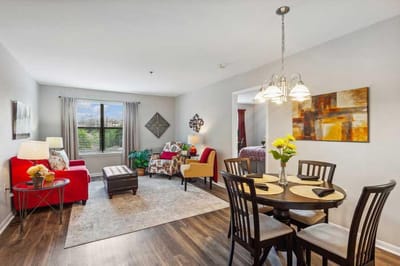
Are there photos of HeartLands Senior Living at Ellicott City?

Yes — there are 5 photos of HeartLands Senior Living at Ellicott City in the photo gallery on this page.

What is the address of HeartLands Senior Living at Ellicott City?

HeartLands Senior Living at Ellicott City is located at 3004 N Ridge Rd, Ellicott City, MD 21043, United States.

What is the phone number of HeartLands Senior Living at Ellicott City?

(410) 461-9494 will put you in contact with the team at HeartLands Senior Living at Ellicott City.

Is HeartLands Senior Living at Ellicott City Medicare or Medicaid certified?

Yes — HeartLands Senior Living at Ellicott City is a CMS-certified provider of Medicare and Medicaid.

Guides for Better Senior Living

Care Cost Calculator: See Prices in Your Area

Nursing Home Data Explorer

Don’t Wait Too Long: 7 Red Flag Signs Your Parent Needs Assisted Living Now

The True Cost of Assisted Living in 2025 – And How Families Are Paying For It

Understanding Senior Living Costs: Pricing Models, Discounts & Financial Assistance

Explore Open Rooms
1 Contact details
2 What type of senior care service are you looking for?
3 What budget do you have in mind for senior care?
4 How soon do you need to find care?
5 Additional details

Thank you for your interest!

Our team will be in touch shortly to help with next steps.