


Total staff
133
Employees
133
Contractors
0
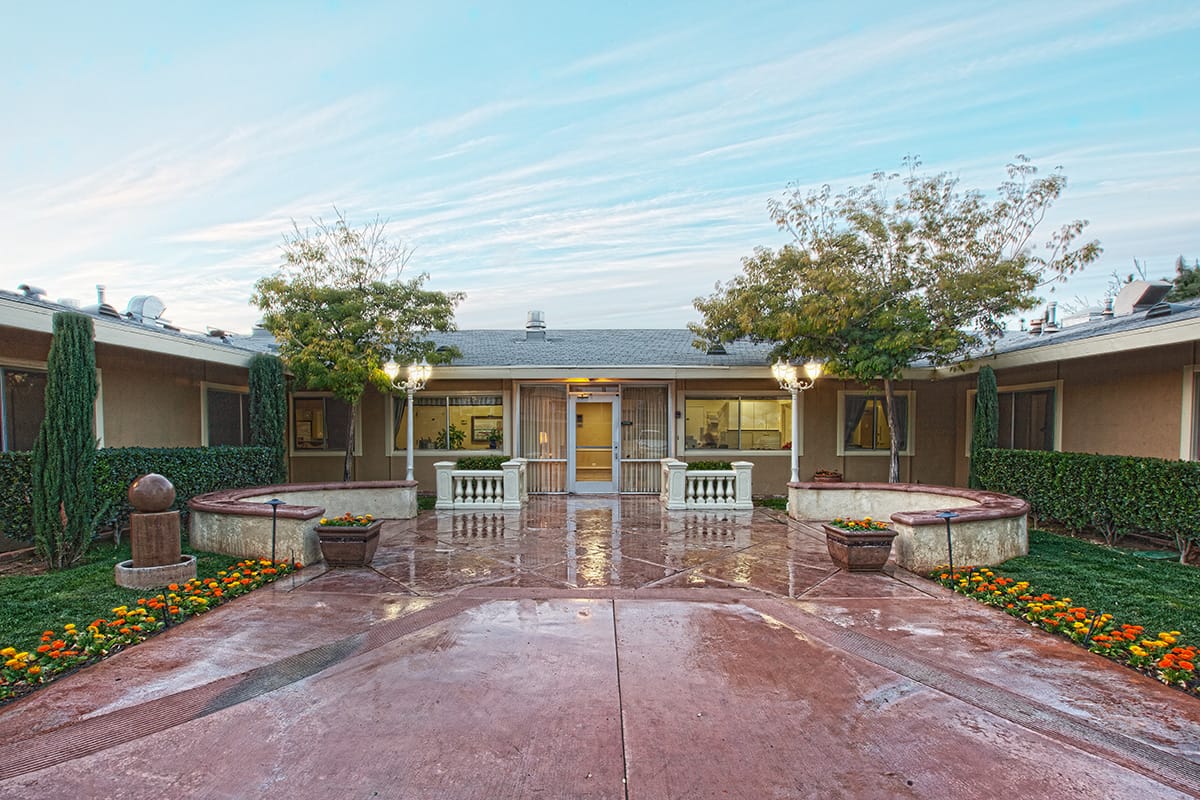
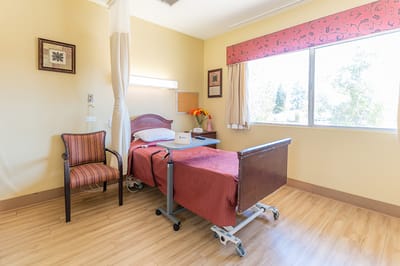
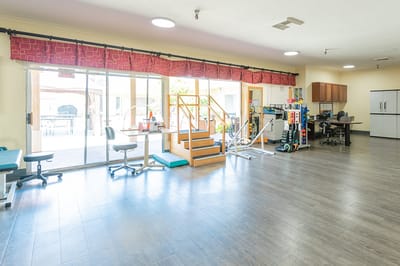
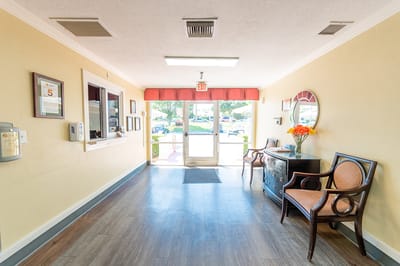
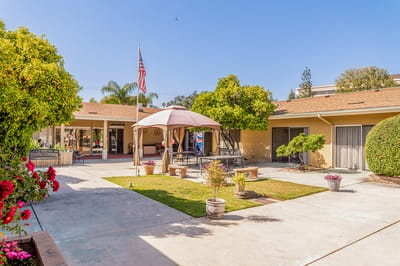
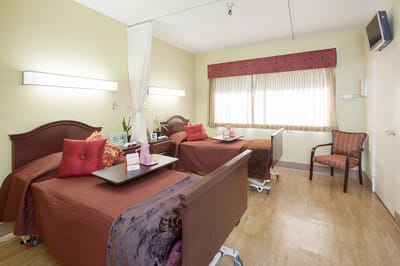
Ideally situated near Redlands Community Hospital on West Fern Avenue, Redlands, CA, Redlands Healthcare Center is a distinct community that offers therapy and restorative nursing programs. Committed to improving residents’ well-being, the community provides exceptional care and support 24/7 for their comfort and convenience. Alongside a cozy and nurturing environment, beautifully designed and spacious accommodations are also provided so residents can easily adapt to their surroundings.
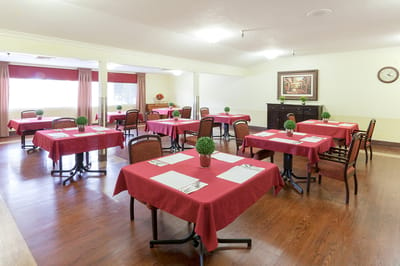
Fun activities and enriching programs are also conducted to keep residents active and socially engaged. Healthy meals are important for residents’ wellness, so delightful and nutritious meals are served to satisfy dietary needs and preferences. Find the care you need for a worry-free retirement with the community’s top-notch care and state-of-the-art amenities.
| Staff type | Hours / Day / Resident | vs state avg |
|---|---|---|
|
Registered Nurse (RN)
| 27m per day | ▼ 31% State avg: 39m per day · National avg: 41m per day |
|
LPN / LVN
| 1h 13m per day | ■ Avg State avg: 1h 13m per day · National avg: 52m per day |
|
Nurse Aide
| 2h 34m per day | ▼ 3% State avg: 2h 39m per day · National avg: 2h 21m per day |
|
Weekend Total Nursing
| 3h 50m per day | ▼ 6% State avg: 4h 5m per day · National avg: 3h 26m per day |
|
Physical Therapist
| 7m per day | ▲ 36% State avg: 5m per day · National avg: 4m per day |
|
Weekend RN
| 17m per day | ▼ 42% State avg: 30m per day · National avg: 29m per day |
Reporting period: October 1 – December 31, 2025 (Q4 2025). Source: CMS Payroll-Based Journal report.
Manages medical care and health needs.
Assists with medical care and medications.
Helps with daily care and mobility.
| Certified Nursing Assistant | 69 | 0 | 69 | 16,967 | 92 | 100% | 7.3 |
| Licensed Practical Nurse | 24 | 0 | 24 | 7,070 | 92 | 100% | 7.5 |
| Speech Language Pathologist | 7 | 0 | 7 | 2,011 | 69 | 75% | 7.1 |
| Registered Nurse | 6 | 0 | 6 | 1,809 | 92 | 100% | 7.5 |
| Physical Therapy Aide | 4 | 0 | 4 | 1,077 | 66 | 72% | 7 |
| RN Director of Nursing | 3 | 0 | 3 | 949 | 79 | 86% | 6.9 |
| Dental Services Staff | 2 | 0 | 2 | 903 | 62 | 67% | 7.6 |
| Respiratory Therapy Technician | 6 | 0 | 6 | 747 | 70 | 76% | 5.8 |
| Clinical Nurse Specialist | 2 | 0 | 2 | 630 | 65 | 71% | 7.9 |
| Qualified Activities Professional | 2 | 0 | 2 | 526 | 64 | 70% | 7.8 |
| Nurse Practitioner | 1 | 0 | 1 | 512 | 64 | 70% | 8 |
| Other Dietary Services Staff | 1 | 0 | 1 | 500 | 64 | 70% | 7.8 |
| Dietitian | 1 | 0 | 1 | 492 | 64 | 70% | 7.7 |
| Administrator | 1 | 0 | 1 | 256 | 64 | 70% | 4 |
| Physical Therapy Assistant | 3 | 0 | 3 | 186 | 21 | 23% | 6.4 |
| Qualified Social Worker | 1 | 0 | 1 | 68 | 19 | 21% | 3.6 |
Federal penalties imposed by CMS for regulatory violations, including civil money penalties (fines) and denials of payment for new Medicare/Medicaid admissions.
Source: CMS Penalties Database
No penalties in the past 3 years
No civil money penalties or payment denials were reported in the last 3 years.
These measures show how residents usually do over time at this home, based on health outcomes and preventive care.
California average: 6.6
California average: 11.3
California average: 11.1%
California average: 12.0%
California average: 11.3%
California average: 1.7%
California average: 5.0%
California average: 1.2%
California average: 4.2%
California average: 6.7%
California average: 10.1%
California average: 98.5%
California average: 98.2%
California average: 2.25
California average: 1.59
California average: 94.0%
California average: 1.5%
California average: 93.2%
California average: 23.2%
California average: 11.2%
California average: 0.8%
California average: 53.7%
California average: 50.6%
Quality measures are calculated from Minimum Data Set (MDS) assessments. For most measures, lower percentages indicate better care quality.
45% of new residents, usually for short-term rehab.
54% of new residents, often for short stays.
1% of new residents, often for long-term daily care.
Source: CMS Long-Term Care Facility Characteristics (Data as of Jan 2026)
Residents meet regularly to discuss policies, care quality, and activities
Organized group of residents that meets regularly to discuss facility policies, quality of life, and activities.
Data sourced from CMS Long-Term Care Facility Characteristics quarterly report. Payer mix reflects the current resident census by primary payment source.
Historical financial and operational data for Redlands Healthcare Center from 2012–2023, based on CMS SNF Cost Reports.
Key figures below are for fiscal year ending in 10/2023.
Based on CMS SNF Cost Report for fiscal year ending in 10/2023.
No pets allowed
Housing Options: Private / Shared Rooms
Building Type: Single-story
Beauty Services
Transportation Services
Housekeeping Services
Recreational Activities
Exercise Programs
This home supports both short-term rehab and long-term care, with residents staying for a wide range of durations.
Most new residents arrive under private pay (54% of admissions), and a typical private pay stay runs around 2 - 3 months.
Coverage residents most often arrive under.
Coverage residents most often leave under.
![]() 2.1 miles from city center
2.1 miles from city center
![]() Estimated distance in miles from Redlands's city center to Redlands Healthcare Center's address, calculated via Google Maps.
Estimated distance in miles from Redlands's city center to Redlands Healthcare Center's address, calculated via Google Maps.
Add your location
Info below is compiled from CMS reports & the CA Dept. of Social Services (CDSS), senior community websites & trusted data sources such as Walk Score & BBB.
Communities are listed from highest to lowest based on our ranking methodology.
| Highland Palms Healthcare Center | NH SNF | Highland (Cypress) | 99
Facility
99
CA AVG
104
Rank
#724 / 1644 |
91.1%
Facility
91.1%
CA AVG
73.9
Rank
#319 / 1492 | +23% | 3.17
Facility
3.17
CA AVG
4.22
Rank
#276 / 293 | -45% | -25% | $0
Facility
$0
CA AVG
$56.5k
Rank
#1 / 298 | - | 33
Facility
33
CA AVG
50.2
Rank
#115 / 293 | 3.7
Facility
3.7
CA AVG
4.6
Rank
#116 / 293 | - | 90 | A+ |
57
Facility
57
CA AVG
57
Rank
#1155 / 2087 | Sivakami Sivapalan | $18.5MFiscal year ending 12/2023
Facility
$18.5MFiscal year ending 12/2023
CA AVG
$17.0M
Rank
#72 / 295 | $8.2MFiscal year ending 12/2023
Facility
$8.2MFiscal year ending 12/2023
CA AVG
$7.0M
Rank
#159 / 295 | 44.2%Fiscal year ending 12/2023
Facility
44.2%Fiscal year ending 12/2023
CA AVG
45.2%
Rank
#282 / 295 | 56024 | ||||
| Arrowhead Springs Healthcare Center | NH MC SNF | San Bernardino (Perris Hills) | 119
Facility
119
CA AVG
104
Rank
#596 / 1644 |
92.1%
Facility
92.1%
CA AVG
73.9
Rank
#289 / 1492 | +25% | 4.56
Facility
4.56
CA AVG
4.22
Rank
#66 / 293 | -21% | +8% | $0
Facility
$0
CA AVG
$56.5k
Rank
#1 / 298 | - | 32
Facility
32
CA AVG
50.2
Rank
#107 / 293 | 3.6
Facility
3.6
CA AVG
4.6
Rank
#105 / 293 | - | 110 | - |
69
Facility
69
CA AVG
57
Rank
#767 / 2087 | Yamaliel Sanchez Gonzalez | $14.4MFiscal year ending 12/2023
Facility
$14.4MFiscal year ending 12/2023
CA AVG
$17.0M
Rank
#120 / 295 | $8.5MFiscal year ending 12/2023
Facility
$8.5MFiscal year ending 12/2023
CA AVG
$7.0M
Rank
#139 / 295 | 58.7%Fiscal year ending 12/2023
Facility
58.7%Fiscal year ending 12/2023
CA AVG
45.2%
Rank
#196 / 295 | 55708 | ||||
| Redlands Healthcare Center | NH AL HOS IL MC PC RC SNF | Redlands (South Redlands) | 78
Facility
78
CA AVG
104
Rank
#933 / 1644 |
92.3%
Facility
92.3%
CA AVG
73.9
Rank
#286 / 1492 | +25% | 3.11
Facility
3.11
CA AVG
4.22
Rank
#285 / 293 | -49% | -26% | $0
Facility
$0
CA AVG
$56.5k
Rank
#1 / 298 | - | 17
Facility
17
CA AVG
50.2
Rank
#23 / 293 | 4.3
Facility
4.3
CA AVG
4.6
Rank
#166 / 293 | - | 72 | - |
26
Facility
26
CA AVG
57
Rank
#1771 / 2087 | Shuang Bai | $14.9MFiscal year ending 10/2023
Facility
$14.9MFiscal year ending 10/2023
CA AVG
$17.0M
Rank
#140 / 295 | $6.8MFiscal year ending 10/2023
Facility
$6.8MFiscal year ending 10/2023
CA AVG
$7.0M
Rank
#203 / 295 | 45.8%Fiscal year ending 10/2023
Facility
45.8%Fiscal year ending 10/2023
CA AVG
45.2%
Rank
#243 / 295 | 55001 | ||||
| Grand Terrace Health Care Center | NH SNF | Grand Terrace | 59
Facility
59
CA AVG
104
Rank
#1084 / 1644 |
86.6%
Facility
86.6%
CA AVG
73.9
Rank
#423 / 1492 | +17% | 4.11
Facility
4.11
CA AVG
4.22
Rank
#134 / 293 | +12% | -3% | $0
Facility
$0
CA AVG
$56.5k
Rank
#1 / 298 | - | 30
Facility
30
CA AVG
50.2
Rank
#97 / 293 | 7.5
Facility
7.5
CA AVG
4.6
Rank
#278 / 293 | 1 | 51 | - |
67
Facility
67
CA AVG
57
Rank
#829 / 2087 | - | $10.2M*Fiscal year ending 12/2022These figures are from this home's most recent complete cost report — an older period than most facilities report. Compare with that in mind.
Facility
$10.2M*Fiscal year ending 12/2022These figures are from this home's most recent complete cost report — an older period than most facilities report. Compare with that in mind.
CA AVG
$17.0M
Rank
#187 / 295 | $4.3M*Fiscal year ending 12/2022These figures are from this home's most recent complete cost report — an older period than most facilities report. Compare with that in mind.
Facility
$4.3M*Fiscal year ending 12/2022These figures are from this home's most recent complete cost report — an older period than most facilities report. Compare with that in mind.
CA AVG
$7.0M
Rank
#275 / 295 | 42%*Fiscal year ending 12/2022These figures are from this home's most recent complete cost report — an older period than most facilities report. Compare with that in mind.
Facility
42%*Fiscal year ending 12/2022These figures are from this home's most recent complete cost report — an older period than most facilities report. Compare with that in mind.
CA AVG
45.2%
Rank
#287 / 295 | 55129 | ||||
| Valley Healthcare Center | NH AL HOS IL RC SNF | San Bernardino | 202
Facility
202
CA AVG
104
Rank
#149 / 1644 |
92.4%
Facility
92.4%
CA AVG
73.9
Rank
#281 / 1492 | +25% | 4.18
Facility
4.18
CA AVG
4.22
Rank
#116 / 293 | -16% | -1% | $0
Facility
$0
CA AVG
$56.5k
Rank
#1 / 298 | - | 45
Facility
45
CA AVG
50.2
Rank
#164 / 293 | 5.6
Facility
5.6
CA AVG
4.6
Rank
#234 / 293 | - | 187 | A+ |
60
Facility
60
CA AVG
57
Rank
#1048 / 2087 | Vale Holding Company LLC | $21.0MFiscal year ending 12/2023
Facility
$21.0MFiscal year ending 12/2023
CA AVG
$17.0M
Rank
#50 / 295 | $12.4MFiscal year ending 12/2023
Facility
$12.4MFiscal year ending 12/2023
CA AVG
$7.0M
Rank
#27 / 295 | 59.1%Fiscal year ending 12/2023
Facility
59.1%Fiscal year ending 12/2023
CA AVG
45.2%
Rank
#163 / 295 | 56389 |
Redlands Healthcare Center is located in Redlands, California.
Here are the financial assistance programs available to residents in California.
Redlands Healthcare Center is in the South Redlands neighborhood.
Redlands Healthcare Center has a walk score of 26. Somewhat walkable. A few nearby services may be reachable on foot, but most trips require transportation.
Redlands Healthcare Center's occupancy is 94.6%.
No, Redlands Healthcare Center has a no-pet policy.
Redlands Healthcare Center is registered as a for-profit.
Yes — there are 7 photos of Redlands Healthcare Center in the photo gallery on this page.
Redlands Healthcare Center is located at 1620 W Fern Ave, Redlands, CA 92373.
Care Cost Calculator: See Prices in Your Area
Nursing Home Data Explorer
Don’t Wait Too Long: 7 Red Flag Signs Your Parent Needs Assisted Living Now
The True Cost of Assisted Living in 2025 – And How Families Are Paying For It
Understanding Senior Living Costs: Pricing Models, Discounts & Financial Assistance


