Life Care Center of Orlando
CMS overall rating Info CMS (the Centers for Medicare & Medicaid Services) is the federal agency that rates nursing home quality. Its Overall Rating runs from 1 to 5 stars, combining health inspections, staffing, and quality measures, with inspections weighted most heavily.

Life Care Center of Orlando

CMS overall rating Info CMS (the Centers for Medicare & Medicaid Services) is the federal agency that rates nursing home quality. Its Overall Rating runs from 1 to 5 stars, combining health inspections, staffing, and quality measures, with inspections weighted most heavily.
Calculator: See prices in your area
Life Care Center of Orlando accepts Medicare, Medicaid, and private pay.

Overview of Life Care Center of Orlando

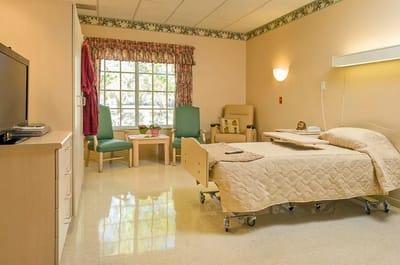
Life Care Center of Orlando is a remarkable facility that offers top-notch inpatient and outpatient rehabilitation services. They take a personalized approach to care and continuously strive to redefine senior healthcare standards by using innovative and cutting-edge techniques. The center has extensive experience in treating a wide range of diagnoses, and their team of dedicated and skilled therapists and nurses work diligently to ensure each resident receives the best possible care. They provide skilled nursing and long-term care, with a focus on rehabilitation that includes physical therapy, occupational therapy, and speech therapy.
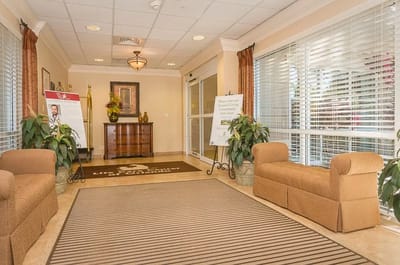
Residents can also enjoy a range of amenities, including state-of-the-art security and fire safety systems, a salon and barber, a dietitian, and internet access. The fine dining program is exceptional, with nutritious and delicious meals served every day. The center also provides bedside and bathroom call lights, a library, beautiful landscape grounds, housekeeping, and laundry services. Meanwhile, the flexible visiting hours ensure that residents can spend quality time with their loved ones in a comfortable and welcoming environment. Life Care Center of Orlando’s personalized approach to care and dedication to improving healthcare standards make them a top choice in the region.

(407) 831-3446

Quality ratings

Measured by Centers for Medicare & Medicaid Services (CMS)

Overall rating Info The Overall CMS Rating combines results from health inspections, staffing levels and quality measures. Health inspections carry the most weight. Staffing and quality scores can increase or decrease the final rating based on performance compared to state and national standards.
▲ 26.0% Above FL avg. ▲ 26.0% Above FL avg.FL average: 3.2Click the badge to see the full State ranking.Click here to see the full State ranking.
Health Inspection Info Based on the results of the facility's three most recent standard inspections and any complaint investigations. CMS reviews the number, scope, and severity of deficiencies, with more recent findings weighted more heavily.
▲ 42.3% Above FL avg. ▲ 42.3% Above FL avg.FL average: 2.8Click the badge to see the full State ranking.Click here to see the full State ranking.
Staffing Info Measures average nursing staff hours per resident per day, including Registered Nurses (RNs) and total nursing staff. Ratings are adjusted based on the level of care residents require and are compared to state and national benchmarks.
▲ 18.2% Above FL avg. ▲ 18.2% Above FL avg.FL average: 3.4Click the badge to see the full State ranking.Click here to see the full State ranking.

Staffing hours breakdown

Info Daily nursing hours per resident by staff type, reported to CMS. Higher is generally better — compare this facility to state and national averages to see where staffing stands.

Hours per resident per day — compared to Florida state averages

Staff typeHours / Day / Residentvs state avg
Registered Nurse (RN) Info RNs hold the highest nursing license and can assess residents, interpret test results, and direct care plans. More RN hours per day often signals stronger clinical oversight and faster response to health changes. 36m per day ▼ 18% State avg: 44m per day · National avg: 41m per day
LPN / LVN Info Licensed Practical Nurses (LPNs) or Licensed Vocational Nurses (LVNs) deliver routine hands-on care — medication administration, wound dressing, and monitoring vital signs. They work under RN supervision and make up a large share of daily bedside care. 1h 37m per day ▲ 106% State avg: 47m per day · National avg: 52m per day
Nurse Aide Info Certified Nurse Aides (CNAs) provide the most direct day-to-day assistance: bathing, dressing, feeding, and mobility. Nurse aide hours are typically the largest staffing category and directly affect residents' quality of life. 3h 9m per day ▲ 35% State avg: 2h 20m per day · National avg: 2h 21m per day
Weekend Total Nursing Info Combined nursing hours (RN + LPN + Nurse Aide) per resident per day on weekends. Staffing often drops on weekends — this figure reveals whether the facility maintains adequate coverage outside of weekday hours. 4h 41m per day ▲ 33% State avg: 3h 31m per day · National avg: 3h 26m per day
Physical Therapist Info Hours per resident per day provided by licensed Physical Therapists (PTs) or PT Assistants. PT services help residents recover mobility after injury or illness and are especially important for post-acute (short-stay) rehabilitation. 20m per day ▲ 306% State avg: 5m per day · National avg: 4m per day
Weekend RN Info Registered nurse hours specifically on weekends. Facilities sometimes reduce RN presence on Saturdays and Sundays — a low weekend RN figure compared to weekday hours can indicate reduced clinical oversight when most administrative staff are absent. 17m per day ▼ 48% State avg: 32m per day · National avg: 29m per day

Capacity and availability

Avg. Length of Stay
41 days
Bed community size
132-bed community Rank #206 / 1074Bed count — State benchmarkedThis home is ranked 206th out of 1074 homes in Florida. Shows this facility's certified or reported bed count compared to other Florida facilities. Larger communities may offer more amenities, programs, and on-site services for residents and families.Rankings are based only on facilities in Florida that report data for that category. Facilities without available data are excluded from the ranking.Click the rank badge to see the full State ranking.Click here to see the full State ranking.
A larger shared setting that may offer more common spaces and organized community services.
Years in operation
50 years in operation
A longer operating history, which may indicate experience navigating regulations and delivering ongoing care.
Walk Score
Walk Score: 38 / 100 Rank #764 / 1486Walk Score — State benchmarkedThis home is ranked 764th out of 1486 homes in Florida. Shows how walkable this facility's neighborhood is compared to the average Walk Score across Florida facilities. Higher scores benefit residents, families, and staff.Rankings are based only on facilities in Florida that report data for that category. Facilities without available data are excluded from the ranking.Click the rank badge to see the full State ranking.Click here to see the full State ranking.
Somewhat walkable. A few nearby services may be reachable on foot, but most trips require transportation.

About this community

License Details

CMS Certification Number105974

Staffing

Key information about the people who lead and staff this community.

Leadership

ContactDavid Jones, Executive Director

Contact Life Care Center of Orlando

Inspection History

In Florida, the Agency for Health Care Administration (AHCA) is the primary authority that conducts unannounced inspections and completes official health quality reports for all healthcare facilities.

Since 2019 · 7 years of data 14 citations
We don't publish a score for nursing homes with fewer than three inspections on record. This would unfairly reward providers with limited inspection history or those that have not been operating long enough to be cited.

Inspection score unavailable

Not enough inspection history to generate a score.

Average score for Florida nursing homes: B 83/100

Inspection score not available. Not enough inspection history to score against the Florida benchmark.

Inspection Scorecard Info This scorecard compares key inspection, citation, and complaint metrics at this facility against the Florida state average. Metrics rated ≥15% worse than average are highlighted in red; those ≥15% better are highlighted in green.

Since 2019 vs. Florida state average
Overall vs. FL average 0 Worse No metrics in this bucket. 2 Better Metrics better than Florida average:
• Total citations (58% below)
• Citations per year (57% below)
Latest Inspection December 18, 2025 Annual Inspection

Citations Info Citations are formal regulatory issues recorded during state inspections.

This FacilityFL Averagevs. FL Avg
Total citations Info Formal regulatory issues recorded by inspectors across all inspection types. 1433 This facility has 58% fewer total citations than a typical Florida nursing home (14 vs. FL avg 33).↓ 58% better Rank #1 / 919 Total citations — State benchmarked This home is ranked 1st out of 919 homes in Florida. Shows this facility's total citations compared to the Florida average among 919 comparable communities in the ranking pool. Rankings are based only on facilities in Florida that report data for that category. Facilities without available data are excluded from the ranking.
Citations per year Info Average citations per year since 2019. 24.7 This facility has 57% fewer citations per year than a typical Florida nursing home (2 vs. FL avg 4.7).↓ 57% better

Inspection Reports Summary Info An editor-reviewed summary of the themes and findings across this facility's recent inspection reports.

  • December 18, 2025 annual inspection found 2 deficiencies including failure to document intravenous antibiotic administration and improper food handling with contamination risks.
  • February 25, 2021 inspection cited 6 deficiencies involving medication administration errors, failure to follow oxygen and IV care orders, and lack of Medicaid coverage notices.
  • August 1, 2019 inspection noted 6 deficiencies related to call light accessibility, food preference violations, notification failures, and nourishment room sanitation issues.

Health Inspection History

Inspections since 2018
Total health inspections 3

Florida average 4.3


Last Health inspection on Feb 2021

Total health citations
22 Rank #161 / 252Health citations — State benchmarkedThis home is ranked 161st out of 252 homes in Florida. Shows this facility's total health deficiency citations benchmarked to the Florida State average, with a ranking across all 252 FL facilities. Lower citation counts earn a better rank.Rankings are based only on facilities in Florida that report data for that category. Facilities without available data are excluded from the ranking.Click the rank badge to see the full State ranking.Click here to see the full State ranking.

Florida average 19.7

Citations per inspection
7.33 Rank #224 / 252Citations per inspection — State benchmarkedThis home is ranked 224th out of 252 homes in Florida. Shows average deficiency citations per CMS inspection for this facility versus the Florida mean across 252 facilities with citation data. Lower is better.Rankings are based only on facilities in Florida that report data for that category. Facilities without available data are excluded from the ranking.Click the rank badge to see the full State ranking.Click here to see the full State ranking.

Florida average 4.48


Health citations are formal notices following inspections when they fail to comply with safety and care standards.

All 22 citations resulted from standard inspections.

Breakdown of citation severity (last 8 years)
Critical health citations
0
100% better than Florida average

Florida average: 0.8


Serious health citations
0
100% better than Florida average

Florida average: 0.4

0 critical citations Florida average: 0.8

0 serious citations Florida average: 0.4

21 moderate citations Florida average: 18.4

1 minor citation Florida average: 0.2
Citations history (last 8 years)
Environmental moderate citation Feb 25, 2021
Corrected

Pharmacy moderate citation Feb 25, 2021
Corrected

Quality of Care moderate citation Feb 25, 2021
Corrected

Quality of Care moderate citation Feb 25, 2021
Corrected

Staffing Data

Reporting period: October 1 – December 31, 2025 (Q4 2025). Source: CMS Payroll-Based Journal report.

Total staff 116
Employees 111
Contractors 5
Staff to resident ratio 1.07 : 1
27% fewer staff per resident than Florida average
Florida average ratio: 1.47 : 1 Florida average ratio: 1.47 : 1See full Florida ranking
Avg staff/day 28
Average shift 7.3 hours
8% worse than Florida average
Florida average: 7.9 hours Florida average shift: 7.9 hoursSee full Florida ranking
Total staff hours (quarter) 18,392

Nursing staff breakdown

Q4 2025 · Oct 1 – Dec 31 More info This data comes from the CMS Payroll-Based Journal report covering October 1 – December 31, 2025.
Registered Nurse

Manages medical care and health needs.

RN Staff Info All 13 RN Staff are full-time employees. No contractors work on this role. 13
Average shift length Info Average shift length. Calculated as total hours divided by days worked and average staff per day. 7.3 hours
Licensed Practical Nurse

Assists with medical care and medications.

LPN Staff Info All 27 LPN Staff are full-time employees. No contractors work on this role. 27
Average shift length Info Average shift length. Calculated as total hours divided by days worked and average staff per day. 7.3 hours
Certified Nursing Assistant

Helps with daily care and mobility.

CNA Staff Info All 40 CNA Staff are full-time employees. No contractors work on this role. 40
Average shift length Info Average shift length. Calculated as total hours divided by days worked and average staff per day. 7.5 hours

Contractor staffing

Q4 2025 · Oct 1 – Dec 31 More info This data comes from the CMS Payroll-Based Journal report covering October 1 – December 31, 2025.

Total hours from contractors

0.3%

61 contractor hours this quarter

Occupational Therapy Assistant: 3 Medical Director: 1 Occupational Therapy Aide: 1

Staff by category

Q4 2025 · Oct 1 – Dec 31 More info This data comes from the CMS Payroll-Based Journal report covering October 1 – December 31, 2025.
Certified Nursing Assistant400408,4518999%7.5
Licensed Practical Nurse270273,7387988%7.3
Registered Nurse130131,2307381%7.3
Respiratory Therapy Technician4049717988%7.2
Mental Health Service Worker2025656673%8.1
Administrator1015286673%8
Qualified Social Worker2024366067%7.1
Nurse Practitioner2024165258%8
Physical Therapy Aide3034034752%6.1
Physical Therapy Assistant4043565056%5.3
Dietitian3033354449%7.5
Speech Language Pathologist2022843337%6.5
RN Director of Nursing3032593539%7.2
Other Social Services Staff1011412022%7.1
Other Dietary Services Staff1011101921%5.8
Clinical Nurse Specialist202801618%4.7
Occupational Therapy Aide112351011%3.2
Medical Director0113533%11.5
Occupational Therapy Assistant0331944%4.7
40 Certified Nursing Assistant
% of Days 99%
27 Licensed Practical Nurse
% of Days 88%
13 Registered Nurse
% of Days 81%
4 Respiratory Therapy Technician
% of Days 88%
2 Mental Health Service Worker
% of Days 73%
1 Administrator
% of Days 73%
2 Qualified Social Worker
% of Days 67%
2 Nurse Practitioner
% of Days 58%
3 Physical Therapy Aide
% of Days 52%
4 Physical Therapy Assistant
% of Days 56%
3 Dietitian
% of Days 49%
2 Speech Language Pathologist
% of Days 37%
3 RN Director of Nursing
% of Days 39%
1 Other Social Services Staff
% of Days 22%
1 Other Dietary Services Staff
% of Days 21%
2 Clinical Nurse Specialist
% of Days 18%
2 Occupational Therapy Aide
% of Days 11%
1 Medical Director
% of Days 3%
3 Occupational Therapy Assistant
% of Days 4%

Penalties and fines

Federal penalties imposed by CMS for regulatory violations, including civil money penalties (fines) and denials of payment for new Medicare/Medicaid admissions.

Source: CMS Penalties Database

No penalties in the past 3 years

No civil money penalties or payment denials were reported in the last 3 years.

Breakdown by payment type

Medicare

45% of new residents, usually for short-term rehab.

Typical stay 2 - 3 months

Private pay

36% of new residents, often for short stays.

Typical stay 1 - 2 months

Medicaid

20% of new residents, often for long-term daily care.

Typical stay 1 - 2 months

Facility Characteristics

Source: CMS Long-Term Care Facility Characteristics (Data as of Jan 2026)

Total residents 108
Medicare
27
25% of residents
Medicaid
68
63% of residents
Private pay or other
13
12% of residents
Programs & Services
Residents Group

Residents meet regularly to discuss policies, care quality, and activities

Family Member Group

Family members meet regularly to discuss policies, care quality, and activities

Active Family Council

Organized group of family members that meets regularly to discuss facility policies, resident care, and activities.

Active Resident Council

Organized group of residents that meets regularly to discuss facility policies, quality of life, and activities.

Finances and operations

Based on CMS SNF Cost Report for fiscal year ending in 05/2023.

Voluntary non-profit community
Operated by a church.
Net patient revenue Info Net patient revenue — what the home actually collects for resident care, after contractual allowances, bad debt and discounts are subtracted from its gross charges (CMS cost report, Worksheet G-3). It covers resident care only; money the home earns from other sources is shown separately as "Other income."
$4.6M
Net patient income Info Net patient income: net patient revenue minus the home's total operating expenses. A positive figure means it earns more from resident care than it spends to deliver it; a negative figure means the opposite. It excludes non-operating "other income."
-$2.7M
Voluntary non-profit community Operated by a church.
Net patient revenue Info Net patient revenue — what the home actually collects for resident care, after contractual allowances, bad debt and discounts are subtracted from its gross charges (CMS cost report, Worksheet G-3). It covers resident care only; money the home earns from other sources is shown separately as "Other income."
$4.6M Rank #237 / 257Revenue — State benchmarkedThis home is ranked 237th out of 257 homes in Florida. Shows this facility's annual revenue compared to the Florida average. Higher revenue generally means more resources for staffing and capital — read alongside Payroll %.Rankings are based only on facilities in Florida that report data for that category. Facilities without available data are excluded from the ranking.Click the rank badge to see the full State ranking.Click here to see the full State ranking.
Net patient income Info Net patient income: net patient revenue minus the home's total operating expenses. A positive figure means it earns more from resident care than it spends to deliver it; a negative figure means the opposite. It excludes non-operating "other income."
-$2.7M
Other income Info Money the home earns outside of resident care — such as investments, grants, rentals and other non-operating sources (CMS cost report, Worksheet G-3). It is tracked separately from net patient revenue: it is not part of that figure, and it is not included in net patient income.
$93.8K
Payroll costs Info Staff salaries plus wage-related costs — benefits such as payroll taxes, health insurance and retirement — from the home's own accounting records (CMS cost report, Worksheet A). Contract or agency labor is counted separately, under other operating costs. Rank #231 / 257Payroll — State benchmarkedThis home is ranked 231st out of 257 homes in Florida. Shows total annual staff payroll benchmarked to the Florida average. Higher payroll investment relative to peers often signals better staffing and less reliance on cheaper contract labor.Rankings are based only on facilities in Florida that report data for that category. Facilities without available data are excluded from the ranking.Click the rank badge to see the full State ranking.Click here to see the full State ranking.
$3.4M 72.4% of net patient revenue Info Payroll as a share of revenue: staff salaries and wage-related benefits divided by net patient revenue. A higher figure means more of each revenue dollar goes to staff pay. Rank #106 / 257Payroll % — State benchmarkedThis home is ranked 106th out of 257 homes in Florida. Shows payroll as a percentage of revenue versus the Florida average. Well-run Florida facilities typically land around 49–56% — the top third Statewide. Below 25% may signal understaffing or heavy agency use — read with Staffing ratings.Rankings are based only on facilities in Florida that report data for that category. Facilities without available data are excluded from the ranking.Click the rank badge to see the full State ranking.Click here to see the full State ranking.
Other operating costs Info Everything it costs to run the home apart from payroll — food, utilities, supplies, maintenance, contract labor and administration. Calculated as total operating expense minus payroll (staff salaries and wage-related benefits).
$3.9M
Total costs Info The home's total operating expense for the year — all the costs of running it, salaries included (CMS cost report, Worksheet G-3).
$7.3M

Who this home usually serves

TYPE OF STAY

Mostly short-term rehab stays

Most residents typically stay for a few weeks or months before returning home or moving on.

New residents most often arrive under Medicare (45% of admissions), and a typical Medicare stay runs around 2 - 3 months.

Admissions
241 total

Coverage residents most often arrive under.

Medicare 45%
Private pay 36%
Medicaid 20%
Discharges
355 total

Coverage residents most often leave under.

Medicare 35%
Private pay 30%
Medicaid 35%

Places of interest near Life Care Center of Orlando

Address 10.2 miles from city center Info Estimated distance in miles from Orlando's city center to Life Care Center of Orlando's address, calculated via Google Maps. — 5.12 miles to nearest hospital (AdventHealth East Orlando)

Calculate Travel Distance to Life Care Center of Orlando

Add your location

Address

Compare Nursing Homes around Orlando

The information below is reported by the Florida Agency for Health Care Administration (AHCA).

5 facilities compared · CMS & FL Dept. of Health data

Westminster Baldwin Park
NH
AL
IL
MC
Orlando (Northeast Orlando)
24
Facility 24
FL AVG 89
Rank #875 / 1074
55.4%
Facility 55.4%
FL AVG 84.3%
Rank #246 / 258
-34%
4.90
Facility 4.90
FL AVG 4.04
Rank #32 / 253
+80%+21%
$0
Facility $0
FL AVG $78.9k
Rank #1 / 258
-
15
Facility 15
FL AVG 19.7
Rank #93 / 252
5.0
Facility 5.0
FL AVG 4.5
Rank #164 / 252
-18-
26
Facility 26
FL AVG 40
Rank #976 / 1486
Presbyterian Retirement Communities, Inc
$4.7M
Facility $4.7M
FL AVG $15.7M
Rank #216 / 257
$3.5M
Facility $3.5M
FL AVG $6.1M
Rank #230 / 257
73.9%
Facility 73.9%
FL AVG 39.8%
Rank #213 / 257
106118
The Towers Orlando
NH
AL
IL
NC
Orlando (Central Business District)
168
Facility 168
FL AVG 89
Rank #99 / 1074
71.4%
Facility 71.4%
FL AVG 84.3%
Rank #219 / 258
-15%
4.09
Facility 4.09
FL AVG 4.04
Rank #91 / 253
+71%+1%
$0
Facility $0
FL AVG $78.9k
Rank #1 / 258
-
11
Facility 11
FL AVG 19.7
Rank #53 / 252
2.8
Facility 2.8
FL AVG 4.5
Rank #45 / 252
-148-
96
Facility 96
FL AVG 40
Rank #11 / 1486
Orlando Lutheran Towers, Inc
$15.9M
Facility $15.9M
FL AVG $15.7M
Rank #88 / 257
$11.1M
Facility $11.1M
FL AVG $6.1M
Rank #55 / 257
70%
Facility 70%
FL AVG 39.8%
Rank #81 / 257
105731
Life Care Center of Orlando
NH
Orlando
132
Facility 132
FL AVG 89
Rank #206 / 1074
--- --7%-
$0
Facility $0
FL AVG $78.9k
Rank #1 / 258
-
22
Facility 22
FL AVG 19.7
Rank #161 / 252
7.3
Facility 7.3
FL AVG 4.5
Rank #224 / 252
-38-
38
Facility 38
FL AVG 40
Rank #764 / 1486
Joseph Jicha
$4.6M
Facility $4.6M
FL AVG $15.7M
Rank #237 / 257
$3.4M
Facility $3.4M
FL AVG $6.1M
Rank #231 / 257
72.4%
Facility 72.4%
FL AVG 39.8%
Rank #106 / 257
105974
Westminster Towers
NH
AL
IL
Orlando (Southeast Orlando)
60
Facility 60
FL AVG 89
Rank #695 / 1074
88.6%
Facility 88.6%
FL AVG 84.3%
Rank #139 / 258
+5%
3.78
Facility 3.78
FL AVG 4.04
Rank #145 / 253
+18%-6%
$22.1k
Facility $22.1k
FL AVG $78.9k
Rank #202 / 258
82
Facility 82
FL AVG 83
Rank #530 / 876
22
Facility 22
FL AVG 19.7
Rank #161 / 252
3.7
Facility 3.7
FL AVG 4.5
Rank #94 / 252
196-
65
Facility 65
FL AVG 40
Rank #275 / 1486
Westminster Services Inc
$13.5M
Facility $13.5M
FL AVG $15.7M
Rank #40 / 257
$13.2M
Facility $13.2M
FL AVG $6.1M
Rank #37 / 257
97.8%
Facility 97.8%
FL AVG 39.8%
Rank #149 / 257
105757
Conway Lakes Health & Rehabilitation
NH
Orlando (Dover Manor)
120
Facility 120
FL AVG 89
Rank #256 / 1074
95.5%
Facility 95.5%
FL AVG 84.3%
Rank #20 / 258
+13%
4.21
Facility 4.21
FL AVG 4.04
Rank #75 / 253
-11%+4%
$94.7k
Facility $94.7k
FL AVG $78.9k
Rank #236 / 258
-
31
Facility 31
FL AVG 19.7
Rank #216 / 252
4.4
Facility 4.4
FL AVG 4.5
Rank #137 / 252
3115-
10
Facility 10
FL AVG 40
Rank #1263 / 1486
Brittney Dumont
$16.3M
Facility $16.3M
FL AVG $15.7M
Rank #131 / 257
$9.0M
Facility $9.0M
FL AVG $6.1M
Rank #102 / 257
55.2%
Facility 55.2%
FL AVG 39.8%
Rank #83 / 257
105754

Financial Assistance for
Nursing Home in Florida

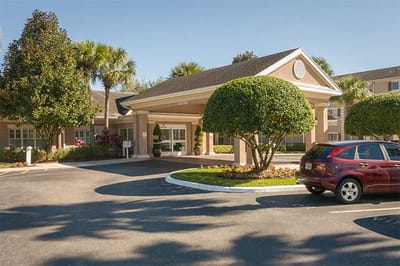
Life Care Center of Orlando is located in Orlando, Florida.
Here are the financial assistance programs available to residents in Florida.

Get Financial aid guidance

Long-Term Care Waiver

Florida Medicaid LTC Waiver

Age 65+ or 21+ disabled
General Florida resident, Medicaid- eligible, nursing home-level care need.
Income Limits (2025) ~$2,829/month 300% FBR, individual
Asset Limits $2,000 (individual), $3,000 (couple).
FL

High demand; waitlists common.

Benefits
In-home care (6-8 hours/day) Assisted living Respite (240 hours/year) Case management

Community Care for the Elderly (CCE)

Florida CCE

Age 60+
General Florida resident, at risk of nursing home.
Income Limits ~$2,000/month varies
Asset Limits $5,000 individual
FL

Limited funding; regional variation.

Benefits
Homemaker services (3-5 hours/week) Adult day care (~$60/day) Respite (up to 10 days/year)

Home Care for the Elderly (HCE)

Florida Home Care for the Elderly

Age 60+
General Florida resident, at risk of nursing home placement; caregiver must be approved.
Income Limits (2025) ~$2,829/month individual, aligned with Medicaid thresholds
Asset Limits ~$2,000 (individual); varies by case manager discretion.
FL

Limited funding (~3,500 served annually); prioritizes low-income frail seniors.

Benefits
Basic subsidy (~$160/month) for housing/medical costs; special subsidies for supplies/services (e.g., incontinence supplies, ~$50-$200/month)

Program of All-Inclusive Care for the Elderly (PACE)

Florida Medicaid PACE

Age 55+
General Florida resident, nursing home-level care need, safe with PACE support.
Income Limits (2025) ~$2,829/month 300% FBR
Asset Limits $2,000 (individual), $3,000 (couple).
FL

Limited to specific counties (e.g., Hillsborough, Miami-Dade); ~10 sites statewide.

Benefits
Personal care (5-7 hours/day) Medical care Meals Transportation Therapy

Optional State Supplementation (OSS)

Florida Optional State Supplementation

Age 65+ or disabled
General Florida resident, living in approved facility, receiving SSI or low-income.
Income Limits (2025) ~$1,004/month individual, including SSI
Asset Limits $2,000 (individual), $3,000 (couple).
FL

Limited to specific facility types; ~$78.40/month max supplement.

Benefits
Cash payment (~$78.40/month) for room/board or personal needs in facilities

Frequently Asked Questions about Life Care Center of Orlando

Is Life Care Center of Orlando in a walkable area?

Life Care Center of Orlando has a walk score of 38. Somewhat walkable. A few nearby services may be reachable on foot, but most trips require transportation.

What is the occupancy rate at Life Care Center of Orlando?

Life Care Center of Orlando's occupancy is 0.0%.

Are there photos of Life Care Center of Orlando?

Yes — there are 5 photos of Life Care Center of Orlando in the photo gallery on this page.

What is the address of Life Care Center of Orlando?

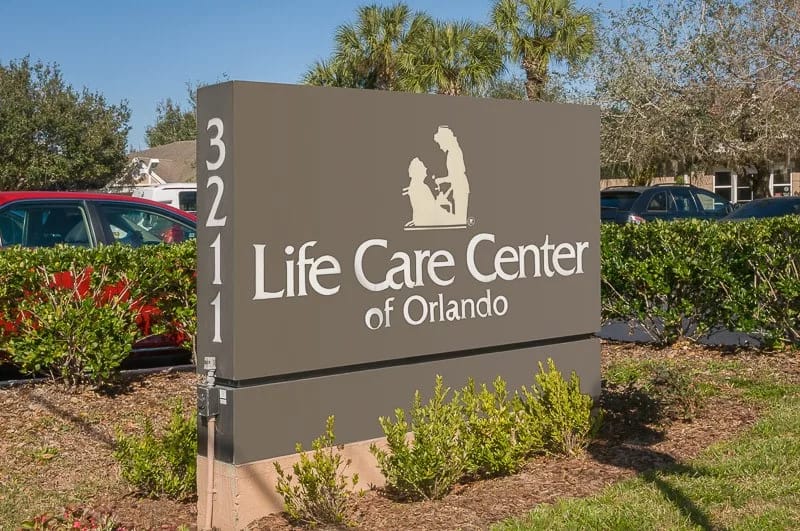
Life Care Center of Orlando is located at 3211 Rouse Road, Orlando, FL 32817.

What is the phone number of Life Care Center of Orlando?

(407) 831-3446 will put you in contact with the team at Life Care Center of Orlando.

Is Life Care Center of Orlando Medicare or Medicaid certified?

Yes — Life Care Center of Orlando is a CMS-certified provider of Medicare and Medicaid.

Guides for Better Senior Living

Care Cost Calculator: See Prices in Your Area

Nursing Home Data Explorer

Don’t Wait Too Long: 7 Red Flag Signs Your Parent Needs Assisted Living Now

The True Cost of Assisted Living in 2025 – And How Families Are Paying For It

Understanding Senior Living Costs: Pricing Models, Discounts & Financial Assistance