

Total staff
87
Employees
65
Contractors
22

We arrange tours, appointments, and even moving support so you don’t have to
Enjoy recovery support with a human touch in Norview Heights Rehabilitation and Nursing, a well-founded senior care provider in Norfolk, VA, offering an array of rehabilitation and nursing care services. Residents here can recover in utmost comfort knowing that an on-site medical director, on-call area physicians, licensed nurses, and certified nursing assistants, are available to care for their needs and preferences. The community also offers specialized memory care services to ensure residents dealing with memory loss are able to continue enjoying their lifestyle.
With a focus on residents’ overall enrichment, the community also offers a dynamic array of fun and stimulating activities that keep residents moving and making new connections for a well-rounded experience. Residents enjoy nourishing meals that are carefully reviewed by a registered dietitian, ensuring they get all the nutrients they need to stay healthy. The community also offers hospice care to make sure residents are well-cared for even as they near their end of life journey.
| Staff type | Hours / Day / Resident | vs state avg |
|---|---|---|
|
Registered Nurse (RN)
| 28m per day | ▼ 31% State avg: 41m per day · National avg: 41m per day |
|
LPN / LVN
| 1h 4m per day | ▲ 7% State avg: 1h 0m per day · National avg: 52m per day |
|
Nurse Aide
| 1h 38m per day | ▼ 23% State avg: 2h 8m per day · National avg: 2h 21m per day |
|
Weekend Total Nursing
| 2h 41m per day | ▼ 19% State avg: 3h 19m per day · National avg: 3h 26m per day |
|
Physical Therapist
| 9m per day | ▲ 90% State avg: 5m per day · National avg: 4m per day |
|
Weekend RN
| 18m per day | ▼ 36% State avg: 28m per day · National avg: 29m per day |
Reporting period: October 1 – December 31, 2025 (Q4 2025). Source: CMS Payroll-Based Journal report.
Manages medical care and health needs.
Assists with medical care and medications.
Helps with daily care and mobility.
Total hours from contractors
1,031 contractor hours this quarter
| Certified Nursing Assistant | 24 | 14 | 38 | 8,313 | 92 | 100% | 9 |
| Licensed Practical Nurse | 13 | 8 | 21 | 4,441 | 92 | 100% | 9.4 |
| Registered Nurse | 4 | 0 | 4 | 1,085 | 75 | 82% | 10 |
| RN Director of Nursing | 3 | 0 | 3 | 1,004 | 79 | 86% | 8.9 |
| Respiratory Therapy Technician | 3 | 0 | 3 | 803 | 79 | 86% | 6.3 |
| Clinical Nurse Specialist | 5 | 0 | 5 | 753 | 73 | 79% | 8.7 |
| Administrator | 1 | 0 | 1 | 559 | 66 | 72% | 8.5 |
| Nurse Practitioner | 1 | 0 | 1 | 559 | 66 | 72% | 8.5 |
| Dietitian | 1 | 0 | 1 | 540 | 71 | 77% | 7.6 |
| Physical Therapy Assistant | 4 | 0 | 4 | 481 | 70 | 76% | 5.9 |
| Other Dietary Services Staff | 1 | 0 | 1 | 364 | 58 | 63% | 6.3 |
| Physical Therapy Aide | 3 | 0 | 3 | 203 | 29 | 32% | 7 |
| Speech Language Pathologist | 1 | 0 | 1 | 161 | 25 | 27% | 6.4 |
| Qualified Social Worker | 1 | 0 | 1 | 106 | 62 | 67% | 1.7 |
Federal penalties imposed by CMS for regulatory violations, including civil money penalties (fines) and denials of payment for new Medicare/Medicaid admissions.
Source: CMS Penalties Database
No penalties in the past 3 years
No civil money penalties or payment denials were reported in the last 3 years.
These measures show how residents usually do over time at this home, based on health outcomes and preventive care.
Virginia average: 10.1
Virginia average: 19.7
Virginia average: 16.8%
Virginia average: 19.7%
Virginia average: 22.6%
Virginia average: 3.6%
Virginia average: 5.4%
Virginia average: 1.5%
Virginia average: 5.9%
Virginia average: 14.9%
Virginia average: 12.9%
Virginia average: 91.3%
Virginia average: 94.0%
Virginia average: 74.9%
Virginia average: 1.2%
Virginia average: 73.6%
Virginia average: 22.0%
Virginia average: 11.7%
Virginia average: 0.8%
Virginia average: 53.7%
Virginia average: 50.6%
Quality measures are calculated from Minimum Data Set (MDS) assessments. For most measures, lower percentages indicate better care quality.
33% of new residents, usually for short-term rehab.
36% of new residents, often for short stays.
30% of new residents, often for long-term daily care.
Source: CMS Long-Term Care Facility Characteristics (Data as of Jan 2026)
Residents meet regularly to discuss policies, care quality, and activities
Organized group of residents that meets regularly to discuss facility policies, quality of life, and activities.
Data sourced from CMS Long-Term Care Facility Characteristics quarterly report. Payer mix reflects the current resident census by primary payment source.
Historical financial and operational data for Norview Heights Rehabilitation and Nursing from 2011–2024, based on CMS SNF Cost Reports.
Based on the 2024 CMS SNF Cost Report.
Most residents stay for extended periods and receive ongoing daily care.
New residents most often arrive under private pay (36% of admissions), and a typical private pay stay runs around 30 days.
Coverage residents most often arrive under.
Coverage residents most often leave under.
![]() 18.5 miles from city center
18.5 miles from city center
![]() Estimated distance in miles from Norfolk's city center to Norview Heights Rehabilitation and Nursing's address, calculated via Google Maps.
— 3.18 miles to nearest hospital (Lake Taylor Transitional Care Hospital)
Estimated distance in miles from Norfolk's city center to Norview Heights Rehabilitation and Nursing's address, calculated via Google Maps.
— 3.18 miles to nearest hospital (Lake Taylor Transitional Care Hospital)
Add your location
Norview Heights Rehabilitation and Nursing is located in Norfolk, Virginia.
Here are the financial assistance programs available to residents in Virginia.
The information below is reported by the Virginia Department of Social Services and Department of Health.
| Autumn Care of Norfolk |
NH Nursing Home Licensed facility providing 24/7 skilled nursing care for residents with complex, ongoing medical needs. Staffed by RNs, LPNs, and CNAs. Inspected and star-rated annually by CMS. Accepts Medicare (short-term rehab) and Medicaid (long-term care).
HC Home Care Professional care delivered in the person's own home — from companionship and errands to skilled nursing and therapy. Allows seniors to age in place. Medicare covers skilled home health when medically necessary.
MC Memory Care Secured, specialized care for people living with Alzheimer's or dementia. Staff trained in cognitive impairment, with higher staff-to-resident ratios and an environment designed to reduce confusion and wandering risk.
RC Respite Care Short-term temporary care — days to weeks — to give family caregivers a break. Full care provided during the stay. Often used after hospitalization or to trial a facility before a permanent placement decision. | Norfolk (Foxhall) | 120
Facility
120
VA AVG
95
Rank
#89 / 371 |
90.5%
Facility
90.5%
VA AVG
85.7%
Rank
#41 / 311 | +6% | 3.24
Facility
3.24
VA AVG
3.74
Rank
#67 / 85 | -26% | -13% | $0
Facility
$0
VA AVG
$54.3k
Rank
#1 / 89 | 43
Facility
43
VA AVG
38.4
Rank
#54 / 86 | 14.3
Facility
14.3
VA AVG
8.9
Rank
#71 / 86 | - | 113 | - |
56
Facility
56
VA AVG
44
Rank
#143 / 449 | Celia Soper | $11.0M
Facility
$11.0M
VA AVG
$18.3M
Rank
#77 / 85 | $7.0M
Facility
$7.0M
VA AVG
$6.9M
Rank
#63 / 85 | 63.8%
Facility
63.8%
VA AVG
39.7%
Rank
#4 / 85 | 495253 | ||||
| Norview Heights Rehabilitation and Nursing |
NH Nursing Home Licensed facility providing 24/7 skilled nursing care for residents with complex, ongoing medical needs. Staffed by RNs, LPNs, and CNAs. Inspected and star-rated annually by CMS. Accepts Medicare (short-term rehab) and Medicaid (long-term care).
HC Home Care Professional care delivered in the person's own home — from companionship and errands to skilled nursing and therapy. Allows seniors to age in place. Medicare covers skilled home health when medically necessary.
PC Palliative Care
RC Respite Care Short-term temporary care — days to weeks — to give family caregivers a break. Full care provided during the stay. Often used after hospitalization or to trial a facility before a permanent placement decision. | Norfolk (Fairmont Park) | 60
Facility
60
VA AVG
95
Rank
#273 / 371 |
90.8%
Facility
90.8%
VA AVG
85.7%
Rank
#40 / 311 | +6% | 3.27
Facility
3.27
VA AVG
3.74
Rank
#60 / 85 | -52% | -13% | $0
Facility
$0
VA AVG
$54.3k
Rank
#1 / 89 | 46
Facility
46
VA AVG
38.4
Rank
#58 / 86 | 9.2
Facility
9.2
VA AVG
8.9
Rank
#48 / 86 | 1 | 55 | - |
30
Facility
30
VA AVG
44
Rank
#304 / 449 | Kelli Marshall-Hodges | $7.2M
Facility
$7.2M
VA AVG
$18.3M
Rank
#85 / 85 | $4.2M
Facility
$4.2M
VA AVG
$6.9M
Rank
#84 / 85 | 57.8%
Facility
57.8%
VA AVG
39.7%
Rank
#12 / 85 | 495309 | ||||
| Signature Healthcare of Norfolk |
NH Nursing Home Licensed facility providing 24/7 skilled nursing care for residents with complex, ongoing medical needs. Staffed by RNs, LPNs, and CNAs. Inspected and star-rated annually by CMS. Accepts Medicare (short-term rehab) and Medicaid (long-term care).
HC Home Care Professional care delivered in the person's own home — from companionship and errands to skilled nursing and therapy. Allows seniors to age in place. Medicare covers skilled home health when medically necessary.
MC Memory Care Secured, specialized care for people living with Alzheimer's or dementia. Staff trained in cognitive impairment, with higher staff-to-resident ratios and an environment designed to reduce confusion and wandering risk.
PC Palliative Care
RC Respite Care Short-term temporary care — days to weeks — to give family caregivers a break. Full care provided during the stay. Often used after hospitalization or to trial a facility before a permanent placement decision. | Norfolk (Ghent) | 169
Facility
169
VA AVG
95
Rank
#29 / 371 |
92.3%
Facility
92.3%
VA AVG
85.7%
Rank
#29 / 311 | +8% | 3.39
Facility
3.39
VA AVG
3.74
Rank
#53 / 85 | +11% | -9% | $0
Facility
$0
VA AVG
$54.3k
Rank
#1 / 89 | 47
Facility
47
VA AVG
38.4
Rank
#60 / 86 | 15.7
Facility
15.7
VA AVG
8.9
Rank
#79 / 86 | 3 | 154 | - |
88
Facility
88
VA AVG
44
Rank
#21 / 449 | Cie Drake | $22.4M
Facility
$22.4M
VA AVG
$18.3M
Rank
#45 / 85 | $8.1M
Facility
$8.1M
VA AVG
$6.9M
Rank
#53 / 85 | 36.4%
Facility
36.4%
VA AVG
39.7%
Rank
#67 / 85 | 495068 | ||||
| Consulate Health Care of Norfolk |
NH Nursing Home Licensed facility providing 24/7 skilled nursing care for residents with complex, ongoing medical needs. Staffed by RNs, LPNs, and CNAs. Inspected and star-rated annually by CMS. Accepts Medicare (short-term rehab) and Medicaid (long-term care).
MC Memory Care Secured, specialized care for people living with Alzheimer's or dementia. Staff trained in cognitive impairment, with higher staff-to-resident ratios and an environment designed to reduce confusion and wandering risk. | Norfolk (Colonial Place) | 222
Facility
222
VA AVG
95
Rank
#10 / 371 |
87.3%
Facility
87.3%
VA AVG
85.7%
Rank
#64 / 311 | +2% | 3.32
Facility
3.32
VA AVG
3.74
Rank
#60 / 85 | -33% | -11% | $0
Facility
$0
VA AVG
$54.3k
Rank
#78 / 89 | 54
Facility
54
VA AVG
38.4
Rank
#69 / 86 | 10.8
Facility
10.8
VA AVG
8.9
Rank
#57 / 86 | 3 | 158 | - |
77
Facility
77
VA AVG
44
Rank
#56 / 449 | Amir Hajimomenian | $24.7M
Facility
$24.7M
VA AVG
$18.3M
Rank
#42 / 85 | $8.0M
Facility
$8.0M
VA AVG
$6.9M
Rank
#54 / 85 | 32.2%
Facility
32.2%
VA AVG
39.7%
Rank
#74 / 85 | 495273 |
Norview Heights Rehabilitation and Nursing is in the Fairmont Park neighborhood.
Norview Heights Rehabilitation and Nursing has a walk score of 30. Somewhat walkable. A few nearby services may be reachable on foot, but most trips require transportation.
Norview Heights Rehabilitation and Nursing's occupancy is 90.8%.
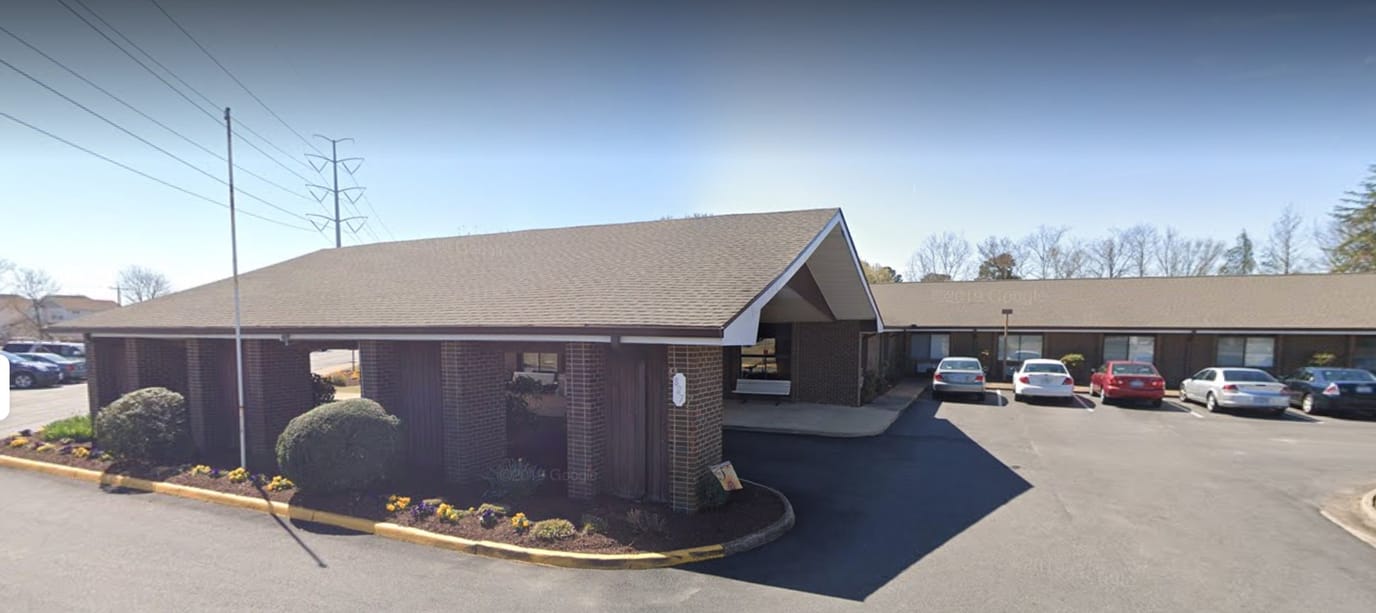
Yes — there is 1 photo of Norview Heights Rehabilitation and Nursing in the photo gallery on this page.
Norview Heights Rehabilitation and Nursing is located at 827 Norview Ave, Norfolk, VA 23509, United States.
(757) 853-6281 will put you in contact with the team at Norview Heights Rehabilitation and Nursing.
Yes — Norview Heights Rehabilitation and Nursing is a CMS-certified provider of Medicare and Medicaid.
Care Cost Calculator: See Prices in Your Area
Nursing Home Data Explorer
Don’t Wait Too Long: 7 Red Flag Signs Your Parent Needs Assisted Living Now
The True Cost of Assisted Living in 2025 – And How Families Are Paying For It
Understanding Senior Living Costs: Pricing Models, Discounts & Financial Assistance


Thank you for your interest!
Our team will be in touch shortly to help with next steps.
