Kempsville Health & Rehab Center
Nursing Home, Hospice Care, Memory Care & Respite Care · Virginia Beach, VA
CMS overall rating Info CMS (the Centers for Medicare & Medicaid Services) is the federal agency that rates nursing home quality. Its Overall Rating runs from 1 to 5 stars, combining health inspections, staffing, and quality measures, with inspections weighted most heavily.

Kempsville Health & Rehab Center

Nursing Home, Hospice Care, Memory Care & Respite Care · Virginia Beach, VA
CMS overall rating Info CMS (the Centers for Medicare & Medicaid Services) is the federal agency that rates nursing home quality. Its Overall Rating runs from 1 to 5 stars, combining health inspections, staffing, and quality measures, with inspections weighted most heavily.
Calculator: See prices in your area
Kempsville Health & Rehab Center accepts Medicare, Medicaid, and private pay.

Overview of Kempsville Health & Rehab Center

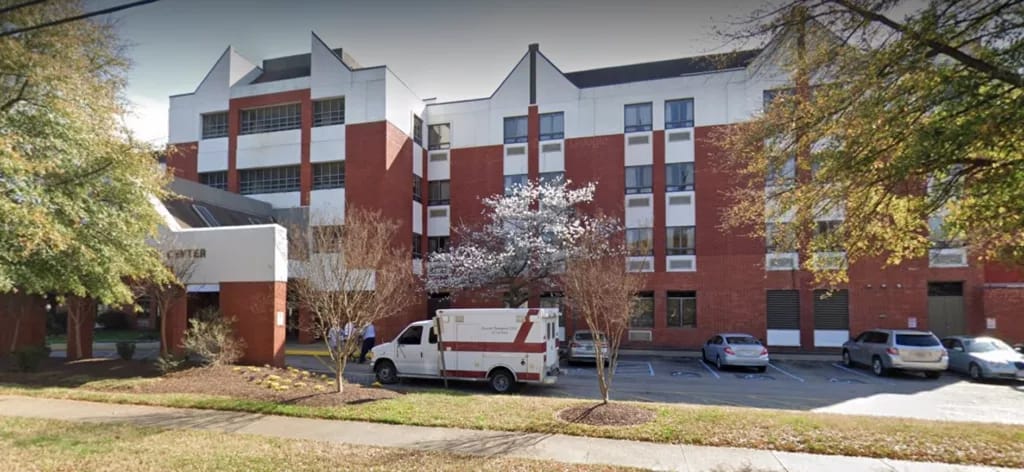
Nestled in the scenic neighborhood of Virginia Beach, VA, Kempsville Health & Rehab Center is a compassionate senior care provider, offering extensive rehabilitation, skilled nursing, and long-term care services. A team of highly skilled therapists are available to offer physical, speech, and occupational therapy services to help residents maintain their highest functionality to continue living their usual lifestyle. Each resident is provided with personalized care plans that best fits their individual needs and care goals and guarantee that they are met with effective services and care.

The community also provides its residents with countless opportunities for making meaningful connections and enriching memories through its vibrant array of activities, including shopping, outings, bingo, live entertainment, and more. Here, residents’ every need is met with compassion and expertise, guaranteeing they’ll be able to attain the best version of their overall well-being and functionality for a more rewarding living experience.

Quality ratings

Measured by Centers for Medicare & Medicaid Services (CMS)

Overall rating Info The Overall CMS Rating combines results from health inspections, staffing levels and quality measures. Health inspections carry the most weight. Staffing and quality scores can increase or decrease the final rating based on performance compared to state and national standards.
At VA avg. At VA avg.VA average: 3.0Click the badge to see the full State ranking.Click here to see the full State ranking.
Health Inspection Info Based on the results of the facility's three most recent standard inspections and any complaint investigations. CMS reviews the number, scope, and severity of deficiencies, with more recent findings weighted more heavily.
▲ 8.1% Above VA avg. ▲ 8.1% Above VA avg.VA average: 2.8Click the badge to see the full State ranking.Click here to see the full State ranking.
Staffing Info Measures average nursing staff hours per resident per day, including Registered Nurses (RNs) and total nursing staff. Ratings are adjusted based on the level of care residents require and are compared to state and national benchmarks.
▼ 19.0% Below VA avg. ▼ 19.0% Below VA avg.VA average: 2.5Click the badge to see the full State ranking.Click here to see the full State ranking.
Quality Measures Info Based on clinical and physical health indicators reported to CMS, such as hospital readmissions, falls, pressure ulcers, and improvements in mobility. These measures reflect how well residents' health needs are being managed.
▲ 3.9% Above VA avg. ▲ 3.9% Above VA avg.VA average: 3.8Click the badge to see the full State ranking.Click here to see the full State ranking.

Staffing hours breakdown

Info Daily nursing hours per resident by staff type, reported to CMS. Higher is generally better — compare this facility to state and national averages to see where staffing stands.

Hours per resident per day — compared to Virginia state averages

Total nursing care / resident Info This home is ranked 56th out of 89 homes in Virginia for nurse hours. Total adjusted nursing hours per resident per day, combining RN, LPN, and aide time. CMS adjusts this for case-mix so facilities can be fairly compared.
3h 27m per day
Rank #56 / 89Nurse hours — State benchmarkedThis home is ranked 56th out of 89 homes in Virginia. Shows adjusted nurse hours per resident per day benchmarked to the Virginia average, with a ranking across 89 Virginia facilities. More hours mean more direct care. The national average is about 3.5 hrs; below 3.0 is a red flag.Rankings are based only on facilities in Virginia that report data for that category. Facilities without available data are excluded from the ranking.Click the rank badge to see the full State ranking.Click here to see the full State ranking.
This facility Virginia avg (3h 45m per day)
vs Virginia avg
-8%

4 of 6 metrics below state avg

Standout metric Physical Therapist is +37% above state avg
Staff typeHours / Day / Residentvs state avg
Registered Nurse (RN) Info RNs hold the highest nursing license and can assess residents, interpret test results, and direct care plans. More RN hours per day often signals stronger clinical oversight and faster response to health changes. 34m per day ▼ 17% State avg: 41m per day · National avg: 41m per day
LPN / LVN Info Licensed Practical Nurses (LPNs) or Licensed Vocational Nurses (LVNs) deliver routine hands-on care — medication administration, wound dressing, and monitoring vital signs. They work under RN supervision and make up a large share of daily bedside care. 1h 5m per day ▲ 8% State avg: 1h 0m per day · National avg: 52m per day
Nurse Aide Info Certified Nurse Aides (CNAs) provide the most direct day-to-day assistance: bathing, dressing, feeding, and mobility. Nurse aide hours are typically the largest staffing category and directly affect residents' quality of life. 1h 47m per day ▼ 16% State avg: 2h 8m per day · National avg: 2h 21m per day
Weekend Total Nursing Info Combined nursing hours (RN + LPN + Nurse Aide) per resident per day on weekends. Staffing often drops on weekends — this figure reveals whether the facility maintains adequate coverage outside of weekday hours. 2h 56m per day ▼ 12% State avg: 3h 19m per day · National avg: 3h 26m per day
Physical Therapist Info Hours per resident per day provided by licensed Physical Therapists (PTs) or PT Assistants. PT services help residents recover mobility after injury or illness and are especially important for post-acute (short-stay) rehabilitation. 7m per day ▲ 37% State avg: 5m per day · National avg: 4m per day
Weekend RN Info Registered nurse hours specifically on weekends. Facilities sometimes reduce RN presence on Saturdays and Sundays — a low weekend RN figure compared to weekday hours can indicate reduced clinical oversight when most administrative staff are absent. 21m per day ▼ 26% State avg: 28m per day · National avg: 29m per day

Capacity and availability

This home usually has limited availability

Higher occupancy than the Virginia average: 85.7%
Occupancy rate
92.2% Rank #31 / 314Occupancy rate — State benchmarkedThis home is ranked 31st out of 314 homes in Virginia. Shows this facility's occupancy rate versus the Virginia average, with its Statewide rank out of 314. Higher occupancy signals strong local demand and financial stability.Rankings are based only on facilities in Virginia that report data for that category. Facilities without available data are excluded from the ranking.Click the rank badge to see the full State ranking.Click here to see the full State ranking.
Avg. Length of Stay
59 days
Bed community size
90-bed community Rank #181 / 371Bed count — State benchmarkedThis home is ranked 181st out of 371 homes in Virginia. Shows this facility's certified or reported bed count compared to other Virginia facilities. Larger communities may offer more amenities, programs, and on-site services for residents and families.Rankings are based only on facilities in Virginia that report data for that category. Facilities without available data are excluded from the ranking.Click the rank badge to see the full State ranking.Click here to see the full State ranking.
A larger shared setting that may offer more common spaces and organized community services.
Walk Score
Walk Score: 60 / 100 Rank #109 / 449Walk Score — State benchmarkedThis home is ranked 109th out of 449 homes in Virginia. Shows how walkable this facility's neighborhood is compared to the average Walk Score across Virginia facilities. Higher scores benefit residents, families, and staff.Rankings are based only on facilities in Virginia that report data for that category. Facilities without available data are excluded from the ranking.Click the rank badge to see the full State ranking.Click here to see the full State ranking.
Moderately walkable. Some errands can be accomplished on foot, with a mix of nearby amenities.

Contact Kempsville Health & Rehab Center

Staffing Data

Reporting period: October 1 – December 31, 2025 (Q4 2025). Source: CMS Payroll-Based Journal report.

Total staff 131
Employees 87
Contractors 44
Staff to resident ratio 1.75 : 1
5% more staff per resident than Virginia average
Virginia average ratio: 1.67 : 1 Virginia average ratio: 1.67 : 1See full Virginia ranking
Avg staff/day 48
Average shift 7.9 hours
0% compared with Virginia average
Virginia average: 8 hours Virginia average shift: 8 hoursSee full Virginia ranking
Total staff hours (quarter) 35,063

Nursing staff breakdown

Q4 2025 · Oct 1 – Dec 31 More info This data comes from the CMS Payroll-Based Journal report covering October 1 – December 31, 2025.
Registered Nurse

Manages medical care and health needs.

RN Staff Info 15 total: 11 full-time employees and 4 contractors. 15
Average shift length Info Average shift length. Calculated as total hours divided by days worked and average staff per day. 8.7 hours
Licensed Practical Nurse

Assists with medical care and medications.

LPN Staff Info 22 total: 20 full-time employees and 2 contractors. 22
Average shift length Info Average shift length. Calculated as total hours divided by days worked and average staff per day. 8.4 hours
Certified Nursing Assistant

Helps with daily care and mobility.

CNA Staff Info 50 total: 44 full-time employees and 6 contractors. 50
Average shift length Info Average shift length. Calculated as total hours divided by days worked and average staff per day. 8.1 hours

Contractor staffing

Q4 2025 · Oct 1 – Dec 31 More info This data comes from the CMS Payroll-Based Journal report covering October 1 – December 31, 2025.

Total hours from contractors

15%

5,250 contractor hours this quarter

Speech Language Pathologist: 9 Certified Nursing Assistant: 6 Respiratory Therapy Technician: 6 Physical Therapy Aide: 5 Physical Therapy Assistant: 4 Registered Nurse: 4 Clinical Nurse Specialist: 4 Licensed Practical Nurse: 2 Qualified Social Worker: 2 Occupational Therapy Aide: 1 RN Director of Nursing: 1

Staff by category

Q4 2025 · Oct 1 – Dec 31 More info This data comes from the CMS Payroll-Based Journal report covering October 1 – December 31, 2025.
Certified Nursing Assistant4465014,70592100%8.1
Licensed Practical Nurse202227,81292100%8.4
Registered Nurse114153,55192100%8.7
RN Director of Nursing3141,0927885%8
Dental Services Staff2021,0047582%8
Physical Therapy Aide0559546975%6.8
Administrator2029366470%8
Respiratory Therapy Technician0669367278%6.3
Physical Therapy Assistant0449347683%7.3
Clinical Nurse Specialist1455576672%7
Speech Language Pathologist0995466773%6.3
Nurse Practitioner1015286672%8
Qualified Social Worker0224846470%7.2
Dietitian1014746065%7.9
Occupational Therapy Aide1123044751%6.2
Other Dietary Services Staff1012483134%8
50 Certified Nursing Assistant
% of Days 100%
22 Licensed Practical Nurse
% of Days 100%
15 Registered Nurse
% of Days 100%
4 RN Director of Nursing
% of Days 85%
2 Dental Services Staff
% of Days 82%
5 Physical Therapy Aide
% of Days 75%
2 Administrator
% of Days 70%
6 Respiratory Therapy Technician
% of Days 78%
4 Physical Therapy Assistant
% of Days 83%
5 Clinical Nurse Specialist
% of Days 72%
9 Speech Language Pathologist
% of Days 73%
1 Nurse Practitioner
% of Days 72%
2 Qualified Social Worker
% of Days 70%
1 Dietitian
% of Days 65%
2 Occupational Therapy Aide
% of Days 51%
1 Other Dietary Services Staff
% of Days 34%

Penalties and fines

Federal penalties imposed by CMS for regulatory violations, including civil money penalties (fines) and denials of payment for new Medicare/Medicaid admissions.

Source: CMS Penalties Database

No penalties in the past 3 years

No civil money penalties or payment denials were reported in the last 3 years.

Quality of care over time

These measures show how residents usually do over time at this home, based on health outcomes and preventive care.

High-risk clinical events score Info A composite score based on pressure ulcers, falls with injury, weight loss, walking ability decline, and activities of daily living decline. 6.4
37% better than Virginia average

Virginia average: 10.1

Functional decline score Info A composite score based on activities of daily living decline, walking ability decline, and incontinence. 13.8
30% better than Virginia average

Virginia average: 19.7

Long-stay resident measures
Significantly above average Virginia avg: 3.9 Info CMS star rating based on long-stay quality measure performance. 5 stars = significantly above average, 1 star = significantly below average.
Need for Help with Daily Activities Increased Info Percent of long-stay residents whose need for help with daily activities has increased 11.6%
31% better than Virginia average

Virginia average: 16.8%

Walking Ability Worsened Info Percent of long-stay residents whose ability to move independently worsened 14.8%
25% better than Virginia average

Virginia average: 19.7%

Low Risk Residents with Bowel/Bladder Incontinence Info Percent of low risk long-stay residents who lose control of their bowels or bladder 14.9%
34% better than Virginia average

Virginia average: 22.6%

Falls with Major Injury Info Percent of long-stay residents experiencing one or more falls with major injury 0.4%
88% better than Virginia average

Virginia average: 3.6%

High Risk Residents with Pressure Ulcers Info Percent of long-stay high risk residents with pressure ulcers 3.9%
27% better than Virginia average

Virginia average: 5.4%

Urinary Tract Infection Info Percent of long-stay residents with a urinary tract infection 0.0%
100% better than Virginia average

Virginia average: 1.5%

Lost Too Much Weight Info Percent of long-stay residents who lose too much weight 1.0%
83% better than Virginia average

Virginia average: 5.9%

Depressive Symptoms Info Percent of long-stay residents who have depressive symptoms 15.0%
In line with Virginia average

Virginia average: 14.9%

Antipsychotic Use Info Percent of long-stay residents who received an antipsychotic medication 10.8%
16% better than Virginia average

Virginia average: 12.9%

Pneumococcal Vaccine Info Percent of long-stay residents assessed and appropriately given the pneumococcal vaccine 64.1%
30% worse than Virginia average

Virginia average: 91.3%

Influenza Vaccine Info Percent of long-stay residents assessed and appropriately given the seasonal influenza vaccine 87.5%
7% worse than Virginia average

Virginia average: 94.0%

Short-stay resident measures
Average Virginia avg: 3.9 Info CMS star rating based on short-stay quality measure performance. 5 stars = much above average, 1 star = much below average.
Pneumococcal Vaccine Info Percent of short-stay residents assessed and appropriately given the pneumococcal vaccine 41.9%
44% worse than Virginia average

Virginia average: 74.9%

Antipsychotic medication increase Info Percent of short-stay residents who newly received an antipsychotic medication 0.4%
70% better than Virginia average

Virginia average: 1.2%

Influenza Vaccine Info Percent of short-stay residents assessed and appropriately given the seasonal influenza vaccine 54.2%
26% worse than Virginia average

Virginia average: 73.6%

Re-hospitalized after SNF stay Info Percentage of short-stay residents who were re-hospitalized after their nursing home admission. 30.5%
39% worse than Virginia average

Virginia average: 22.0%

Emergency department visits Info Percentage of short-stay residents who had an outpatient emergency department visit. 18.5%
58% worse than Virginia average

Virginia average: 11.7%

Falls with major injury Info Percentage of SNF residents who experience falls with major injury during their stay. 0.5%
42% better than Virginia average

Virginia average: 0.8%

Ability to care for self at discharge Info Percentage of residents at or above expected ability to care for themselves at discharge. 47.1%
12% worse than Virginia average

Virginia average: 53.7%

Successful return to home or community Info Rate of successful return to home or community from a skilled nursing facility. 63.0%
25% better than Virginia average

Virginia average: 50.6%

Breakdown by payment type

Medicare

39% of new residents, usually for short-term rehab.

Typical stay 14 days

Private pay

59% of new residents, often for short stays.

Typical stay 2 - 3 months

Medicaid

2% of new residents, often for long-term daily care.

Typical stay 4 - 5 months

Facility Characteristics

Source: CMS Long-Term Care Facility Characteristics (Data as of Jan 2026)

Total residents 75
Medicare
11
14.7% of residents
Medicaid
48
64% of residents
Private pay or other
16
21.3% of residents
Programs & Services
Residents Group

Residents meet regularly to discuss policies, care quality, and activities

Active Resident Council

Organized group of residents that meets regularly to discuss facility policies, quality of life, and activities.

Finances and operations

Based on CMS SNF Cost Report for fiscal year ending in 12/2023.

For-profit
Operated by a single business entity.
Net patient revenue Info Net patient revenue — what the home actually collects for resident care, after contractual allowances, bad debt and discounts are subtracted from its gross charges (CMS cost report, Worksheet G-3). It covers resident care only; money the home earns from other sources is shown separately as "Other income."
$10.7M
Net patient income Info Net patient income: net patient revenue minus the home's total operating expenses. A positive figure means it earns more from resident care than it spends to deliver it; a negative figure means the opposite. It excludes non-operating "other income."
$942.8K
For-profit Operated by a single business entity.
Net patient revenue Info Net patient revenue — what the home actually collects for resident care, after contractual allowances, bad debt and discounts are subtracted from its gross charges (CMS cost report, Worksheet G-3). It covers resident care only; money the home earns from other sources is shown separately as "Other income."
$10.7M Rank #82 / 89Revenue — State benchmarkedThis home is ranked 82nd out of 89 homes in Virginia. Shows this facility's annual revenue compared to the Virginia average. Higher revenue generally means more resources for staffing and capital — read alongside Payroll %.Rankings are based only on facilities in Virginia that report data for that category. Facilities without available data are excluded from the ranking.Click the rank badge to see the full State ranking.Click here to see the full State ranking.
Net patient income Info Net patient income: net patient revenue minus the home's total operating expenses. A positive figure means it earns more from resident care than it spends to deliver it; a negative figure means the opposite. It excludes non-operating "other income."
$942.8K
Other income Info Money the home earns outside of resident care — such as investments, grants, rentals and other non-operating sources (CMS cost report, Worksheet G-3). It is tracked separately from net patient revenue: it is not part of that figure, and it is not included in net patient income.
$1.0K
Payroll costs Info Staff salaries plus wage-related costs — benefits such as payroll taxes, health insurance and retirement — from the home's own accounting records (CMS cost report, Worksheet A). Contract or agency labor is counted separately, under other operating costs. Rank #71 / 89Payroll — State benchmarkedThis home is ranked 71st out of 89 homes in Virginia. Shows total annual staff payroll benchmarked to the Virginia average. Higher payroll investment relative to peers often signals better staffing and less reliance on cheaper contract labor.Rankings are based only on facilities in Virginia that report data for that category. Facilities without available data are excluded from the ranking.Click the rank badge to see the full State ranking.Click here to see the full State ranking.
$5.1M 47.7% of net patient revenue Info Payroll as a share of revenue: staff salaries and wage-related benefits divided by net patient revenue. A higher figure means more of each revenue dollar goes to staff pay. Rank #9 / 89Payroll % — State benchmarkedThis home is ranked 9th out of 89 homes in Virginia. Shows payroll as a percentage of revenue versus the Virginia average. Well-run Virginia facilities typically land around 51–60% — the top third Statewide. Below 25% may signal understaffing or heavy agency use — read with Staffing ratings.Rankings are based only on facilities in Virginia that report data for that category. Facilities without available data are excluded from the ranking.Click the rank badge to see the full State ranking.Click here to see the full State ranking.
Other operating costs Info Everything it costs to run the home apart from payroll — food, utilities, supplies, maintenance, contract labor and administration. Calculated as total operating expense minus payroll (staff salaries and wage-related benefits).
$4.7M
Total costs Info The home's total operating expense for the year — all the costs of running it, salaries included (CMS cost report, Worksheet G-3).
$9.8M

What does this home offer?

Building type icon
Building type icon

Building Type: Mid-rise

Who this home usually serves

TYPE OF STAY

Mix of rehab and long-term care

This home supports both short-term rehab and long-term care, with residents staying for a wide range of durations.

Most new residents arrive under private pay (59% of admissions), and a typical private pay stay runs around 2 - 3 months.

Admissions
509 total

Coverage residents most often arrive under.

Medicare 39%
Private pay 59%
Medicaid 2%
Discharges
515 total

Coverage residents most often leave under.

Medicare 34%
Private pay 64%
Medicaid 1%

Places of interest near Kempsville Health & Rehab Center

Address 5520 Indian River Rd, Virginia Beach, VA 23464 — 3.38 miles to nearest hospital (Sentara Leigh Hospital)

Calculate Travel Distance to Kempsville Health & Rehab Center

Add your location

Address

Compare Nursing Homes around Virginia Beach

The information below is reported by the Virginia Department of Social Services and Department of Health.

5 facilities compared · CMS & VA Dept. of Health data

Westminster-Canterbury on Chesapeake Bay
NH
AL
IL
MC
Virginia Beach (North Virginia Beach)
120
Facility 120
VA AVG 95
Rank #89 / 371
57.5%
Facility 57.5%
VA AVG 85.7%
Rank #236 / 314
-33%
6.56
Facility 6.56
VA AVG 3.74
Rank #3 / 89
-3%+75%
$0
Facility $0
VA AVG $54.3k
Rank #1 / 93
17
Facility 17
VA AVG 38.4
Rank #28 / 90
5.7
Facility 5.7
VA AVG 8.9
Rank #29 / 90
-69A+
47
Facility 47
VA AVG 44
Rank #193 / 449
Westminster-Canterbury On Chesapeake Bay
$41.9M
Facility $41.9M
VA AVG $18.3M
Rank #2 / 89
$25.9M
Facility $25.9M
VA AVG $6.9M
Rank #3 / 89
61.7%
Facility 61.7%
VA AVG 39.7%
Rank #78 / 89
495127
Atlantic Shores
NH
AL
HC
IL
MC
Virginia Beach (Atlantic Shores Retirement Community)
50
Facility 50
VA AVG 95
Rank #306 / 371
71.5%
Facility 71.5%
VA AVG 85.7%
Rank #166 / 314
-17%
4.58
Facility 4.58
VA AVG 3.74
Rank #28 / 89
-64%+22%
$0
Facility $0
VA AVG $54.3k
Rank #1 / 93
23
Facility 23
VA AVG 38.4
Rank #39 / 90
7.7
Facility 7.7
VA AVG 8.9
Rank #44 / 90
-39A+
8
Facility 8
VA AVG 44
Rank #412 / 449
Atlantic Shores Cooperative Association Inc
$30.1M
Facility $30.1M
VA AVG $18.3M
Rank #9 / 89
$17.8M
Facility $17.8M
VA AVG $6.9M
Rank #16 / 89
59%
Facility 59%
VA AVG 39.7%
Rank #59 / 89
495324
Kempsville Health & Rehab Center
NH
HC
MC
RC
Virginia Beach
90
Facility 90
VA AVG 95
Rank #181 / 371
92.2%
Facility 92.2%
VA AVG 85.7%
Rank #31 / 314
+8%
3.45
Facility 3.45
VA AVG 3.74
Rank #56 / 89
+19%-8%
$0
Facility $0
VA AVG $54.3k
Rank #1 / 93
36
Facility 36
VA AVG 38.4
Rank #52 / 90
12.0
Facility 12.0
VA AVG 8.9
Rank #65 / 90
189-
60
Facility 60
VA AVG 44
Rank #109 / 449
Patrick Shuler
$10.7M
Facility $10.7M
VA AVG $18.3M
Rank #82 / 89
$5.1M
Facility $5.1M
VA AVG $6.9M
Rank #71 / 89
47.7%
Facility 47.7%
VA AVG 39.7%
Rank #9 / 89
495232
Rosemont Health and Rehab
NH
HC
MC
RC
Virginia Beach (Windsor Woods)
116
Facility 116
VA AVG 95
Rank #101 / 371
92.4%
Facility 92.4%
VA AVG 85.7%
Rank #29 / 314
+8%
3.22
Facility 3.22
VA AVG 3.74
Rank #71 / 89
+34%-14%
$9.3k
Facility $9.3k
VA AVG $54.3k
Rank #78 / 93
33
Facility 33
VA AVG 38.4
Rank #49 / 90
6.6
Facility 6.6
VA AVG 8.9
Rank #36 / 90
3111-
34
Facility 34
VA AVG 44
Rank #271 / 449
Alverta Robinson
$12.8M
Facility $12.8M
VA AVG $18.3M
Rank #64 / 89
$5.9M
Facility $5.9M
VA AVG $6.9M
Rank #59 / 89
45.7%
Facility 45.7%
VA AVG 39.7%
Rank #24 / 89
495270
Cypress Point Rehabilitation and Nursing
NH
HC
MC
PC
RC
Virginia Beach (Northwest)
90
Facility 90
VA AVG 95
Rank #181 / 371
86.2%
Facility 86.2%
VA AVG 85.7%
Rank #73 / 314
+1%
3.03
Facility 3.03
VA AVG 3.74
Rank #76 / 89
-27%-19%
$15.9k
Facility $15.9k
VA AVG $54.3k
Rank #83 / 93
55
Facility 55
VA AVG 38.4
Rank #75 / 90
13.8
Facility 13.8
VA AVG 8.9
Rank #74 / 90
-85-
61
Facility 61
VA AVG 44
Rank #105 / 449
Richard Bank
$10.3M
Facility $10.3M
VA AVG $18.3M
Rank #81 / 89
$5.2M
Facility $5.2M
VA AVG $6.9M
Rank #84 / 89
50.4%
Facility 50.4%
VA AVG 39.7%
Rank #34 / 89
495234

Financial Assistance for
Nursing Home in Virginia

Kempsville Health & Rehab Center is located in Virginia Beach, Virginia.
Here are the financial assistance programs available to residents in Virginia.

Get Financial aid guidance

Commonwealth Coordinated Care Plus (CCC Plus)

VA Medicaid CCC Plus

Age 65+ or disabled
General Virginia resident, Medicaid-eligible, nursing home-level care need.
Income Limits (2025) ~$2,829/month 300% FBR, individual
Asset Limits $2,000 (individual), $3,000 (couple).
VA

Managed care model; high demand in urban areas.

Benefits
Personal care (5-7 hours/day) Respite (240 hours/year) Adult day care ($65/day) Home modifications ($1,500 avg.)

Virginia Respite Care Grant Program

VA Respite Grant

Age Caregiver of someone 60+
General Virginia resident.
Income Limits ~$2,500/month individual, varies
Asset Limits $40,000 individual
VA

Limited grants; rural/urban balance.

Benefits
In-home respite (up to 30 days/year) Adult day care (~$65/day) Facility respite (up to 5 days)

Adult Services Program

Virginia Adult Services (AS)

Age 60+ (or disabled 18+)
General VA resident, need significant care (2+ ADLs), not Medicaid-eligible.
Income Limits (2025) Varies by locality; typically < ~$2,510/month 200% FPL
Asset Limits Limited assets (excludes home, car); varies by DSS.
VA

Serves ~5,000 annually; focuses on low-income independence.

Benefits
Personal care (4-6 hours/week) Adult day care (~$60/day) Chore services Assessments Respite (~5 days/year)

Auxiliary Grant Program

Virginia Auxiliary Grant (AG)

Age 65+ (or disabled 18+)
General VA resident, living in approved ALF/foster care, SSI-eligible or low-income.
Income Limits (2025) ~$1,041/month (individual, SSI level + $20 disregard); higher with medical deductions.
Asset Limits $2,000 individual
VA

Serves 4,000; personal needs allowance ($90/month).

Benefits
Cash (~$1,400-$1,700/month in 2025, varies by region) for ALF/foster care costs; basic care included

Medicare Savings Program (MSP)

Virginia Medicare Savings Program

Age 65+ or disabled
General VA resident, Medicare Part A/B.
Income Limits (2025) ~$2,510/month (QMB), ~$3,380/month (SLMB), ~$3,598/month (QI)—individual.
Asset Limits $9,430 (individual), $14,130 (couple).
VA

Includes Extra Help for Part D; no waitlist.

Benefits
Covers Part B premiums ($174.70/month) Deductibles ($240/year) Copays (~20%)

Energy Assistance Program (EAP)

Virginia Energy Assistance Program

Age 60+ prioritized
General VA resident, low-income household.
Income Limits (2025) ~$3,970/month 185% FPL
Asset Limits Not assessed.
VA

Fuel, Crisis, Cooling components; serves ~100,000 households.

Benefits
Heating/cooling aid ($300-$1,000/season) Crisis aid ($500 max) Equipment repair (~$250)

VA Aid and Attendance (A&A) and Housebound Benefits

Virginia VA Aid and Attendance/Housebound

Age 65+ or disabled veteran/spouse
General VA resident, wartime service, ADL help (A&A) or homebound.
Income Limits (2025) Net income < ~$1,984/month (veteran with dependent, A&A); pension offsets income.
Asset Limits ~$155,356 net worth
VA

High veteran population; supports rural/urban needs.

Benefits
Cash (~$1,433-$2,642/month veteran, ~$951-$1,318 spouse) for care costs

Property Tax Relief for the Elderly and Disabled

Virginia Property Tax Relief

Age 65+ or disabled
General VA resident, homeowner, income/asset limits vary by locality.
Income Limits (2025) ~$50,000-$75,000/year household, e.g., Fairfax: $72,000; Richmond: $50,000
Asset Limits Varies e.g., Fairfax: $400,000 net worth; Richmond: $100,000
VA

Offered in 90% of localities; saves ~$500-$2,000/year.

Benefits
Tax exemption/deferral (~$500-$2,000/year depending on locality)

Senior Farmers’ Market Nutrition Program (SFMNP)

Virginia SFMNP

Age 60+
General VA resident, low-income.
Income Limits (2025) ~$2,322/month 185% FPL
Asset Limits Not assessed.
VA

Vouchers (~$50-$75/season); serves ~15,000 via AAAs.

Benefits
Vouchers (~$50-$75/season) for produce at farmers’ markets

Frequently Asked Questions about Kempsville Health & Rehab Center

Is Kempsville Health & Rehab Center in a walkable area?

Kempsville Health & Rehab Center has a walk score of 60. Moderately walkable. Some errands can be accomplished on foot, with a mix of nearby amenities.

What is the occupancy rate at Kempsville Health & Rehab Center?

Kempsville Health & Rehab Center's occupancy is 92.2%.

Does Kempsville Health & Rehab Center operate as a for-profit or non-profit?

Kempsville Health & Rehab Center is registered as a for-profit.

Are there photos of Kempsville Health & Rehab Center?

Yes — there are 5 photos of Kempsville Health & Rehab Center in the photo gallery on this page.

What is the address of Kempsville Health & Rehab Center?

Kempsville Health & Rehab Center is located at 5520 Indian River Rd, Virginia Beach, VA 23464.

What is the phone number of Kempsville Health & Rehab Center?

(757) 420-3600 will put you in contact with the team at Kempsville Health & Rehab Center.

Is Kempsville Health & Rehab Center Medicare or Medicaid certified?

Yes — Kempsville Health & Rehab Center is a CMS-certified provider of Medicare and Medicaid.

Guides for Better Senior Living

Care Cost Calculator: See Prices in Your Area

Nursing Home Data Explorer

Don’t Wait Too Long: 7 Red Flag Signs Your Parent Needs Assisted Living Now

The True Cost of Assisted Living in 2025 – And How Families Are Paying For It

Understanding Senior Living Costs: Pricing Models, Discounts & Financial Assistance