Cypress Point Rehabilitation and Nursing
Nursing Home, Hospice Care & Respite Care · Virginia Beach, VA
CMS overall rating Info The Overall CMS Rating is scored from 1 to 5 stars and combines results from health inspections, staffing levels, and quality measures. Health inspections carry the most weight. Staffing and quality scores can increase or decrease the final rating based on performance compared to state and national standards.

Cypress Point Rehabilitation and Nursing

Nursing Home, Hospice Care & Respite Care · Virginia Beach, VA
CMS overall rating Info The Overall CMS Rating is scored from 1 to 5 stars and combines results from health inspections, staffing levels, and quality measures. Health inspections carry the most weight. Staffing and quality scores can increase or decrease the final rating based on performance compared to state and national standards.
Calculator: See prices in your area
Cypress Point Rehabilitation and Nursing accepts Medicare, Medicaid, and private pay.

Overview of Cypress Point Rehabilitation and Nursing

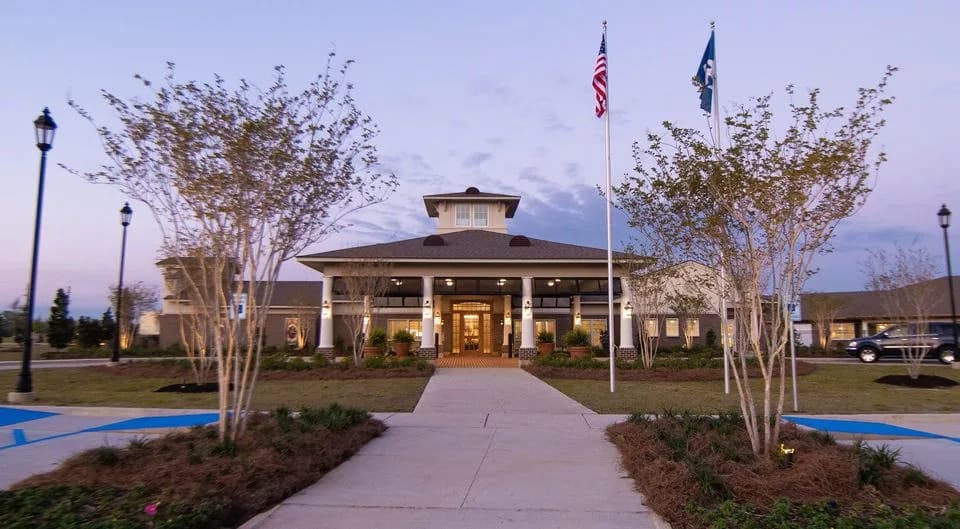
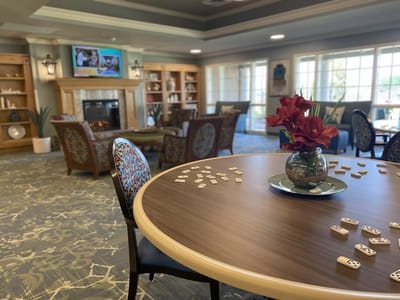
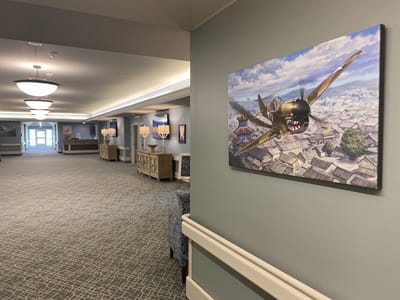
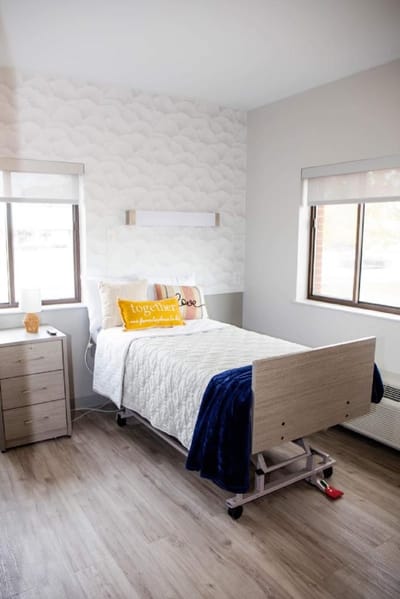
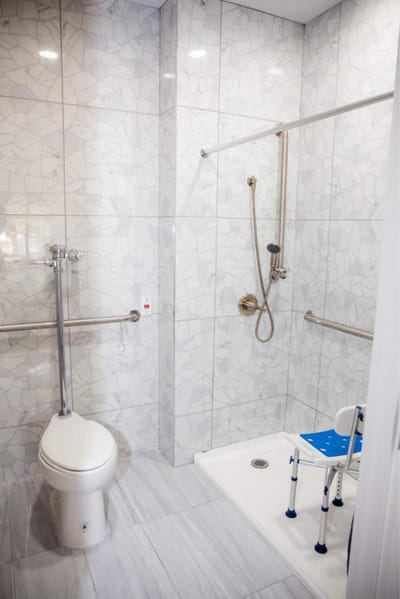
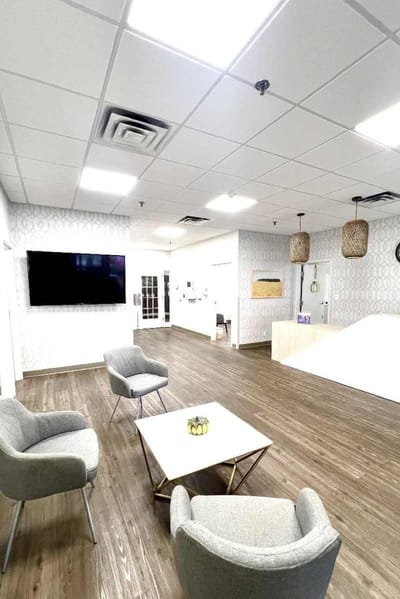
Cypress Point Rehabilitation and Nursing is one of the trusted nursing homes in VB. The rehabilitation center boasts a family-like environment where residents can feel comfortable and secure with the staff to take care of them because the personal touch approach creates a warm and welcoming environment; it’s a home where families can trust that their loved ones are in good hands. Cypress Pointe is the ideal place for seniors looking to heal. 
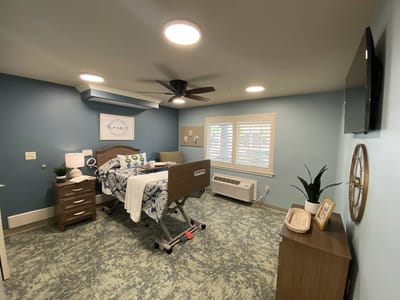
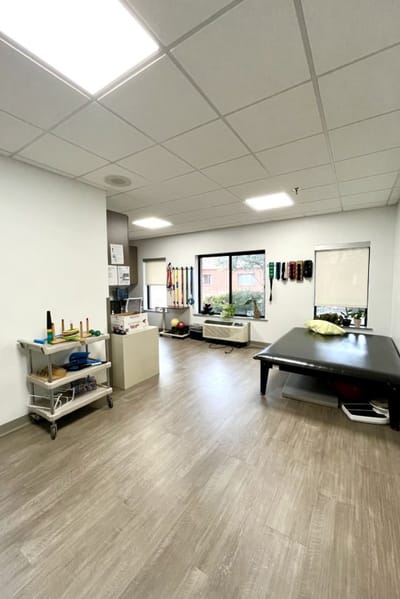
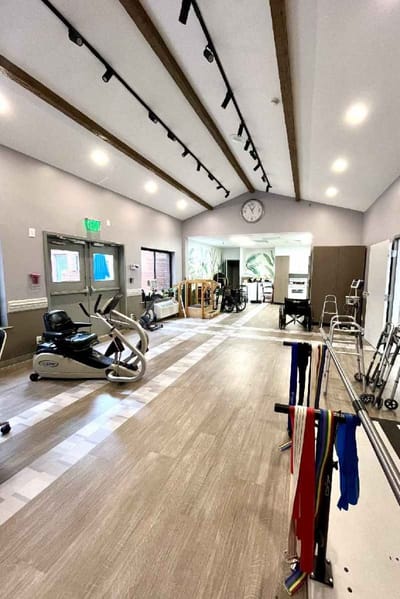
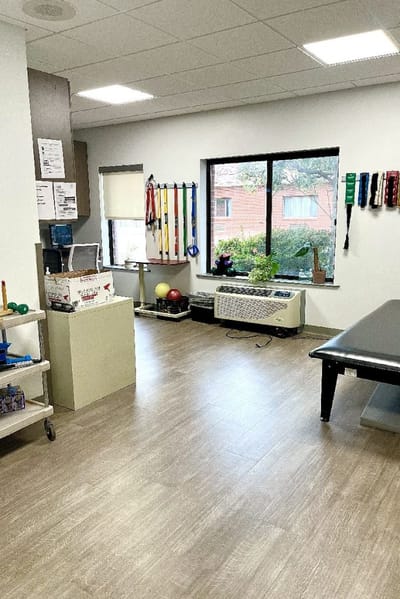
Cypress boasts its clinical excellence found in the advanced medical equipment, 24/7 licensed nurses for skilled nursing such as respiratory care, wound care, and diabetes management. Rehabilitative services offered include an on-site gym with the necessary technology; speech, occupational, and physical therapy for regaining endurance and stability. 

(757) 499-7029

Quality ratings

Measured by Centers for Medicare & Medicaid Services (CMS)

Overall rating Info The Overall CMS Rating combines results from health inspections, staffing levels and quality measures. Health inspections carry the most weight. Staffing and quality scores can increase or decrease the final rating based on performance compared to state and national standards.
▼ 66.7% Below VA avg. ▼ 66.7% Below VA avg.Click the badge to see the full State ranking.Click here to see the full State ranking.
Health Inspection Info Based on the results of the facility's three most recent standard inspections and any complaint investigations. CMS reviews the number, scope, and severity of deficiencies, with more recent findings weighted more heavily.
▼ 27.9% Below VA avg. ▼ 27.9% Below VA avg.Click the badge to see the full State ranking.Click here to see the full State ranking.
Staffing Info Measures average nursing staff hours per resident per day, including Registered Nurses (RNs) and total nursing staff. Ratings are adjusted based on the level of care residents require and are compared to state and national benchmarks.
▼ 59.5% Below VA avg. ▼ 59.5% Below VA avg.Click the badge to see the full State ranking.Click here to see the full State ranking.
Quality Measures Info Based on clinical and physical health indicators reported to CMS, such as hospital readmissions, falls, pressure ulcers, and improvements in mobility. These measures reflect how well residents' health needs are being managed.
▼ 22.0% Below VA avg. ▼ 22.0% Below VA avg.Click the badge to see the full State ranking.Click here to see the full State ranking.

Staffing hours breakdown

Info Daily nursing hours per resident by staff type, reported to CMS. Higher is generally better — compare this facility to state and national averages to see where staffing stands.

Hours per resident per day — compared to Virginia state averages

Total nursing care / resident Info This home is ranked 72nd out of 85 homes in Virginia. Total adjusted nursing hours per resident per day, combining RN, LPN, and aide time. CMS adjusts this for case-mix so facilities can be fairly compared.
3h 2m per day
Rank #72 / 85Nurse hours — State benchmarkedThis home is ranked 72nd out of 85 homes in Virginia. Shows adjusted nurse hours per resident per day benchmarked to the Virginia average, with a ranking across 85 Virginia SNFs. More hours mean more direct care. The national average is about 3.5 hrs; below 3.0 is a red flag.Click the rank badge to see the full State ranking.Click here to see the full State ranking.
This facility Virginia avg (3h 45m per day)
vs Virginia avg
-19%

5 of 6 metrics below state avg

Staff typeHours / Day / Residentvs state avg
Registered Nurse (RN) Info RNs hold the highest nursing license and can assess residents, interpret test results, and direct care plans. More RN hours per day often signals stronger clinical oversight and faster response to health changes. 33m per day ▼ 20% State avg: 41m per day · National avg: 41m per day
LPN / LVN Info Licensed Practical Nurses (LPNs) or Licensed Vocational Nurses (LVNs) deliver routine hands-on care — medication administration, wound dressing, and monitoring vital signs. They work under RN supervision and make up a large share of daily bedside care. 57m per day ▼ 5% State avg: 1h 0m per day · National avg: 52m per day
Nurse Aide Info Certified Nurse Aides (CNAs) provide the most direct day-to-day assistance: bathing, dressing, feeding, and mobility. Nurse aide hours are typically the largest staffing category and directly affect residents' quality of life. 1h 50m per day ▼ 14% State avg: 2h 8m per day · National avg: 2h 21m per day
Total Nursing (Weekend) Info Combined nursing hours (RN + LPN + Nurse Aide) per resident per day on weekends. Staffing often drops on weekends — this figure reveals whether the facility maintains adequate coverage outside of weekday hours. 2h 38m per day ▼ 20% State avg: 3h 19m per day · National avg: 3h 26m per day
Physical Therapist Info Hours per resident per day provided by licensed Physical Therapists (PTs) or PT Assistants. PT services help residents recover mobility after injury or illness and are especially important for post-acute (short-stay) rehabilitation. 5m per day ■ Avg State avg: 5m per day · National avg: 4m per day
RN (Weekend) Info Registered nurse hours specifically on weekends. Facilities sometimes reduce RN presence on Saturdays and Sundays — a low weekend RN figure compared to weekday hours can indicate reduced clinical oversight when most administrative staff are absent. 24m per day ▼ 14% State avg: 28m per day · National avg: 29m per day

Types of Care at Cypress Point Rehabilitation and Nursing

Nursing Home Hospice Care Respite Care

Capacity and availability

This home usually has limited availability

Occupancy between 85% and 95% suggests balanced demand.

Similar occupancy to the Virginia average: 85.7%
Occupancy rate 86.2% Rank #32 / 88Occupancy rate — State benchmarkedThis home is ranked 32nd out of 88 homes in Virginia. Shows this facility's occupancy rate versus the Virginia average, with its Statewide rank out of 88. Higher occupancy signals strong local demand and financial stability.Click the rank badge to see the full State ranking.Click here to see the full State ranking.
Avg. Length of Stay 81 days
Occupancy rate
86.2% Rank #32 / 88Occupancy rate — State benchmarkedThis home is ranked 32nd out of 88 homes in Virginia. Shows this facility's occupancy rate versus the Virginia average, with its Statewide rank out of 88. Higher occupancy signals strong local demand and financial stability.Click the rank badge to see the full State ranking.Click here to see the full State ranking.
Avg. Length of Stay
81 days
Walk Score
Walk Score: 61 / 100 Rank #22 / 90Walk Score — State benchmarkedThis home is ranked 22nd out of 90 homes in Virginia. Shows how walkable this facility's neighborhood is compared to the average Walk Score across Virginia SNFs. Higher scores benefit residents, families, and staff.Click the rank badge to see the full State ranking.Click here to see the full State ranking.
Moderately walkable. Some errands can be accomplished on foot, with a mix of nearby amenities.

About this community

Therapy & Rehabilitation

2 services
Rehabilitation Services
Respite Care

Staffing & Medical

1 service
24-Hour Staffing

Additional Services

1 service
Rehabilitative Care

Dining & Nutrition

Food DescriptionNutrition plans supervised by a registered dietician; nutritious, restaurant-style dining.

Contact Cypress Point Rehabilitation and Nursing

Staffing Data

Reporting period: October 1 – December 31, 2025 (Q4 2025). Source: CMS Payroll-Based Journal report.

Total staff 142
Employees 142
Contractors 0
Staff to resident ratio 2.15:1
29% better than Virginia average
Virginia average ratio: 1.67:1 Virginia average ratio: 1.67:1See full Virginia ranking
Avg staff/day 44
Average shift 7.4 hours
8% worse than Virginia average
Virginia average: 8 hours Virginia average shift: 8 hoursSee full Virginia ranking
Total staff hours (quarter) 30,079

Nursing staff breakdown

Q4 2025 · Oct 1 – Dec 31 More info This data comes from the CMS Payroll-Based Journal report covering October 1 – December 31, 2025.
Registered Nurse

Manages medical care and health needs.

Total count 10
Average shift length Info Average shift length. Calculated as total hours divided by days worked and average staff per day. 6.5 hours

No contractors work on this role.

Licensed Practical Nurse

Assists with medical care and medications.

Total count 32
Average shift length Info Average shift length. Calculated as total hours divided by days worked and average staff per day. 7.5 hours

No contractors work on this role.

Certified Nursing Assistant

Helps with daily care and mobility.

Total count 55
Average shift length Info Average shift length. Calculated as total hours divided by days worked and average staff per day. 7.6 hours

No contractors work on this role.

Contractor staffing

Q4 2025 · Oct 1 – Dec 31 More info This data comes from the CMS Payroll-Based Journal report covering October 1 – December 31, 2025.

Total hours from contractors

0%

0 contractor hours this quarter

No contractor roles were reported this quarter.

Staff by category

Q4 2025 · Oct 1 – Dec 31 More info This data comes from the CMS Payroll-Based Journal report covering October 1 – December 31, 2025.
Certified Nursing Assistant5505513,78892100%7.6
Licensed Practical Nurse320326,74092100%7.5
Registered Nurse100101,78192100%6.5
RN Director of Nursing9091,7428896%8.3
Clinical Nurse Specialist8081,4357784%7.6
Respiratory Therapy Technician3036267076%5.2
Speech Language Pathologist5055926975%7.6
Physical Therapy Aide4045646874%5
Administrator1015596672%8.5
Dietitian1015076470%7.9
Other Dietary Services Staff1014675863%8
Mental Health Service Worker1014636166%7.6
Nurse Practitioner2024245661%7.6
Qualified Social Worker5053205459%5.2
Physical Therapy Assistant505741921%3.9
55 Certified Nursing Assistant
% of Days 100%
32 Licensed Practical Nurse
% of Days 100%
10 Registered Nurse
% of Days 100%
9 RN Director of Nursing
% of Days 96%
8 Clinical Nurse Specialist
% of Days 84%
3 Respiratory Therapy Technician
% of Days 76%
5 Speech Language Pathologist
% of Days 75%
4 Physical Therapy Aide
% of Days 74%
1 Administrator
% of Days 72%
1 Dietitian
% of Days 70%
1 Other Dietary Services Staff
% of Days 63%
1 Mental Health Service Worker
% of Days 66%
2 Nurse Practitioner
% of Days 61%
5 Qualified Social Worker
% of Days 59%
5 Physical Therapy Assistant
% of Days 21%

Penalties and fines

Federal penalties imposed by CMS for regulatory violations, including civil money penalties (fines) and denials of payment for new Medicare/Medicaid admissions.

Source: CMS Penalties Database

No penalties in the past 3 years

No civil money penalties or payment denials were reported in the last 3 years.

Quality of care over time

These measures show how residents usually do over time at this home, based on health outcomes and preventive care.

High-risk clinical events score Info A composite score based on pressure ulcers, falls with injury, weight loss, walking ability decline, and activities of daily living decline. 9.4
8% better than Virginia average

Virginia average: 10.1

Functional decline score Info A composite score based on activities of daily living decline, walking ability decline, and incontinence. 19.7
In line with Virginia average

Virginia average: 19.7

Long-stay resident measures
Above average Virginia avg: 3.9 Info CMS star rating based on long-stay quality measure performance. 5 stars = significantly above average, 1 star = significantly below average.
Need for Help with Daily Activities Increased Info Percent of long-stay residents whose need for help with daily activities has increased 14.6%
13% better than Virginia average

Virginia average: 16.8%

Walking Ability Worsened Info Percent of long-stay residents whose ability to move independently worsened 18.8%
5% better than Virginia average

Virginia average: 19.7%

Low Risk Residents with Bowel/Bladder Incontinence Info Percent of low risk long-stay residents who lose control of their bowels or bladder 25.6%
13% worse than Virginia average

Virginia average: 22.6%

Falls with Major Injury Info Percent of long-stay residents experiencing one or more falls with major injury 2.8%
22% better than Virginia average

Virginia average: 3.6%

High Risk Residents with Pressure Ulcers Info Percent of long-stay high risk residents with pressure ulcers 4.9%
9% better than Virginia average

Virginia average: 5.4%

Urinary Tract Infection Info Percent of long-stay residents with a urinary tract infection 3.2%
110% worse than Virginia average

Virginia average: 1.5%

Lost Too Much Weight Info Percent of long-stay residents who lose too much weight 5.8%
In line with Virginia average

Virginia average: 5.9%

Depressive Symptoms Info Percent of long-stay residents who have depressive symptoms 19.5%
31% worse than Virginia average

Virginia average: 14.9%

Antipsychotic Use Info Percent of long-stay residents who received an antipsychotic medication 15.9%
24% worse than Virginia average

Virginia average: 12.9%

Pneumococcal Vaccine Info Percent of long-stay residents assessed and appropriately given the pneumococcal vaccine 78.8%
14% worse than Virginia average

Virginia average: 91.3%

Influenza Vaccine Info Percent of long-stay residents assessed and appropriately given the seasonal influenza vaccine 96.2%
In line with Virginia average

Virginia average: 94.0%

Hospitalizations per 1,000 days Info Number of hospitalizations per 1,000 long-stay resident days. 2.32
59% worse than Virginia average

Virginia average: 1.46

ED visits per 1,000 days Info Number of outpatient emergency department visits per 1,000 long-stay resident days. 1.21
14% better than Virginia average

Virginia average: 1.41

Short-stay resident measures
Average Virginia avg: 3.9 Info CMS star rating based on short-stay quality measure performance. 5 stars = much above average, 1 star = much below average.
Pneumococcal Vaccine Info Percent of short-stay residents assessed and appropriately given the pneumococcal vaccine 79.2%
6% better than Virginia average

Virginia average: 74.9%

Antipsychotic medication increase Info Percent of short-stay residents who newly received an antipsychotic medication 1.7%
39% worse than Virginia average

Virginia average: 1.2%

Influenza Vaccine Info Percent of short-stay residents assessed and appropriately given the seasonal influenza vaccine 68.6%
7% worse than Virginia average

Virginia average: 73.6%

Re-hospitalized after SNF stay Info Percentage of short-stay residents who were re-hospitalized after their nursing home admission. 26.1%
19% worse than Virginia average

Virginia average: 22.0%

Emergency department visits Info Percentage of short-stay residents who had an outpatient emergency department visit. 5.9%
50% better than Virginia average

Virginia average: 11.7%

Falls with major injury Info Percentage of SNF residents who experience falls with major injury during their stay. 0.0%
100% better than Virginia average

Virginia average: 0.8%

Ability to care for self at discharge Info Percentage of residents at or above expected ability to care for themselves at discharge. 50.0%
7% worse than Virginia average

Virginia average: 53.7%

Successful return to home or community Info Rate of successful return to home or community from a skilled nursing facility. 32.0%
37% worse than Virginia average

Virginia average: 50.6%

Breakdown by payment type

Medicare

23% of new residents, usually for short-term rehab.

Typical stay 26 days

Private pay

51% of new residents, often for short stays.

Typical stay 22 days

Medicaid

26% of new residents, often for long-term daily care.

Typical stay 7 - 8 months

Facility Characteristics

Source: CMS Long-Term Care Facility Characteristics (Data as of Jan 2026)

Total residents 66
Medicare
12
18.2% of residents
Medicaid
47
71.2% of residents
Private pay or other
7
10.6% of residents
Programs & Services
Residents Group

Residents meet regularly to discuss policies, care quality, and activities

Nurse Aide Training

State-approved Nurse Aide Training and Competency Evaluation Program on-site

Active Resident Council

Organized group of residents that meets regularly to discuss facility policies, quality of life, and activities.

Finances and operations

Privately-owned community
Operated by a business corporation.
Home revenue
$10.8M
Profit
$1.1M
Privately-owned community Operated by a business corporation.
Home revenue
$10.8M Rank #78 / 85Revenue — State benchmarkedThis home is ranked 78th out of 85 homes in Virginia. Shows this facility's annual revenue compared to the Virginia SNF average. Higher revenue generally means more resources for staffing and capital — read alongside Payroll %.Click the rank badge to see the full State ranking.Click here to see the full State ranking.
Profit
$1.1M
Payroll costs Info The portion of the home's budget spent on staff, including nurses, caregivers, and other employees who support care and operations. Rank #80 / 85Payroll — State benchmarkedThis home is ranked 80th out of 85 homes in Virginia. Shows total annual staff payroll benchmarked to the Virginia average. Higher payroll investment relative to peers often signals better staffing and less reliance on cheaper contract labor.Click the rank badge to see the full State ranking.Click here to see the full State ranking.
$5.3M
49.1% of revenue Rank #32 / 85Payroll % — State benchmarkedThis home is ranked 32nd out of 85 homes in Virginia. Shows payroll as a percentage of revenue versus the Virginia average. Well-run Virginia SNFs typically land around 51–60% — the top third Statewide. Below 25% may signal understaffing or heavy agency use — read with Staffing ratings.Click the rank badge to see the full State ranking.Click here to see the full State ranking.
Other operating costs Info All remaining costs needed to run the home, such as food, utilities, building maintenance, supplies and administrative expenses.
$4.4M
Total costs $9.7M

Who this home usually serves

TYPE OF STAY

Mix of rehab and long-term care

This home supports both short-term rehab and long-term care, with residents staying for a wide range of durations.

Places of interest near Cypress Point Rehabilitation and Nursing

Address 13.0 miles from city center Info Estimated distance in miles from Virginia Beach's city center to Cypress Point Rehabilitation and Nursing's address, calculated via Google Maps. — 0.5 miles to nearest hospital (Planned Parenthood - Virginia Beach Health Center)

Calculate Travel Distance to Cypress Point Rehabilitation and Nursing

Add your location

Address

Financial Assistance for
Nursing Home in Virginia

Cypress Point Rehabilitation and Nursing is located in Virginia Beach, Virginia.
Here are the financial assistance programs available to residents in Virginia.

Get Financial aid guidance

Commonwealth Coordinated Care Plus (CCC Plus)

VA Medicaid CCC Plus

Age 65+ or disabled
General Virginia resident, Medicaid-eligible, nursing home-level care need.
Income Limits (2025) ~$2,829/month 300% FBR, individual
Asset Limits $2,000 (individual), $3,000 (couple).
VA

Managed care model; high demand in urban areas.

Benefits
Personal care (5-7 hours/day) Respite (240 hours/year) Adult day care ($65/day) Home modifications ($1,500 avg.)

Virginia Respite Care Grant Program

VA Respite Grant

Age Caregiver of someone 60+
General Virginia resident.
Income Limits ~$2,500/month individual, varies
Asset Limits $40,000 individual
VA

Limited grants; rural/urban balance.

Benefits
In-home respite (up to 30 days/year) Adult day care (~$65/day) Facility respite (up to 5 days)

Adult Services Program

Virginia Adult Services (AS)

Age 60+ (or disabled 18+)
General VA resident, need significant care (2+ ADLs), not Medicaid-eligible.
Income Limits (2025) Varies by locality; typically < ~$2,510/month 200% FPL
Asset Limits Limited assets (excludes home, car); varies by DSS.
VA

Serves ~5,000 annually; focuses on low-income independence.

Benefits
Personal care (4-6 hours/week) Adult day care (~$60/day) Chore services Assessments Respite (~5 days/year)

Auxiliary Grant Program

Virginia Auxiliary Grant (AG)

Age 65+ (or disabled 18+)
General VA resident, living in approved ALF/foster care, SSI-eligible or low-income.
Income Limits (2025) ~$1,041/month (individual, SSI level + $20 disregard); higher with medical deductions.
Asset Limits $2,000 individual
VA

Serves 4,000; personal needs allowance ($90/month).

Benefits
Cash (~$1,400-$1,700/month in 2025, varies by region) for ALF/foster care costs; basic care included

Medicare Savings Program (MSP)

Virginia Medicare Savings Program

Age 65+ or disabled
General VA resident, Medicare Part A/B.
Income Limits (2025) ~$2,510/month (QMB), ~$3,380/month (SLMB), ~$3,598/month (QI)—individual.
Asset Limits $9,430 (individual), $14,130 (couple).
VA

Includes Extra Help for Part D; no waitlist.

Benefits
Covers Part B premiums ($174.70/month) Deductibles ($240/year) Copays (~20%)

Energy Assistance Program (EAP)

Virginia Energy Assistance Program

Age 60+ prioritized
General VA resident, low-income household.
Income Limits (2025) ~$3,970/month 185% FPL
Asset Limits Not assessed.
VA

Fuel, Crisis, Cooling components; serves ~100,000 households.

Benefits
Heating/cooling aid ($300-$1,000/season) Crisis aid ($500 max) Equipment repair (~$250)

VA Aid and Attendance (A&A) and Housebound Benefits

Virginia VA Aid and Attendance/Housebound

Age 65+ or disabled veteran/spouse
General VA resident, wartime service, ADL help (A&A) or homebound.
Income Limits (2025) Net income < ~$1,984/month (veteran with dependent, A&A); pension offsets income.
Asset Limits ~$155,356 net worth
VA

High veteran population; supports rural/urban needs.

Benefits
Cash (~$1,433-$2,642/month veteran, ~$951-$1,318 spouse) for care costs

Property Tax Relief for the Elderly and Disabled

Virginia Property Tax Relief

Age 65+ or disabled
General VA resident, homeowner, income/asset limits vary by locality.
Income Limits (2025) ~$50,000-$75,000/year household, e.g., Fairfax: $72,000; Richmond: $50,000
Asset Limits Varies e.g., Fairfax: $400,000 net worth; Richmond: $100,000
VA

Offered in 90% of localities; saves ~$500-$2,000/year.

Benefits
Tax exemption/deferral (~$500-$2,000/year depending on locality)

Senior Farmers’ Market Nutrition Program (SFMNP)

Virginia SFMNP

Age 60+
General VA resident, low-income.
Income Limits (2025) ~$2,322/month 185% FPL
Asset Limits Not assessed.
VA

Vouchers (~$50-$75/season); serves ~15,000 via AAAs.

Benefits
Vouchers (~$50-$75/season) for produce at farmers’ markets

Compare Nursing Home around Virginia Beach

The information below is reported by the Virginia Department of Social Services and Department of Health.

4 facilities compared · CMS & VA Dept. of Health data

Filter by care type
Atlantic Shores
NH

Nursing Home Licensed facility providing 24/7 skilled nursing care for residents with complex, ongoing medical needs. Staffed by RNs, LPNs, and CNAs. Inspected and star-rated annually by CMS. Accepts Medicare (short-term rehab) and Medicaid (long-term care).

AL

Assisted Living A licensed, long-term care setting for seniors or individuals with disabilities who need help with daily activities — like bathing, dressing, and medication management — but not 24-hour skilled nursing. Offers housing, meals, and around-the-clock support while aiming to maximize resident independence.

IL

Independent Living Lifestyle-focused communities for older adults offering dining, activities, and transportation with minimal personal care. Best for active, independent seniors who want community without medical support.

MC

Memory Care Secured, specialized care for people living with Alzheimer's or dementia. Staff trained in cognitive impairment, with higher staff-to-resident ratios and an environment designed to reduce confusion and wandering risk.

Virginia Beach (Atlantic Shores Retirement Community)50 71.5% -17%4.58 -62%+22%$0237.7-39A+ 8 Atlantic Shores Cooperative Association Inc$46.2M$18.5M40.1%495324
Norview Heights Rehabilitation and Nursing
NH

Nursing Home Licensed facility providing 24/7 skilled nursing care for residents with complex, ongoing medical needs. Staffed by RNs, LPNs, and CNAs. Inspected and star-rated annually by CMS. Accepts Medicare (short-term rehab) and Medicaid (long-term care).

AL

Assisted Living A licensed, long-term care setting for seniors or individuals with disabilities who need help with daily activities — like bathing, dressing, and medication management — but not 24-hour skilled nursing. Offers housing, meals, and around-the-clock support while aiming to maximize resident independence.

IL

Independent Living Lifestyle-focused communities for older adults offering dining, activities, and transportation with minimal personal care. Best for active, independent seniors who want community without medical support.

RC

Respite Care Short-term temporary care — days to weeks — to give family caregivers a break. Full care provided during the stay. Often used after hospitalization or to trial a facility before a permanent placement decision.

Norfolk (Fairmont Park)60 90.8% +6%3.27 -50%-13%$0469.2150- 30 Kelli Marshall-Hodges$7.2M$4.2M57.8%495309
Kempsville Health & Rehab Center
NH

Nursing Home Licensed facility providing 24/7 skilled nursing care for residents with complex, ongoing medical needs. Staffed by RNs, LPNs, and CNAs. Inspected and star-rated annually by CMS. Accepts Medicare (short-term rehab) and Medicaid (long-term care).

AL

Assisted Living A licensed, long-term care setting for seniors or individuals with disabilities who need help with daily activities — like bathing, dressing, and medication management — but not 24-hour skilled nursing. Offers housing, meals, and around-the-clock support while aiming to maximize resident independence.

IL

Independent Living Lifestyle-focused communities for older adults offering dining, activities, and transportation with minimal personal care. Best for active, independent seniors who want community without medical support.

MC

Memory Care Secured, specialized care for people living with Alzheimer's or dementia. Staff trained in cognitive impairment, with higher staff-to-resident ratios and an environment designed to reduce confusion and wandering risk.

Virginia Beach90 92.2% +8%3.45 +25%-8%$03612.0183- 60 Patrick Shuler$10.7M$6.4M59.7%495232
Cypress Point Rehabilitation and Nursing
NH

Nursing Home Licensed facility providing 24/7 skilled nursing care for residents with complex, ongoing medical needs. Staffed by RNs, LPNs, and CNAs. Inspected and star-rated annually by CMS. Accepts Medicare (short-term rehab) and Medicaid (long-term care).

HC

Home Care Professional care delivered in the person's own home — from companionship and errands to skilled nursing and therapy. Allows seniors to age in place. Medicare covers skilled home health when medically necessary.

RC

Respite Care Short-term temporary care — days to weeks — to give family caregivers a break. Full care provided during the stay. Often used after hospitalization or to trial a facility before a permanent placement decision.

Virginia Beach (Northwest)90 86.2% +1%3.03 -24%-19%$05513.8-83- 61 Richard Bank$10.8M$5.3M49.1%495234

Frequently Asked Questions about Cypress Point Rehabilitation and Nursing

What neighborhood is Cypress Point Rehabilitation and Nursing in?

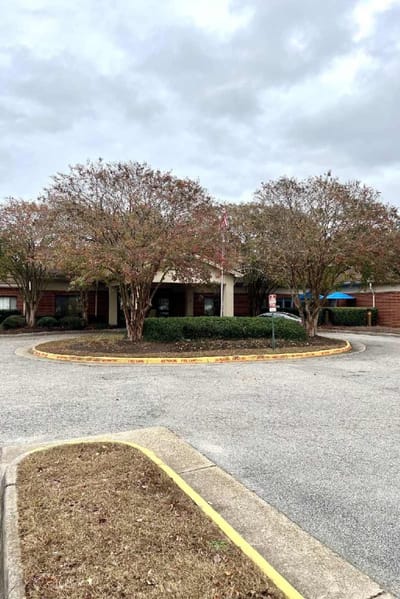
Cypress Point Rehabilitation and Nursing is in the Northwest neighborhood.

Is Cypress Point Rehabilitation and Nursing in a walkable area?

Cypress Point Rehabilitation and Nursing has a walk score of 61. Moderately walkable. Some errands can be accomplished on foot, with a mix of nearby amenities.

Are there photos of Cypress Point Rehabilitation and Nursing?

Yes — there are 13 photos of Cypress Point Rehabilitation and Nursing in the photo gallery on this page.

What is the phone number of Cypress Point Rehabilitation and Nursing?

(757) 499-7029 will put you in contact with the team at Cypress Point Rehabilitation and Nursing.

Is Cypress Point Rehabilitation and Nursing Medicare or Medicaid certified?

Yes — Cypress Point Rehabilitation and Nursing is a CMS-certified provider of Medicare and Medicaid.

Guides for Better Senior Living

Care Cost Calculator: See Prices in Your Area

Nursing Home Data Explorer

Don’t Wait Too Long: 7 Red Flag Signs Your Parent Needs Assisted Living Now

The True Cost of Assisted Living in 2025 – And How Families Are Paying For It

Understanding Senior Living Costs: Pricing Models, Discounts & Financial Assistance

Explore Open Rooms
1 Contact details
2 What type of senior care service are you looking for?
3 What budget do you have in mind for senior care?
4 How soon do you need to find care?
5 Additional details

Thank you for your interest!

Our team will be in touch shortly to help with next steps.