Conway Healthcare and Rehabilitation Center
Nursing Home & Respite Care · Conway, AR
CMS overall rating Info CMS (the Centers for Medicare & Medicaid Services) is the federal agency that rates nursing home quality. Its Overall Rating runs from 1 to 5 stars, combining health inspections, staffing, and quality measures, with inspections weighted most heavily.

Conway Healthcare and Rehabilitation Center

Nursing Home & Respite Care · Conway, AR
CMS overall rating Info CMS (the Centers for Medicare & Medicaid Services) is the federal agency that rates nursing home quality. Its Overall Rating runs from 1 to 5 stars, combining health inspections, staffing, and quality measures, with inspections weighted most heavily.
Calculator: See prices in your area
Conway Healthcare and Rehabilitation Center accepts Medicaid, Medicare, and private pay.

Overview of Conway Healthcare and Rehabilitation Center

Faulkner SNF Operations, LLC, owner Melissa Poore, and administrator Kathern Fisher run Conway Healthcare and Rehabilitation Center, a 105-bed nursing home on Dave Ward Drive in Conway, Arkansas. About 63 percent of the beds are currently occupied, so the building usually has openings for new placements. The average stay lasts 247 days, which means daily floor routines focus mostly on long-term residential care alongside standard post-hospital therapy.

An on-staff doctor and a 24-hour nursing team manage the daily schedule, averaging 4 hours and 8 minutes of direct care per resident each day. Registered nurses, practical nurses, and aides divide these hours to handle routine clinical treatments and physical rehabilitation. If you are planning a visit, note that the neighborhood has a walk score of 2, making it entirely car-dependent, so you will need a vehicle for any errands outside the property.

State health department surveys have historically flagged operational issues here with how medications are handled, general resident safety protocols, and basic building maintenance. Talking through these old state records with the director of nursing will show you what specific corrective steps the team has built into their current tracking routines.

Prospective residents can get in touch with the admissions desk to check room availability or to walk through the standard entry paperwork.

Quality ratings

Measured by Centers for Medicare & Medicaid Services (CMS)

Overall rating Info The Overall CMS Rating combines results from health inspections, staffing levels and quality measures. Health inspections carry the most weight. Staffing and quality scores can increase or decrease the final rating based on performance compared to state and national standards.
▼ 4.4% Below AR avg. ▼ 4.4% Below AR avg.AR average: 3.1Click the badge to see the full State ranking.Click here to see the full State ranking.
Health Inspection Info Based on the results of the facility's three most recent standard inspections and any complaint investigations. CMS reviews the number, scope, and severity of deficiencies, with more recent findings weighted more heavily.
▼ 30.8% Below AR avg. ▼ 30.8% Below AR avg.AR average: 2.9Click the badge to see the full State ranking.Click here to see the full State ranking.
Staffing Info Measures average nursing staff hours per resident per day, including Registered Nurses (RNs) and total nursing staff. Ratings are adjusted based on the level of care residents require and are compared to state and national benchmarks.
▼ 5.8% Below AR avg. ▼ 5.8% Below AR avg.AR average: 3.2Click the badge to see the full State ranking.Click here to see the full State ranking.
Quality Measures Info Based on clinical and physical health indicators reported to CMS, such as hospital readmissions, falls, pressure ulcers, and improvements in mobility. These measures reflect how well residents' health needs are being managed.
▲ 36.6% Above AR avg. ▲ 36.6% Above AR avg.AR average: 3.7Click the badge to see the full State ranking.Click here to see the full State ranking.

Staffing hours breakdown

Info Daily nursing hours per resident by staff type, reported to CMS. Higher is generally better — compare this facility to state and national averages to see where staffing stands.

Hours per resident per day — compared to Arkansas state averages

Total nursing care / resident Info Total adjusted nursing hours per resident per day, combining RN, LPN, and aide time. CMS adjusts this for case-mix so facilities can be fairly compared.
4h 8m per day
This facility Arkansas avg (4h 40m per day)
vs Arkansas avg
-12%

3 of 6 metrics below state avg

Standout metric Nurse Aide is +9% above state avg
Staff typeHours / Day / Residentvs state avg
Registered Nurse (RN) Info RNs hold the highest nursing license and can assess residents, interpret test results, and direct care plans. More RN hours per day often signals stronger clinical oversight and faster response to health changes. 23m per day ▼ 6% State avg: 24m per day · National avg: 41m per day
LPN / LVN Info Licensed Practical Nurses (LPNs) or Licensed Vocational Nurses (LVNs) deliver routine hands-on care — medication administration, wound dressing, and monitoring vital signs. They work under RN supervision and make up a large share of daily bedside care. 50m per day ▼ 12% State avg: 57m per day · National avg: 52m per day
Nurse Aide Info Certified Nurse Aides (CNAs) provide the most direct day-to-day assistance: bathing, dressing, feeding, and mobility. Nurse aide hours are typically the largest staffing category and directly affect residents' quality of life. 2h 58m per day ▲ 9% State avg: 2h 44m per day · National avg: 2h 21m per day
Weekend Total Nursing Info Combined nursing hours (RN + LPN + Nurse Aide) per resident per day on weekends. Staffing often drops on weekends — this figure reveals whether the facility maintains adequate coverage outside of weekday hours. 3h 48m per day ▲ 9% State avg: 3h 29m per day · National avg: 3h 26m per day
Physical Therapist Info Hours per resident per day provided by licensed Physical Therapists (PTs) or PT Assistants. PT services help residents recover mobility after injury or illness and are especially important for post-acute (short-stay) rehabilitation. 1m per day ▼ 53% State avg: 2m per day · National avg: 4m per day
Weekend RN Info Registered nurse hours specifically on weekends. Facilities sometimes reduce RN presence on Saturdays and Sundays — a low weekend RN figure compared to weekday hours can indicate reduced clinical oversight when most administrative staff are absent. 17m per day ▲ 5% State avg: 16m per day · National avg: 29m per day

Capacity and availability

Avg. Length of Stay
247 days
Bed community size
105-bed community Rank #108 / 330Bed count — State benchmarkedThis home is ranked 108th out of 330 homes in Arkansas. Shows this facility's certified or reported bed count compared to other Arkansas facilities. Larger communities may offer more amenities, programs, and on-site services for residents and families.Rankings are based only on facilities in Arkansas that report data for that category. Facilities without available data are excluded from the ranking.Click the rank badge to see the full State ranking.Click here to see the full State ranking.
A larger shared setting that may offer more common spaces and organized community services.
Walk Score
Walk Score: 2 / 100 Rank #388 / 419Walk Score — State benchmarkedThis home is ranked 388th out of 419 homes in Arkansas. Shows how walkable this facility's neighborhood is compared to the average Walk Score across Arkansas facilities. Higher scores benefit residents, families, and staff.Rankings are based only on facilities in Arkansas that report data for that category. Facilities without available data are excluded from the ranking.Click the rank badge to see the full State ranking.Click here to see the full State ranking.
Car-dependent. Most errands require a car, with limited nearby walkable options.

About this community

Occupancy

Occupancy rate
63%
Lower than the Arkansas average: 71.3%
Occupied beds
66 / 105
Average occupied beds in Arkansas homes 77 beds

License Details

Facility TypeSkilled Nursing Facility With Dual Certified Beds (medicaid/medicare)
CountyFaulkner
CMS Certification Number045245
Certification TypeMedicaid / Medicare

Ownership & Operating Entity

Conway Healthcare and Rehabilitation Center is legally operated by Faulkner SNF Operations, LLC, and administered by Kathern Fisher.

Owner NameFaulkner Snf Operations, LLC
Profit StatusFor-profit

Type Of Units

Medicaid and Medicare
105 units
Total beds
105 units

Payment & Insurance

1 service
Accept Medicaid

Therapy & Rehabilitation

1 service
Rehabilitation Services

Staffing & Medical

2 services
Doctor on Staff
24-Hour Staffing

Contact Information

Fax501-329-4916

Contact Conway Healthcare and Rehabilitation Center

Inspection History

In Arkansas, the Department of Human Services, Office of Long Term Care is authorized to conduct unannounced inspections and issue official quality of care reports for all senior living providers.

Since 2021 · 5 years of data 49 deficiencies

Inspection Scorecard Info This scorecard compares key inspection, deficiency, and complaint metrics at this facility against the Arkansas state average. Metrics rated ≥15% worse than average are highlighted in red; those ≥15% better are highlighted in green.

Since 2021 vs. Arkansas state average
Overall vs. AR average 2 Worse Metrics worse than Arkansas average:
• Total deficiencies (133% above)
• Deficiencies per year (133% above)
0 Better No metrics in this bucket.
Latest Inspection August 21, 2025 Complaint Investigation

Deficiencies Info Deficiencies are formal regulatory issues recorded during state inspections.

This FacilityAR Averagevs. AR Avg
Total deficiencies Info Formal regulatory issues recorded by inspectors across all inspection types. 4921 This facility has 133% more total deficiencies than a typical Arkansas nursing home (49 vs. AR avg 21).↑ 133% worse
Deficiencies per year Info Average deficiencies per year since 2021. 9.84.2 This facility has 133% more deficiencies per year than a typical Arkansas nursing home (9.8 vs. AR avg 4.2).↑ 133% worse

Inspection Reports Summary Info An editor-reviewed summary of the themes and findings across this facility's recent inspection reports.

  • August 21, 2025 complaint investigation found 5 deficiencies including improper discharge of Resident #81 despite an active appeal and medication errors causing hospitalization of Resident #52.
  • May 6, 2024 complaint investigation identified Immediate Jeopardy due to repeated resident-to-resident verbal and physical abuse, later removed after removal plan and staff training.
  • October 31, 2024 routine inspection found 4 environmental safety hazards including floor clutter and detached wall rails and vinyl posing fall risks, with no repairs documented.

Health Inspection History

Inspections since 2023
Total health inspections 5

Arkansas average 4.2


Last Health inspection on Aug 2025

Total health citations
23

Arkansas average 21.8

Citations per inspection
4.6

Arkansas average 5.32


Health citations are formal notices following inspections when they fail to comply with safety and care standards.

18 of 23 citations resulted from standard inspections; 2 of 23 resulted from complaint investigations; and 3 of 23 came from combined inspections (standard and complaint).

Breakdown of citation severity (last 3 years)
Critical health citations
1
150% worse than Arkansas average

Arkansas average: 0.4


Serious health citations
0
100% better than Arkansas average

Arkansas average: 0.2

1 critical citation Arkansas average: 0.4

0 serious citations Arkansas average: 0.2

22 moderate citations Arkansas average: 20.9

0 minor citations Arkansas average: 0.4
Citations history (last 3 years)
Infection Control moderate citation Aug 21, 2025
Corrected

Pharmacy moderate citation Aug 21, 2025
Corrected

Pharmacy moderate citation Aug 21, 2025
Corrected

Pharmacy moderate citation Aug 21, 2025
Corrected

Staffing Data

Reporting period: October 1 – December 31, 2025 (Q4 2025). Source: CMS Payroll-Based Journal report.

Total staff 119
Employees 100
Contractors 19
Staff to resident ratio 1.63 : 1
0% compared with Arkansas average
Arkansas average ratio: 1.59 : 1 Arkansas average ratio: 1.59 : 1See full Arkansas ranking
Avg staff/day 41
Average shift 7.6 hours
5% worse than Arkansas average
Arkansas average: 8 hours Arkansas average shift: 8 hoursSee full Arkansas ranking
Total staff hours (quarter) 28,514

Nursing staff breakdown

Q4 2025 · Oct 1 – Dec 31 More info This data comes from the CMS Payroll-Based Journal report covering October 1 – December 31, 2025.
Registered Nurse

Manages medical care and health needs.

RN Staff Info All 6 RN Staff are full-time employees. No contractors work on this role. 6
Average shift length Info Average shift length. Calculated as total hours divided by days worked and average staff per day. 6.2 hours
Licensed Practical Nurse

Assists with medical care and medications.

LPN Staff Info All 17 LPN Staff are full-time employees. No contractors work on this role. 17
Average shift length Info Average shift length. Calculated as total hours divided by days worked and average staff per day. 8.4 hours
Certified Nursing Assistant

Helps with daily care and mobility.

CNA Staff Info All 56 CNA Staff are full-time employees. No contractors work on this role. 56
Average shift length Info Average shift length. Calculated as total hours divided by days worked and average staff per day. 7.6 hours

Contractor staffing

Q4 2025 · Oct 1 – Dec 31 More info This data comes from the CMS Payroll-Based Journal report covering October 1 – December 31, 2025.

Total hours from contractors

5.1%

1,449 contractor hours this quarter

Physical Therapy Assistant: 3 Clinical Nurse Specialist: 3 Qualified Social Worker: 3 Respiratory Therapy Technician: 3 Physical Therapy Aide: 3 Speech Language Pathologist: 1 Medical Director: 1 Occupational Therapy Assistant: 1 Occupational Therapy Aide: 1

Staff by category

Q4 2025 · Oct 1 – Dec 31 More info This data comes from the CMS Payroll-Based Journal report covering October 1 – December 31, 2025.
Certified Nursing Assistant5605616,51892100%7.6
Licensed Practical Nurse170173,77592100%8.4
Medication Aide/Technician6061,9319199%11.1
RN Director of Nursing3031,4476773%8.2
Clinical Nurse Specialist3369828896%7.5
Registered Nurse6067918390%6.2
Nurse Practitioner3035596672%6.9
Dietitian2025166267%8.3
Mental Health Service Worker2025045863%8.7
Administrator2024806065%8
Physical Therapy Assistant0334105762%7.2
Qualified Social Worker0332105155%4.1
Speech Language Pathologist0111884549%4.2
Respiratory Therapy Technician033973134%2.9
Physical Therapy Aide033621516%4.1
Medical Director011181820%1
Occupational Therapy Aide0111533%4.8
Occupational Therapy Assistant0111233%4
56 Certified Nursing Assistant
% of Days 100%
17 Licensed Practical Nurse
% of Days 100%
6 Medication Aide/Technician
% of Days 99%
3 RN Director of Nursing
% of Days 73%
6 Clinical Nurse Specialist
% of Days 96%
6 Registered Nurse
% of Days 90%
3 Nurse Practitioner
% of Days 72%
2 Dietitian
% of Days 67%
2 Mental Health Service Worker
% of Days 63%
2 Administrator
% of Days 65%
3 Physical Therapy Assistant
% of Days 62%
3 Qualified Social Worker
% of Days 55%
1 Speech Language Pathologist
% of Days 49%
3 Respiratory Therapy Technician
% of Days 34%
3 Physical Therapy Aide
% of Days 16%
1 Medical Director
% of Days 20%
1 Occupational Therapy Aide
% of Days 3%
1 Occupational Therapy Assistant
% of Days 3%

Penalties and fines

Includes penalties issued in 2024

Federal penalties imposed by CMS for regulatory violations, including civil money penalties (fines) and denials of payment for new Medicare/Medicaid admissions.

Source: CMS Penalties Database (Data as of Jan 2026)

Total fines amount $25K
In line with Arkansas average

Arkansas average: $26K

Number of fines 1
32% fewer fines than Arkansas average

Arkansas average: 1.5

Payment Denials Info Serious action where Medicare and/or Medicaid temporarily stops payments for new residents until issues are fixed. 0
100% fewer payment denials than Arkansas average

Arkansas average: 0.2

Fines amount comparison
This facility $25K
Arkansas average $26K
Penalty History

Penalties are imposed by CMS for violations of federal nursing home regulations.

1 penalty in the past 3 years

May 6, 2024 · $25K

Civil Money Penalty Info Fines imposed for noncompliance, which can be assessed per day or per instance of violation. May 6, 2024
$25K

Last updated: Jan 2026

Quality of care over time

These measures show how residents usually do over time at this home, based on health outcomes and preventive care.

High-risk clinical events score Info A composite score based on pressure ulcers, falls with injury, weight loss, walking ability decline, and activities of daily living decline. 9.5
24% worse than Arkansas average

Arkansas average: 7.7

Functional decline score Info A composite score based on activities of daily living decline, walking ability decline, and incontinence. 14.1
6% worse than Arkansas average

Arkansas average: 13.3

Long-stay resident measures
Significantly above average Arkansas avg: 4.2 Info CMS star rating based on long-stay quality measure performance. 5 stars = significantly above average, 1 star = significantly below average.
Need for Help with Daily Activities Increased Info Percent of long-stay residents whose need for help with daily activities has increased 12.1%
5% worse than Arkansas average

Arkansas average: 11.5%

Walking Ability Worsened Info Percent of long-stay residents whose ability to move independently worsened 13.2%
In line with Arkansas average

Arkansas average: 13.4%

Low Risk Residents with Bowel/Bladder Incontinence Info Percent of low risk long-stay residents who lose control of their bowels or bladder 17.0%
12% worse than Arkansas average

Arkansas average: 15.1%

Falls with Major Injury Info Percent of long-stay residents experiencing one or more falls with major injury 4.1%
5% worse than Arkansas average

Arkansas average: 3.9%

High Risk Residents with Pressure Ulcers Info Percent of long-stay high risk residents with pressure ulcers 8.0%
69% worse than Arkansas average

Arkansas average: 4.7%

Urinary Tract Infection Info Percent of long-stay residents with a urinary tract infection 0.0%
100% better than Arkansas average

Arkansas average: 1.3%

Lost Too Much Weight Info Percent of long-stay residents who lose too much weight 10.1%
101% worse than Arkansas average

Arkansas average: 5.0%

Depressive Symptoms Info Percent of long-stay residents who have depressive symptoms 2.0%
32% worse than Arkansas average

Arkansas average: 1.5%

Antipsychotic Use Info Percent of long-stay residents who received an antipsychotic medication 6.1%
42% better than Arkansas average

Arkansas average: 10.5%

Pneumococcal Vaccine Info Percent of long-stay residents assessed and appropriately given the pneumococcal vaccine 91.0%
In line with Arkansas average

Arkansas average: 94.4%

Influenza Vaccine Info Percent of long-stay residents assessed and appropriately given the seasonal influenza vaccine 92.7%
In line with Arkansas average

Arkansas average: 96.2%

Hospitalizations per 1,000 days Info Number of hospitalizations per 1,000 long-stay resident days. 1.20
39% better than Arkansas average

Arkansas average: 1.97

ED visits per 1,000 days Info Number of outpatient emergency department visits per 1,000 long-stay resident days. 1.44
34% better than Arkansas average

Arkansas average: 2.18

Short-stay resident measures
Significantly above average Arkansas avg: 2.7 Info CMS star rating based on short-stay quality measure performance. 5 stars = much above average, 1 star = much below average.
Pneumococcal Vaccine Info Percent of short-stay residents assessed and appropriately given the pneumococcal vaccine 52.5%
35% worse than Arkansas average

Arkansas average: 80.9%

Antipsychotic medication increase Info Percent of short-stay residents who newly received an antipsychotic medication 0.0%
100% better than Arkansas average

Arkansas average: 1.5%

Influenza Vaccine Info Percent of short-stay residents assessed and appropriately given the seasonal influenza vaccine 51.4%
34% worse than Arkansas average

Arkansas average: 77.7%

Re-hospitalized after SNF stay Info Percentage of short-stay residents who were re-hospitalized after their nursing home admission. 18.4%
27% better than Arkansas average

Arkansas average: 25.2%

Emergency department visits Info Percentage of short-stay residents who had an outpatient emergency department visit. 8.3%
40% better than Arkansas average

Arkansas average: 13.8%

Falls with major injury Info Percentage of SNF residents who experience falls with major injury during their stay. 0.0%
100% better than Arkansas average

Arkansas average: 0.8%

Breakdown by payment type

Medicare

25% of new residents, usually for short-term rehab.

Typical stay 29 days

Private pay

63% of new residents, often for short stays.

Typical stay 5 - 6 months

Medicaid

12% of new residents, often for long-term daily care.

Typical stay 3 - 4 years

Facility Characteristics

Source: CMS Long-Term Care Facility Characteristics (Data as of Jan 2026)

Total residents 73
Medicare
2
2.7% of residents
Medicaid
39
53.4% of residents
Private pay or other
32
43.8% of residents
Programs & Services
CCRC

Part of a Continuing Care Retirement Community offering multiple care levels

Finances and operations

Based on CMS SNF Cost Report for fiscal year ending in 12/2023.

For-profit
Operated by a single business entity.
Net patient revenue Info Net patient revenue — what the home actually collects for resident care, after contractual allowances, bad debt and discounts are subtracted from its gross charges (CMS cost report, Worksheet G-3). It covers resident care only; money the home earns from other sources is shown separately as "Other income."
$7.9M
Net patient income Info Net patient income: net patient revenue minus the home's total operating expenses. A positive figure means it earns more from resident care than it spends to deliver it; a negative figure means the opposite. It excludes non-operating "other income."
$467.7K
For-profit Operated by a single business entity.
Net patient revenue Info Net patient revenue — what the home actually collects for resident care, after contractual allowances, bad debt and discounts are subtracted from its gross charges (CMS cost report, Worksheet G-3). It covers resident care only; money the home earns from other sources is shown separately as "Other income."
$7.9M
Net patient income Info Net patient income: net patient revenue minus the home's total operating expenses. A positive figure means it earns more from resident care than it spends to deliver it; a negative figure means the opposite. It excludes non-operating "other income."
$467.7K
Other income Info Money the home earns outside of resident care — such as investments, grants, rentals and other non-operating sources (CMS cost report, Worksheet G-3). It is tracked separately from net patient revenue: it is not part of that figure, and it is not included in net patient income.
$389.7K
Payroll costs Info Staff salaries plus wage-related costs — benefits such as payroll taxes, health insurance and retirement — from the home's own accounting records (CMS cost report, Worksheet A). Contract or agency labor is counted separately, under other operating costs.
$3.4M 43.3% of net patient revenue Info Payroll as a share of revenue: staff salaries and wage-related benefits divided by net patient revenue. A higher figure means more of each revenue dollar goes to staff pay.
Other operating costs Info Everything it costs to run the home apart from payroll — food, utilities, supplies, maintenance, contract labor and administration. Calculated as total operating expense minus payroll (staff salaries and wage-related benefits).
$4.0M
Total costs Info The home's total operating expense for the year — all the costs of running it, salaries included (CMS cost report, Worksheet G-3).
$7.4M

Who this home usually serves

TYPE OF STAY

Primarily short stays

Residents typically stay for brief periods, with frequent admissions and discharges throughout the year.

Most new residents arrive under private pay (63% of admissions), and a typical private pay stay runs around 5 - 6 months.

Admissions
97 total

Coverage residents most often arrive under.

Medicare 25%
Private pay 63%
Medicaid 12%
Discharges
102 total

Coverage residents most often leave under.

Medicare 17%
Private pay 58%
Medicaid 25%

Places of interest near Conway Healthcare and Rehabilitation Center

Address 3.6 miles from city center Info Estimated distance in miles from Conway's city center to Conway Healthcare and Rehabilitation Center's address, calculated via Google Maps.

Calculate Travel Distance to Conway Healthcare and Rehabilitation Center

Add your location

Address

Compare Nursing Homes around Conway

The information below is reported by the Arkansas Department of Human Services, Office of Long Term Care.

4 facilities compared · CMS & AR Dept. of Health data

Superior Health and Rehab, LLC
NH
Conway
118
Facility 118
AR AVG 84
Rank #75 / 330
88.1% +24%3.99 -17%-15%$0103.3-99-
2
Facility 2
AR AVG 34
Rank #388 / 419
Vickey Lynn Kirkemier$13.3M$5.1M38.1%45467
Salem Place Nursing and Rehabilitation Center, Inc.
NH
RC
Conway
103
Facility 103
AR AVG 84
Rank #122 / 330
80.6% +13%6.11 -41%+31%$0338.3-85-
2
Facility 2
AR AVG 34
Rank #388 / 419
Sheri Hollingsworth$10.6M$4.5M42.8%45183
Heritage Living Center
NH
MC
RC
Conway
140
Facility 140
AR AVG 84
Rank #17 / 330
91.4% +28%3.54 -34%-24%$0224.4-128-
2
Facility 2
AR AVG 34
Rank #388 / 419
John Dickson$16.0M$6.2M39%45308
Conway Healthcare and Rehabilitation Center
NH
RC
Conway
105
Facility 105
AR AVG 84
Rank #108 / 330
62.9% -12%4.13 -8%-12%$25.5k234.6168-
2
Facility 2
AR AVG 34
Rank #388 / 419
Melissa Poore$7.9M$3.4M43.3%45245

Financial Assistance for
Nursing Home in Arkansas

Conway Healthcare and Rehabilitation Center is located in Conway, Arkansas.
Here are the financial assistance programs available to residents in Arkansas.

Get Financial aid guidance

ARChoices

Arkansas Medicaid ARChoices

Age 65+ or 21+ with disability
General Arkansas resident, Medicaid- eligible, nursing home-level care need.
Income Limits (2025) ~$2,829/month 300% FBR, individual
Asset Limits $2,000 (individual), $3,000 (couple).
AR

Rural focus; possible waitlists.

Benefits
Personal care (5-7 hours/day) Meals ($7/meal) Respite care (240 hours/year) Adult day services ($60/day)

Choices in Living Resource Center

Arkansas Choices in Living

Age 60+
General Arkansas resident.
Income Limits No strict limit; prioritizes low-income.
Asset Limits Not applicable.
AR

Limited direct funding; mostly referral-based.

Benefits
Care coordination Limited respite (up to 5 days/year) Transportation assistance (~5 trips/month)

Living Choices Assisted Living Waiver

Arkansas Medicaid Living Choices Assisted Living Waiver

Age 65+
General Arkansas resident, requires nursing home-level care, lives in a Level II assisted living facility.
Income Limits (2025) ~$2,829/month 300% FBR, individual
Asset Limits $2,000 (individual), $3,000 (couple); spousal rules apply.
AR

Limited provider network; excludes Level I facilities (no nursing services).

Benefits
Personal care (~5 hours/day) Medication management Nursing Activities Transportation

Program of All-Inclusive Care for the Elderly (PACE)

Arkansas Medicaid PACE

Age 55+
General Arkansas resident, nursing home-level care, safe with PACE support.
Income Limits (2025) ~$2,829/month 300% FBR
Asset Limits $2,000 (individual), $3,000 (couple).
AR

Limited geographic availability.

Benefits
Primary/preventive care Personal care (5-7 hours/day) Meals Transportation Therapy

Arkansas State Plan Personal Care

Arkansas Medicaid Personal Care Program

Age
General Any age, Arkansas resident, needs ADL/IADL help, Medicaid-eligible.
Income Limits (2025) ~$1,004/month individual
Asset Limits $9,660 (individual), $14,470 (couple).
AR

No nursing home-level care requirement.

Benefits
Personal care (~4-6 hours/day) Homemaker services (e.g., meal prep)

Frequently Asked Questions about Conway Healthcare and Rehabilitation Center

Who is the owner of Conway Healthcare and Rehabilitation Center?

Conway Healthcare and Rehabilitation Center is legally operated by Faulkner SNF Operations, LLC, and administered by Kathern Fisher.

Is Conway Healthcare and Rehabilitation Center in a walkable area?

Conway Healthcare and Rehabilitation Center has a walk score of 2. Car-dependent. Most errands require a car, with limited nearby walkable options.

What is the occupancy rate at Conway Healthcare and Rehabilitation Center?

Conway Healthcare and Rehabilitation Center's occupancy is 63%.

Does Conway Healthcare and Rehabilitation Center operate as a for-profit or non-profit?

Conway Healthcare and Rehabilitation Center is registered as a for-profit in AR.

Who is the administrator of Conway Healthcare and Rehabilitation Center?

Kathern Fisher is the administrator of Conway Healthcare and Rehabilitation Center.

How many beds does Conway Healthcare and Rehabilitation Center have?

Conway Healthcare and Rehabilitation Center has 105 beds.

Are there photos of Conway Healthcare and Rehabilitation Center?

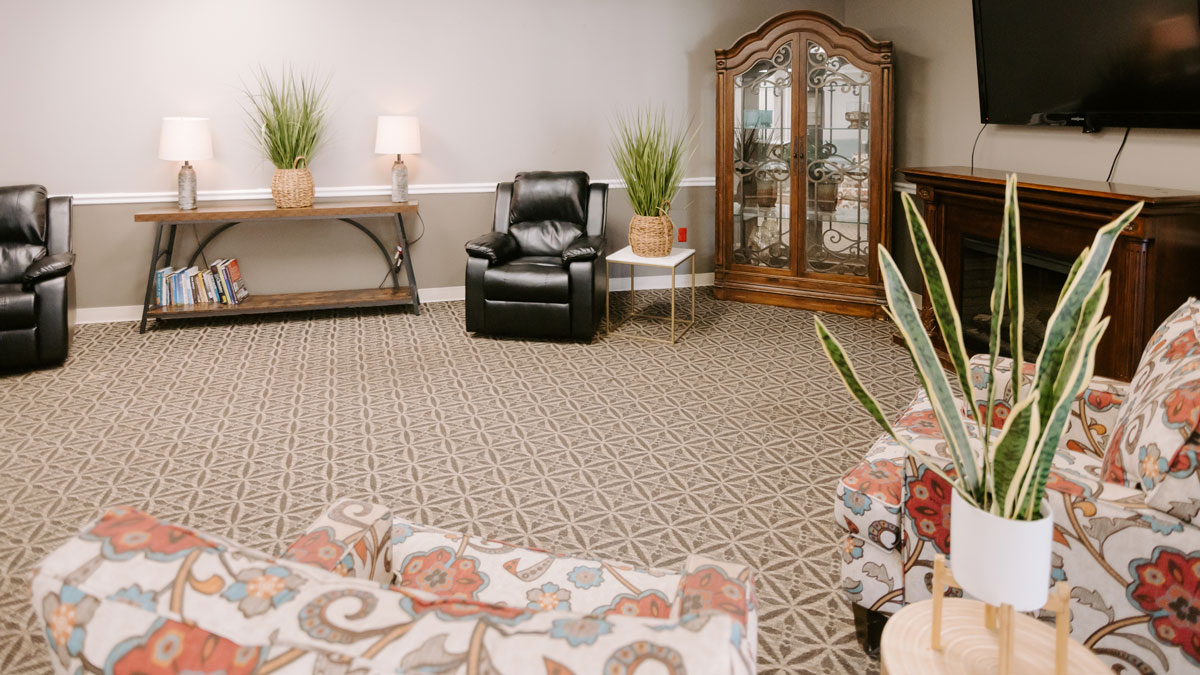
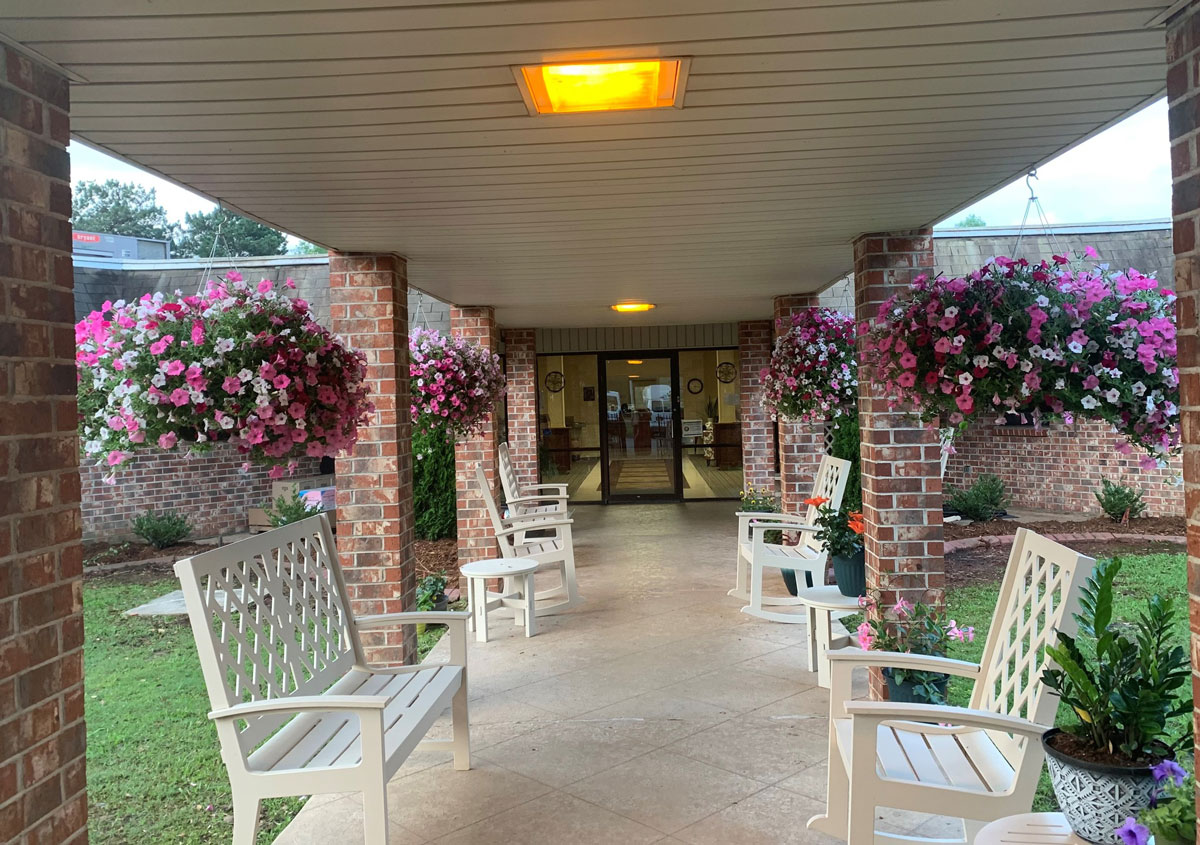
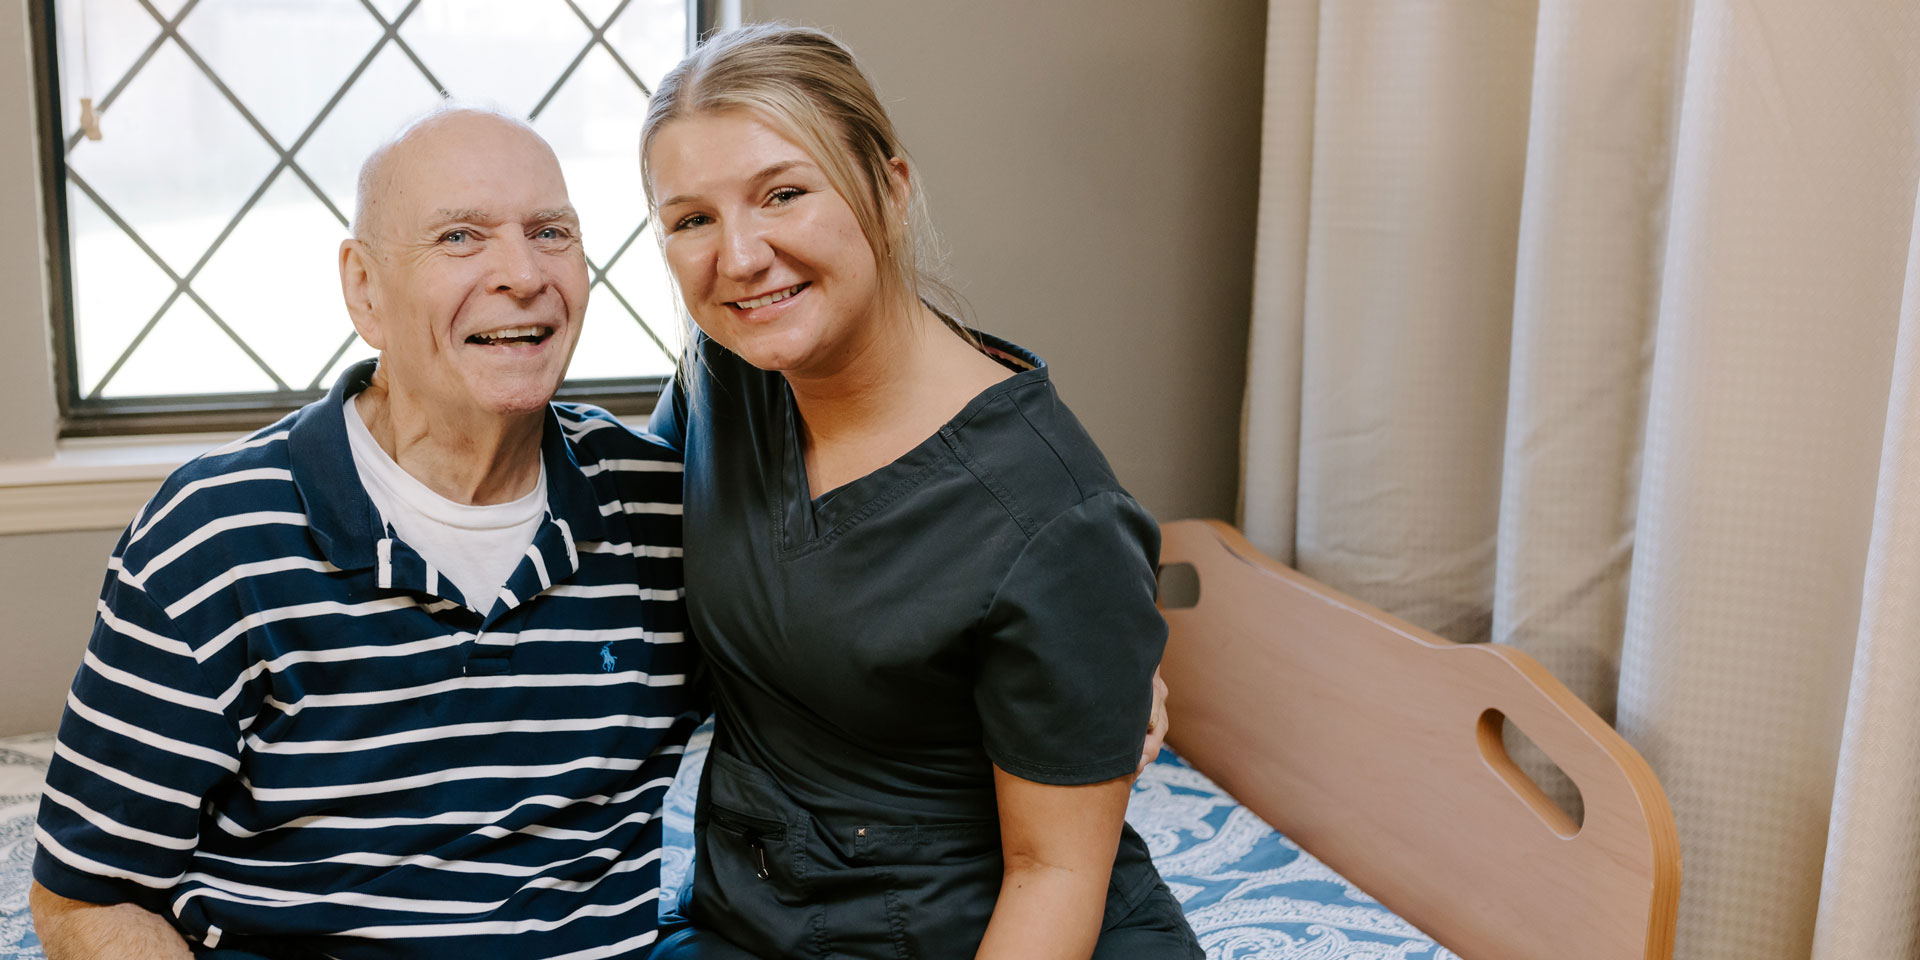
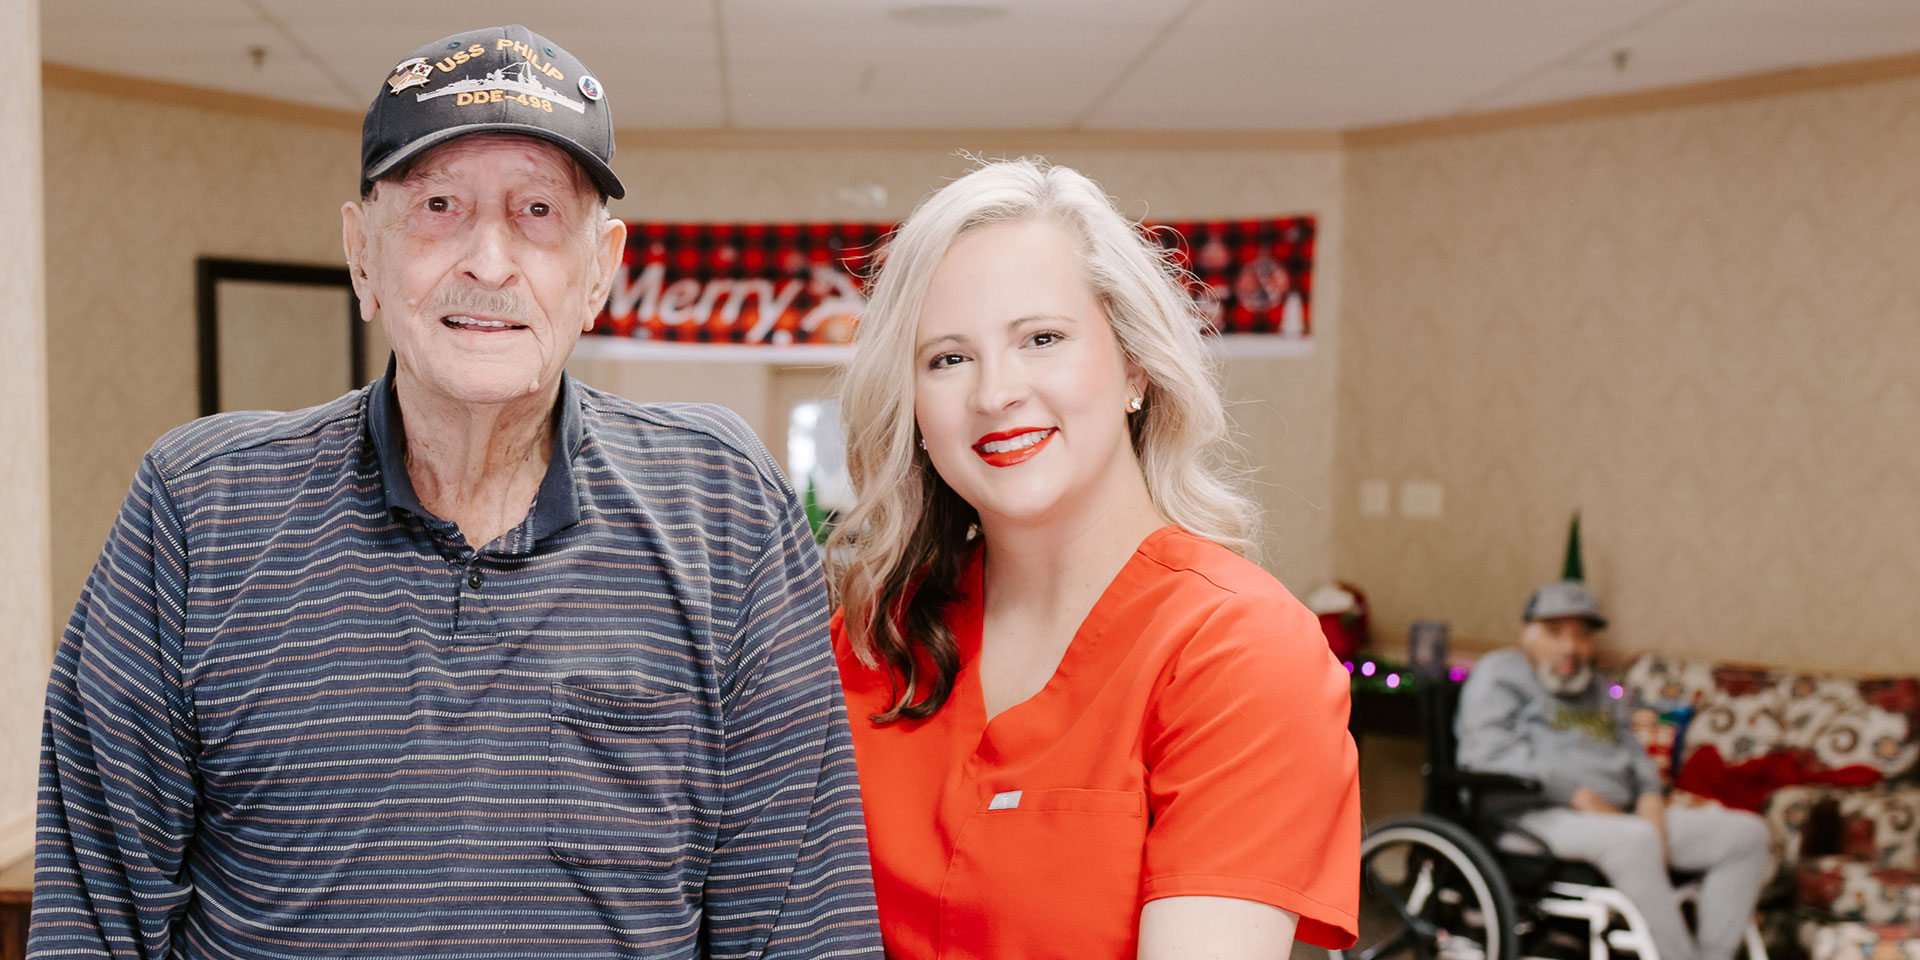
Yes — there are 4 photos of Conway Healthcare and Rehabilitation Center in the photo gallery on this page.

Guides for Better Senior Living

Care Cost Calculator: See Prices in Your Area

Nursing Home Data Explorer

Don’t Wait Too Long: 7 Red Flag Signs Your Parent Needs Assisted Living Now

The True Cost of Assisted Living in 2025 – And How Families Are Paying For It

Understanding Senior Living Costs: Pricing Models, Discounts & Financial Assistance