Villa Maria, Inc
Nursing Home & Assisted Living · Mulvane, KS
CMS overall rating Info CMS (the Centers for Medicare & Medicaid Services) is the federal agency that rates nursing home quality. Its Overall Rating runs from 1 to 5 stars, combining health inspections, staffing, and quality measures, with inspections weighted most heavily.

Villa Maria, Inc

Nursing Home & Assisted Living · Mulvane, KS
CMS overall rating Info CMS (the Centers for Medicare & Medicaid Services) is the federal agency that rates nursing home quality. Its Overall Rating runs from 1 to 5 stars, combining health inspections, staffing, and quality measures, with inspections weighted most heavily.
Calculator: See prices in your area
Villa Maria, Inc accepts Medicare, Medicaid, and private pay.

Overview of Villa Maria, INC

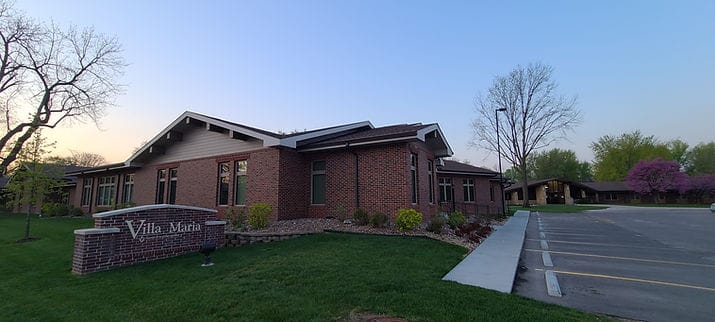
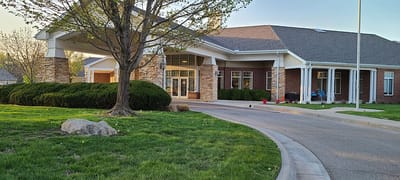
With 44 beds, Villa Maria is a skilled nursing and short-term rehabilitation community on East Main Street in Mulvane, Kansas. Asc Health System operates the facility. The community cares for residents recovering from surgery, hospitalization, and acute illness who require nursing support and rehabilitation services. Medicare, Medicaid, and private pay are accepted, giving families several options when arranging care.

Rehabilitation is a major focus at Villa Maria. Residents have access to both outpatient therapy and dedicated rehabilitation services designed to help them regain function and independence. Daily nurse staffing averages 4 hours and 41 minutes per resident. Registered nurses provide about 30 minutes of care each day, while nurse aides contribute 2 hours and 34 minutes of direct care.

The facility’s staffing levels support its rehabilitation-focused approach. Residents stay an average of 227 days as they work toward recovery goals and more independence. With nursing care and therapy services combined, residents can be supported throughout the rehabilitation process.

State inspections have reviewed areas such as documentation practices, resident assessments, medication management, facility maintenance, and infection control. Earlier surveys identified concerns in these areas. The facility addressed the cited deficiencies and showed improvement through successful follow-up reviews. No fines or enforcement actions were recorded.

The community is in a somewhat walkable part of Mulvane. A few nearby services may be reached by walking, but most errands and appointments require transportation. The quieter setting may appeal to residents and families looking for a less urban environment while still having access to local services and community resources.

Quality ratings

Measured by Centers for Medicare & Medicaid Services (CMS)

Overall rating Info The Overall CMS Rating combines results from health inspections, staffing levels and quality measures. Health inspections carry the most weight. Staffing and quality scores can increase or decrease the final rating based on performance compared to state and national standards.
Health Inspection Info Based on the results of the facility's three most recent standard inspections and any complaint investigations. CMS reviews the number, scope, and severity of deficiencies, with more recent findings weighted more heavily.
Staffing Info Measures average nursing staff hours per resident per day, including Registered Nurses (RNs) and total nursing staff. Ratings are adjusted based on the level of care residents require and are compared to state and national benchmarks.
Quality Measures Info Based on clinical and physical health indicators reported to CMS, such as hospital readmissions, falls, pressure ulcers, and improvements in mobility. These measures reflect how well residents' health needs are being managed.

Staffing hours breakdown

Info Daily nursing hours per resident by staff type, reported to CMS. Higher is generally better — compare this facility to state and national averages to see where staffing stands.

Hours per resident per day — compared to state averages

Total nursing care / resident Info Total adjusted nursing hours per resident per day, combining RN, LPN, and aide time. CMS adjusts this for case-mix so facilities can be fairly compared.
4h 41m per day
vs avg

5 of 6 metrics below state avg

Standout metric Physical Therapist is +163% above state avg
Staff type Hours / Day / Resident vs state avg
Registered Nurse (RN) Info RNs hold the highest nursing license and can assess residents, interpret test results, and direct care plans. More RN hours per day often signals stronger clinical oversight and faster response to health changes. 30m per day ▼ 29% State avg: 43m per day · National avg: 41m per day
LPN / LVN Info Licensed Practical Nurses (LPNs) or Licensed Vocational Nurses (LVNs) deliver routine hands-on care — medication administration, wound dressing, and monitoring vital signs. They work under RN supervision and make up a large share of daily bedside care. 26m per day ▼ 35% State avg: 40m per day · National avg: 52m per day
Nurse Aide Info Certified Nurse Aides (CNAs) provide the most direct day-to-day assistance: bathing, dressing, feeding, and mobility. Nurse aide hours are typically the largest staffing category and directly affect residents' quality of life. 2h 34m per day ▼ 5% State avg: 2h 41m per day · National avg: 2h 20m per day
Weekend Total Nursing Info Combined nursing hours (RN + LPN + Nurse Aide) per resident per day on weekends. Staffing often drops on weekends — this figure reveals whether the facility maintains adequate coverage outside of weekday hours. 3h 5m per day ▼ 14% State avg: 3h 35m per day · National avg: 3h 26m per day
Physical Therapist Info Hours per resident per day provided by licensed Physical Therapists (PTs) or PT Assistants. PT services help residents recover mobility after injury or illness and are especially important for post-acute (short-stay) rehabilitation. 5m per day ▲ 163% State avg: 2m per day · National avg: 4m per day
Weekend RN Info Registered nurse hours specifically on weekends. Facilities sometimes reduce RN presence on Saturdays and Sundays — a low weekend RN figure compared to weekday hours can indicate reduced clinical oversight when most administrative staff are absent. 17m per day ▼ 43% State avg: 30m per day · National avg: 28m per day

Capacity and availability

Avg. Length of Stay
227 days
Bed community size
44-bed community Rank #179 / 224Bed count — State benchmarkedThis home is ranked 179th out of 224 homes in Kansas. Shows this facility's certified or reported bed count compared to other Kansas facilities. Larger communities may offer more amenities, programs, and on-site services for residents and families.Rankings are based only on facilities in Kansas that report data for that category. Facilities without available data are excluded from the ranking.Click the rank badge to see the full State ranking.Click here to see the full State ranking.
A moderately sized community that may balance personal attention with shared amenities and social activities.
Walk Score
Walk Score: 49 / 100 Rank #172 / 363Walk Score — State benchmarkedThis home is ranked 172nd out of 363 homes in Kansas. Shows how walkable this facility's neighborhood is compared to the average Walk Score across Kansas facilities. Higher scores benefit residents, families, and staff.Rankings are based only on facilities in Kansas that report data for that category. Facilities without available data are excluded from the ranking.Click the rank badge to see the full State ranking.Click here to see the full State ranking.
Somewhat walkable. A few nearby services may be reachable on foot, but most trips require transportation.

About this community

Occupancy

Occupancy rate
70%
Lower than the Kansas average: 79.5%
Occupied beds
31 / 44
Average occupied beds in Kansas homes 50 beds

License Details

Facility TypeAssisted Living Facility
CountySumner
CMS Certification Number175456

Ownership & Operating Entity

Villa Maria, Inc is administered by Teresa Ballard.

Owner NameVilla Maria, Inc

Therapy & Rehabilitation

2 services
Rehabilitation Services
Short-Term Rehab

Staffing & Medical

1 service
24-Hour Staffing

Amenities & Lifestyle

Specific ProgramsOutpatient Therapy

Contact Villa Maria, Inc

Inspection History

In Kansas, the Department for Aging and Disability Services, Survey and Certification Commission performs the unannounced inspections required for facility licensing and federal certification.

Since 2014 · 12 years of data 35 deficiencies

Inspection Scorecard Info This scorecard compares key inspection, deficiency, and complaint metrics at this facility against the Kansas state average. Metrics rated ≥15% worse than average are highlighted in red; those ≥15% better are highlighted in green.

Since 2014 vs. Kansas state average
Overall vs. KS average 0 Worse No metrics in this bucket. 2 Better Metrics better than Kansas average:
• Total deficiencies (65% below)
• Deficiencies per year (65% below)
Latest Inspection November 3, 2025

Deficiencies Info Deficiencies are formal regulatory issues recorded during state inspections.

This Facility KS Average vs. KS Avg
Total deficiencies Info Formal regulatory issues recorded by inspectors across all inspection types. 35 100 This facility has 65% fewer total deficiencies than a typical Kansas assisted living residence (35 vs. KS avg 100).↓ 65% better
Deficiencies per year Info Average deficiencies per year since 2014. 2.9 8.3 This facility has 65% fewer deficiencies per year than a typical Kansas assisted living residence (2.9 vs. KS avg 8.3).↓ 65% better

Inspection Reports Summary Info An editor-reviewed summary of the themes and findings across this facility's recent inspection reports.

  • The most recent inspection on October 27, 2025, found that all previously cited deficiencies had been corrected. Prior inspections showed some deficiencies related mainly to resident care issues such as failure to perform required functional capacity screenings, medication administration errors, and incomplete documentation of assistive devices. Earlier reports also noted facility maintenance and infection control concerns, but no fines, immediate jeopardy findings, or license actions were listed in the available reports. Complaint investigations included one substantiated case involving resident elopement linked to care and safety lapses, while most other complaints were unsubstantiated. The facility appears to have addressed prior deficiencies effectively, showing improvement by resolving cited issues in the most recent revisit.

Health Inspection History

Inspections since 2021
Total health inspections 3

State average N/A


Last Health inspection on Jul 2025

Total health citations
18

State average N/A

Citations per inspection
6

State average N/A


Health citations are formal notices following inspections when they fail to comply with safety and care standards.

10 of 18 citations resulted from standard inspections; 1 of 18 resulted from complaint investigations; and 7 of 18 came from combined inspections (standard and complaint).

Breakdown of citation severity (last 5 years)
Critical health citations
0
In line with State average

State average: N/A


Serious health citations
0
In line with State average

State average: N/A

0 critical citations State average: N/A

0 serious citations State average: N/A

18 moderate citations State average: N/A

0 minor citations State average: N/A
Citations history (last 5 years)
Quality of Care moderate citation Jul 30, 2025
Corrected

Pharmacy moderate citation Feb 08, 2023
Corrected

Quality of Care moderate citation Feb 08, 2023
Corrected

Quality of Care moderate citation Feb 08, 2023
Corrected

Staffing Data

Reporting period: October 1 – December 31, 2025 (Q4 2025). Source: CMS Payroll-Based Journal report.

Total staff 298
Employees 296
Contractors 2
Staff to resident ratio 6.48 : 1
0% compared with State average

State average ratio: 0 : 0

Avg staff/day 31
Average shift 7.8 hours
0% compared with State average

State average: 0 hours

Total staff hours (quarter) 22,289

Nursing staff breakdown

Q4 2025 · Oct 1 – Dec 31 More info This data comes from the CMS Payroll-Based Journal report covering October 1 – December 31, 2025.
Registered Nurse

Manages medical care and health needs.

RN Staff Info All 20 RN Staff are full-time employees. No contractors work on this role. 20
Average shift length Info Average shift length. Calculated as total hours divided by days worked and average staff per day. 10.7 hours
Licensed Practical Nurse

Assists with medical care and medications.

LPN Staff Info All 16 LPN Staff are full-time employees. No contractors work on this role. 16
Average shift length Info Average shift length. Calculated as total hours divided by days worked and average staff per day. 10.3 hours
Certified Nursing Assistant

Helps with daily care and mobility.

CNA Staff Info All 192 CNA Staff are full-time employees. No contractors work on this role. 192
Average shift length Info Average shift length. Calculated as total hours divided by days worked and average staff per day. 7.6 hours

Contractor staffing

Q4 2025 · Oct 1 – Dec 31 More info This data comes from the CMS Payroll-Based Journal report covering October 1 – December 31, 2025.

Total hours from contractors

0.4%

92 contractor hours this quarter

Medical Director: 1 Occupational Therapy Assistant: 1

Staff by category

Q4 2025 · Oct 1 – Dec 31 More info This data comes from the CMS Payroll-Based Journal report covering October 1 – December 31, 2025.
Certified Nursing Assistant 192 0 192 11,496 92 100% 7.6
Licensed Practical Nurse 16 0 16 2,248 91 99% 10.3
Medication Aide/Technician 51 0 51 2,195 92 100% 8.5
Registered Nurse 20 0 20 2,042 92 100% 10.7
Dietitian 2 0 2 969 70 76% 8.3
Nurse Practitioner 2 0 2 568 63 68% 8
Dental Services Staff 1 0 1 503 61 66% 8.2
Respiratory Therapy Technician 1 0 1 468 66 72% 7.1
Administrator 1 0 1 456 57 62% 8
Physical Therapy Assistant 1 0 1 353 58 63% 6.1
Qualified Social Worker 1 0 1 309 52 57% 5.9
Other Dietary Services Staff 2 0 2 303 64 70% 4.6
Speech Language Pathologist 2 0 2 114 31 34% 3.5
Clinical Nurse Specialist 2 0 2 96 12 13% 8
RN Director of Nursing 1 0 1 64 8 9% 8
Medical Director 0 1 1 60 15 16% 4
Occupational Therapy Assistant 0 1 1 32 8 9% 4
Physical Therapy Aide 1 0 1 14 4 4% 3.4
192 Certified Nursing Assistant
% of Days 100%
16 Licensed Practical Nurse
% of Days 99%
51 Medication Aide/Technician
% of Days 100%
20 Registered Nurse
% of Days 100%
2 Dietitian
% of Days 76%
2 Nurse Practitioner
% of Days 68%
1 Dental Services Staff
% of Days 66%
1 Respiratory Therapy Technician
% of Days 72%
1 Administrator
% of Days 62%
1 Physical Therapy Assistant
% of Days 63%
1 Qualified Social Worker
% of Days 57%
2 Other Dietary Services Staff
% of Days 70%
2 Speech Language Pathologist
% of Days 34%
2 Clinical Nurse Specialist
% of Days 13%
1 RN Director of Nursing
% of Days 9%
1 Medical Director
% of Days 16%
1 Occupational Therapy Assistant
% of Days 9%
1 Physical Therapy Aide
% of Days 4%

Penalties and fines

Includes penalties issued in 2025

Federal penalties imposed by CMS for regulatory violations, including civil money penalties (fines) and denials of payment for new Medicare/Medicaid admissions.

Source: CMS Penalties Database (Data as of Jan 2026)

Total fines amount $34K
23% lower than State average

State average: $44K

Number of fines 1
59% fewer fines than State average

State average: 2.4

Payment Denials Info Serious action where Medicare and/or Medicaid temporarily stops payments for new residents until issues are fixed. 0
100% fewer payment denials than State average

State average: 0.3

Fines amount comparison
This facility $34K
State average $44K
Penalty History

Penalties are imposed by CMS for violations of federal nursing home regulations.

1 penalty in the past 3 years

Jan 16, 2025 · $34K

Civil Money Penalty Info Fines imposed for noncompliance, which can be assessed per day or per instance of violation. Jan 16, 2025
$34K

Last updated: Jan 2026

Quality of care over time

These measures show how residents usually do over time at this home, based on health outcomes and preventive care.

High-risk clinical events score Info A composite score based on pressure ulcers, falls with injury, weight loss, walking ability decline, and activities of daily living decline. 11.9
13% worse than State average

State average: 10.5

Functional decline score Info A composite score based on activities of daily living decline, walking ability decline, and incontinence. 23.0
11% worse than State average

State average: 20.7

Long-stay resident measures
Below average State avg: 3.0 Info CMS star rating based on long-stay quality measure performance. 5 stars = significantly above average, 1 star = significantly below average.
Need for Help with Daily Activities Increased Info Percent of long-stay residents whose need for help with daily activities has increased 17.2%
10% better than State average

State average: 19.0%

Walking Ability Worsened Info Percent of long-stay residents whose ability to move independently worsened 23.4%
21% worse than State average

State average: 19.4%

Low Risk Residents with Bowel/Bladder Incontinence Info Percent of low risk long-stay residents who lose control of their bowels or bladder 28.4%
19% worse than State average

State average: 23.8%

Falls with Major Injury Info Percent of long-stay residents experiencing one or more falls with major injury 8.3%
90% worse than State average

State average: 4.4%

High Risk Residents with Pressure Ulcers Info Percent of long-stay high risk residents with pressure ulcers 4.9%
5% worse than State average

State average: 4.6%

Urinary Tract Infection Info Percent of long-stay residents with a urinary tract infection 2.3%
27% better than State average

State average: 3.1%

Lost Too Much Weight Info Percent of long-stay residents who lose too much weight 5.6%
9% worse than State average

State average: 5.1%

Depressive Symptoms Info Percent of long-stay residents who have depressive symptoms 0.0%
100% better than State average

State average: 5.2%

Antipsychotic Use Info Percent of long-stay residents who received an antipsychotic medication 10.6%
37% better than State average

State average: 16.9%

Pneumococcal Vaccine Info Percent of long-stay residents assessed and appropriately given the pneumococcal vaccine 100.0%
9% better than State average

State average: 91.9%

Influenza Vaccine Info Percent of long-stay residents assessed and appropriately given the seasonal influenza vaccine 100.0%
5% better than State average

State average: 95.5%

Hospitalizations per 1,000 days Info Number of hospitalizations per 1,000 long-stay resident days. 1.91
In line with State average

State average: 1.84

ED visits per 1,000 days Info Number of outpatient emergency department visits per 1,000 long-stay resident days. 1.52
30% better than State average

State average: 2.16

Short-stay resident measures
Significantly above average State avg: 2.6 Info CMS star rating based on short-stay quality measure performance. 5 stars = much above average, 1 star = much below average.
Pneumococcal Vaccine Info Percent of short-stay residents assessed and appropriately given the pneumococcal vaccine 98.4%
30% better than State average

State average: 75.6%

Antipsychotic medication increase Info Percent of short-stay residents who newly received an antipsychotic medication 0.0%
100% better than State average

State average: 2.2%

Influenza Vaccine Info Percent of short-stay residents assessed and appropriately given the seasonal influenza vaccine 100.0%
36% better than State average

State average: 73.5%

Re-hospitalized after SNF stay Info Percentage of short-stay residents who were re-hospitalized after their nursing home admission. 22.3%
In line with State average

State average: 23.0%

Emergency department visits Info Percentage of short-stay residents who had an outpatient emergency department visit. 2.8%
76% better than State average

State average: 11.7%

Falls with major injury Info Percentage of SNF residents who experience falls with major injury during their stay. 2.0%
155% worse than State average

State average: 0.8%

Ability to care for self at discharge Info Percentage of residents at or above expected ability to care for themselves at discharge. 53.7%
In line with State average

State average: 53.7%

Successful return to home or community Info Rate of successful return to home or community from a skilled nursing facility. 64.6%
28% better than State average

State average: 50.6%

Breakdown by payment type

Medicare

38% of new residents, usually for short-term rehab.

Typical stay 19 days

Private pay

44% of new residents, often for short stays.

Typical stay 4 - 5 months

Medicaid

17% of new residents, often for long-term daily care.

Typical stay 2 years

Facility Characteristics

Source: CMS Long-Term Care Facility Characteristics (Data as of Jan 2026)

Total residents 46
Medicare
3
6.5% of residents
Medicaid
28
60.9% of residents
Private pay or other
15
32.6% of residents
Programs & Services
Residents Group

Residents meet regularly to discuss policies, care quality, and activities

Active Resident Council

Organized group of residents that meets regularly to discuss facility policies, quality of life, and activities.

Finances and operations

Based on CMS SNF Cost Report for fiscal year ending in 06/2024.

Nonprofit
Nonprofit Corporation
Net patient revenue Info Net patient revenue — what the home actually collects for resident care, after contractual allowances, bad debt and discounts are subtracted from its gross charges (CMS cost report, Worksheet G-3). It covers resident care only; money the home earns from other sources is shown separately as "Other income."
$8.3M
Net patient income Info Net patient income: net patient revenue minus the home's total operating expenses. A positive figure means it earns more from resident care than it spends to deliver it; a negative figure means the opposite. It excludes non-operating "other income."
$172.2K
Nonprofit Nonprofit Corporation
Net patient revenue Info Net patient revenue — what the home actually collects for resident care, after contractual allowances, bad debt and discounts are subtracted from its gross charges (CMS cost report, Worksheet G-3). It covers resident care only; money the home earns from other sources is shown separately as "Other income."
$8.3M
Net patient income Info Net patient income: net patient revenue minus the home's total operating expenses. A positive figure means it earns more from resident care than it spends to deliver it; a negative figure means the opposite. It excludes non-operating "other income."
$172.2K
Other income Info Money the home earns outside of resident care — such as investments, grants, rentals and other non-operating sources (CMS cost report, Worksheet G-3). It is tracked separately from net patient revenue: it is not part of that figure, and it is not included in net patient income.
$706.8K
Payroll costs Info Staff salaries plus wage-related costs — benefits such as payroll taxes, health insurance and retirement — from the home's own accounting records (CMS cost report, Worksheet A). Contract or agency labor is counted separately, under other operating costs.
$3.4M 40.7% of net patient revenue Info Payroll as a share of revenue: staff salaries and wage-related benefits divided by net patient revenue. A higher figure means more of each revenue dollar goes to staff pay.
Other operating costs Info Everything it costs to run the home apart from payroll — food, utilities, supplies, maintenance, contract labor and administration. Calculated as total operating expense minus payroll (staff salaries and wage-related benefits).
$4.8M
Total costs Info The home's total operating expense for the year — all the costs of running it, salaries included (CMS cost report, Worksheet G-3).
$8.2M

Who this home usually serves

TYPE OF STAY

Mix of rehab and long-term care

This home supports both short-term rehab and long-term care, with residents staying for a wide range of durations.

New residents most often arrive under private pay (44% of admissions), and a typical private pay stay runs around 4 - 5 months.

Admissions
99 total

Coverage residents most often arrive under.

Medicare 38%
Private pay 44%
Medicaid 17%
Discharges
89 total

Coverage residents most often leave under.

Medicare 27%
Private pay 51%
Medicaid 22%

Places of interest near Villa Maria, Inc

Address 0.0 miles from city center Info Estimated distance in miles from Mulvane's city center to Villa Maria, Inc's address, calculated via Google Maps.

Calculate Travel Distance to Villa Maria, Inc

Add your location

Address

Compare Nursing Homes around the area

The information below is reported by the Kansas Department for Aging and Disability Services.

Villa Maria, Inc
NH
AL
Mulvane - 44 - 49 -
Homestead of Osawatomie
NH
AL
Osawatomie - 40 - 13 Suite
Brookdale Rosehill
NH
AL
Shawnee - 92 A+ 54 Studio / 1 Bed
Ascension Living Via Christi Village McLean
NH
AL
IL
MC
Wichita (Indian Hills) - 95 - 47 Studio / 1 Bed
Ascension Living Via Christi Village Manhattan
NH
AL
IL
Manhattan (Willow Grove Road) - 129 - 10 Studio / 1 Bed / 2 Bed

Frequently Asked Questions about Villa Maria, Inc

Is Villa Maria, Inc in a walkable area?

Villa Maria, Inc has a walk score of 49. Somewhat walkable. A few nearby services may be reachable on foot, but most trips require transportation.

What is the occupancy rate at Villa Maria, Inc?

Villa Maria, Inc's occupancy is 70%.

Does Villa Maria, Inc operate as a for-profit or non-profit?

Villa Maria, Inc is registered as a non-profit in KS.

Who is the administrator of Villa Maria, Inc?

Teresa Ballard is the administrator of Villa Maria, Inc.

How many beds does Villa Maria, Inc have?

Villa Maria, Inc has 44 beds.

Are there photos of Villa Maria, Inc?

Yes — there are 2 photos of Villa Maria, Inc in the photo gallery on this page.

What is the address of Villa Maria, Inc?

Villa Maria, Inc is located at 633 E Main Street, Mulvane, KS 67110.

Guides for Better Senior Living

Care Cost Calculator: See Prices in Your Area

Nursing Home Data Explorer

Don’t Wait Too Long: 7 Red Flag Signs Your Parent Needs Assisted Living Now

The True Cost of Assisted Living in 2025 – And How Families Are Paying For It

Understanding Senior Living Costs: Pricing Models, Discounts & Financial Assistance