Claridge Court
Nursing Home & Independent Living · Prairie Village, KS
CMS overall rating Info CMS (the Centers for Medicare & Medicaid Services) is the federal agency that rates nursing home quality. Its Overall Rating runs from 1 to 5 stars, combining health inspections, staffing, and quality measures, with inspections weighted most heavily.

Claridge Court

Nursing Home & Independent Living · Prairie Village, KS
CMS overall rating Info CMS (the Centers for Medicare & Medicaid Services) is the federal agency that rates nursing home quality. Its Overall Rating runs from 1 to 5 stars, combining health inspections, staffing, and quality measures, with inspections weighted most heavily.
Calculator: See prices in your area
Claridge Court accepts Medicare and private pay.

Overview of Claridge Court

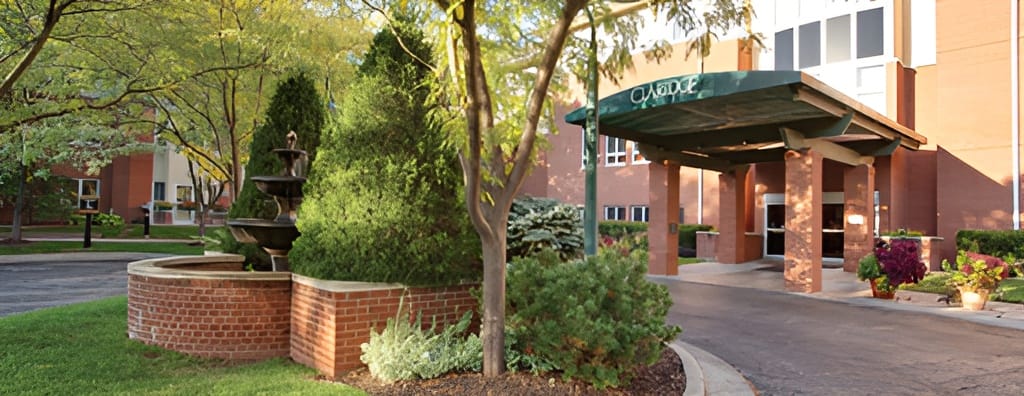
Lifespace Communities Inc. is a senior living community located in Prairie Village, Kansas. It offers a classic lifestyle in a beloved neighborhood, focusing on providing residents with a supportive and encouraging environment. The community is dedicated to helping residents live with ambition and purpose.

Quality ratings

Measured by Centers for Medicare & Medicaid Services (CMS)

Overall rating Info The Overall CMS Rating combines results from health inspections, staffing levels and quality measures. Health inspections carry the most weight. Staffing and quality scores can increase or decrease the final rating based on performance compared to state and national standards.
Health Inspection Info Based on the results of the facility's three most recent standard inspections and any complaint investigations. CMS reviews the number, scope, and severity of deficiencies, with more recent findings weighted more heavily.
Staffing Info Measures average nursing staff hours per resident per day, including Registered Nurses (RNs) and total nursing staff. Ratings are adjusted based on the level of care residents require and are compared to state and national benchmarks.
Quality Measures Info Based on clinical and physical health indicators reported to CMS, such as hospital readmissions, falls, pressure ulcers, and improvements in mobility. These measures reflect how well residents' health needs are being managed.

Staffing hours breakdown

Info Daily nursing hours per resident by staff type, reported to CMS. Higher is generally better — compare this facility to state and national averages to see where staffing stands.

Hours per resident per day — compared to state averages

Total nursing care / resident Info Total adjusted nursing hours per resident per day, combining RN, LPN, and aide time. CMS adjusts this for case-mix so facilities can be fairly compared.
4h 19m per day
vs avg
Staff typeHours / Day / Residentvs state avg
Registered Nurse (RN) Info RNs hold the highest nursing license and can assess residents, interpret test results, and direct care plans. More RN hours per day often signals stronger clinical oversight and faster response to health changes. 57m per day
LPN / LVN Info Licensed Practical Nurses (LPNs) or Licensed Vocational Nurses (LVNs) deliver routine hands-on care — medication administration, wound dressing, and monitoring vital signs. They work under RN supervision and make up a large share of daily bedside care. 44m per day
Nurse Aide Info Certified Nurse Aides (CNAs) provide the most direct day-to-day assistance: bathing, dressing, feeding, and mobility. Nurse aide hours are typically the largest staffing category and directly affect residents' quality of life. 2h 30m per day
Weekend Total Nursing Info Combined nursing hours (RN + LPN + Nurse Aide) per resident per day on weekends. Staffing often drops on weekends — this figure reveals whether the facility maintains adequate coverage outside of weekday hours. 3h 44m per day
Physical Therapist Info Hours per resident per day provided by licensed Physical Therapists (PTs) or PT Assistants. PT services help residents recover mobility after injury or illness and are especially important for post-acute (short-stay) rehabilitation. 7m per day
Weekend RN Info Registered nurse hours specifically on weekends. Facilities sometimes reduce RN presence on Saturdays and Sundays — a low weekend RN figure compared to weekday hours can indicate reduced clinical oversight when most administrative staff are absent. 37m per day

Capacity and availability

Avg. Length of Stay
68 days
Bed community size
45-bed community Rank #152 / 224Bed count — State benchmarkedThis home is ranked 152nd out of 224 homes in Kansas. Shows this facility's certified or reported bed count compared to other Kansas facilities. Larger communities may offer more amenities, programs, and on-site services for residents and families.Rankings are based only on facilities in Kansas that report data for that category. Facilities without available data are excluded from the ranking.Click the rank badge to see the full State ranking.Click here to see the full State ranking.
A moderately sized community that may balance personal attention with shared amenities and social activities.
Years in operation
48 years in operation
A longer operating history, which may indicate experience navigating regulations and delivering ongoing care.
Walk Score
Walk Score: 64 / 100 Rank #77 / 363Walk Score — State benchmarkedThis home is ranked 77th out of 363 homes in Kansas. Shows how walkable this facility's neighborhood is compared to the average Walk Score across Kansas facilities. Higher scores benefit residents, families, and staff.Rankings are based only on facilities in Kansas that report data for that category. Facilities without available data are excluded from the ranking.Click the rank badge to see the full State ranking.Click here to see the full State ranking.
Moderately walkable. Some errands can be accomplished on foot, with a mix of nearby amenities.
BBB Rating
BBB Rating: A+ (Not Accredited)
An independent rating from the Better Business Bureau based on factors such as complaint history, transparency, and business practices.
How BBB ratings work

About this community

Occupancy

Occupancy rate
84%
Higher than the Kansas average: 79.5%
Occupied beds
38 / 45
Average occupied beds in Kansas homes 50 beds

License Details

Facility TypeNursing Facility
StatusActive
CountyJohnson
License Number175343
CMS Certification Number175343

Ownership & Operating Entity

Claridge Court is administered by Emily Filla.

Owner NameLifespace Communities Inc

Staffing

Key information about the people who lead and staff this community.

Leadership

ContactRob Salierno, Executive Director

Contact Claridge Court

Inspection History

In Kansas, the Department for Aging and Disability Services, Survey and Certification Commission performs the unannounced inspections required for facility licensing and federal certification.

Since 2011 · 15 years of data 120 deficiencies

Inspection Scorecard Info This scorecard compares key inspection, deficiency, and complaint metrics at this facility against the Kansas state average. Metrics rated ≥15% worse than average are highlighted in red; those ≥15% better are highlighted in green.

Since 2011 vs. Kansas state average
Overall vs. KS average 2 Worse Metrics worse than Kansas average:
• Total deficiencies (20% above)
• Deficiencies per year (19% above)
0 Better No metrics in this bucket.
Latest Inspection March 11, 2024

Deficiencies Info Deficiencies are formal regulatory issues recorded during state inspections.

This FacilityKS Averagevs. KS Avg
Total deficiencies Info Formal regulatory issues recorded by inspectors across all inspection types. 120100 This facility has 20% more total deficiencies than a typical Kansas assisted living residence (120 vs. KS avg 100).↑ 20% worse
Deficiencies per year Info Average deficiencies per year since 2011. 86.7 This facility has 19% more deficiencies per year than a typical Kansas assisted living residence (8 vs. KS avg 6.7).↑ 19% worse

Inspection Reports Summary Info An editor-reviewed summary of the themes and findings across this facility's recent inspection reports.

  • The most recent inspection on April 19, 2024, found the facility in compliance with all regulations and no new deficiencies. Earlier inspections had cited multiple deficiencies related to care planning, pressure ulcer prevention, resident safety, staff performance reviews, medication management, antipsychotic medication use, and food service safety. Prior complaint investigations were mostly unsubstantiated, with the exception of a substantiated case in 2016 involving failure to implement a physician-ordered chair alarm that resulted in a resident fall and injury. Enforcement actions included denial of payment for new Medicare admissions in 2015 due to deficiencies at a level of actual harm that was not immediate jeopardy. The facility appears to have made improvements over time, correcting prior deficiencies and maintaining compliance in the most recent survey.

Health Inspection History

Inspections since 2021
Total health inspections 3

State average N/A


Last Health inspection on Feb 2024

Total health citations
19

State average N/A

Citations per inspection
6.33

State average N/A


Health citations are formal notices following inspections when they fail to comply with safety and care standards.

All 19 citations resulted from standard inspections.

Breakdown of citation severity (last 5 years)
Critical health citations
0
In line with State average

State average: N/A


Serious health citations
1
In line with State average

State average: N/A

0 critical citations State average: N/A

1 serious citation State average: N/A

17 moderate citations State average: N/A

1 minor citation State average: N/A
Citations history (last 5 years)
Nursing Services moderate citation Feb 27, 2024
Corrected

Nutrition moderate citation Feb 27, 2024
Corrected

Pharmacy moderate citation Feb 27, 2024
Corrected

Pharmacy moderate citation Feb 27, 2024
Corrected

Staffing Data

Reporting period: October 1 – December 31, 2025 (Q4 2025). Source: CMS Payroll-Based Journal report.

Total staff 94
Employees 67
Contractors 27
Staff to resident ratio 2.61 : 1
0% compared with State average

State average ratio: 0 : 0

Avg staff/day 31
Average shift 7.4 hours
0% compared with State average

State average: 0 hours

Total staff hours (quarter) 21,049

Nursing staff breakdown

Q4 2025 · Oct 1 – Dec 31 More info This data comes from the CMS Payroll-Based Journal report covering October 1 – December 31, 2025.
Registered Nurse

Manages medical care and health needs.

RN Staff Info 11 total: 9 full-time employees and 2 contractors. 11
Average shift length Info Average shift length. Calculated as total hours divided by days worked and average staff per day. 7.4 hours
Licensed Practical Nurse

Assists with medical care and medications.

LPN Staff Info 10 total: 9 full-time employees and 1 contractor. 10
Average shift length Info Average shift length. Calculated as total hours divided by days worked and average staff per day. 8.2 hours
Certified Nursing Assistant

Helps with daily care and mobility.

CNA Staff Info 42 total: 32 full-time employees and 10 contractors. 42
Average shift length Info Average shift length. Calculated as total hours divided by days worked and average staff per day. 7.7 hours

Contractor staffing

Q4 2025 · Oct 1 – Dec 31 More info This data comes from the CMS Payroll-Based Journal report covering October 1 – December 31, 2025.

Total hours from contractors

12.5%

2,636 contractor hours this quarter

Certified Nursing Assistant: 10 Speech Language Pathologist: 5 Respiratory Therapy Technician: 3 Registered Nurse: 2 Qualified Social Worker: 2 Physical Therapy Assistant: 2 Physical Therapy Aide: 1 Occupational Therapy Aide: 1 Licensed Practical Nurse: 1

Staff by category

Q4 2025 · Oct 1 – Dec 31 More info This data comes from the CMS Payroll-Based Journal report covering October 1 – December 31, 2025.
Certified Nursing Assistant3210428,91392100%7.7
Licensed Practical Nurse91102,73792100%8.2
Registered Nurse92112,53892100%7.4
Dietitian4041,0546672%7.1
Speech Language Pathologist0551,0387177%5
Medication Aide/Technician2029898188%12
Clinical Nurse Specialist4047906065%7.8
Administrator1015126470%8
Respiratory Therapy Technician0334686975%4.9
Mental Health Service Worker1014615863%7.9
Physical Therapy Aide0114296166%7
Nurse Practitioner3034243033%8
Occupational Therapy Aide0113204043%8
RN Director of Nursing1011361718%8
Qualified Social Worker0221124650%2.4
Physical Therapy Assistant0221114852%2.3
Other Dietary Services Staff1011733%5.7
42 Certified Nursing Assistant
% of Days 100%
10 Licensed Practical Nurse
% of Days 100%
11 Registered Nurse
% of Days 100%
4 Dietitian
% of Days 72%
5 Speech Language Pathologist
% of Days 77%
2 Medication Aide/Technician
% of Days 88%
4 Clinical Nurse Specialist
% of Days 65%
1 Administrator
% of Days 70%
3 Respiratory Therapy Technician
% of Days 75%
1 Mental Health Service Worker
% of Days 63%
1 Physical Therapy Aide
% of Days 66%
3 Nurse Practitioner
% of Days 33%
1 Occupational Therapy Aide
% of Days 43%
1 RN Director of Nursing
% of Days 18%
2 Qualified Social Worker
% of Days 50%
2 Physical Therapy Assistant
% of Days 52%
1 Other Dietary Services Staff
% of Days 3%

Penalties and fines

Includes penalties issued in 2024

Federal penalties imposed by CMS for regulatory violations, including civil money penalties (fines) and denials of payment for new Medicare/Medicaid admissions.

Source: CMS Penalties Database (Data as of Jan 2026)

Total fines amount $18K
59% lower than State average

State average: $44K

Number of fines 1
59% fewer fines than State average

State average: 2.4

Payment Denials Info Serious action where Medicare and/or Medicaid temporarily stops payments for new residents until issues are fixed. 0
100% fewer payment denials than State average

State average: 0.3

Fines amount comparison
This facility $18K
State average $44K
Penalty History

Penalties are imposed by CMS for violations of federal nursing home regulations.

1 penalty in the past 3 years

Apr 16, 2024 · $18K

Civil Money Penalty Info Fines imposed for noncompliance, which can be assessed per day or per instance of violation. Apr 16, 2024
$18K

Last updated: Jan 2026

Quality of care over time

These measures show how residents usually do over time at this home, based on health outcomes and preventive care.

High-risk clinical events score Info A composite score based on pressure ulcers, falls with injury, weight loss, walking ability decline, and activities of daily living decline. 15.6
49% worse than State average

State average: 10.5

Functional decline score Info A composite score based on activities of daily living decline, walking ability decline, and incontinence. 31.5
52% worse than State average

State average: 20.7

Long-stay resident measures
Need for Help with Daily Activities Increased Info Percent of long-stay residents whose need for help with daily activities has increased 27.5%
45% worse than State average

State average: 19.0%

Walking Ability Worsened Info Percent of long-stay residents whose ability to move independently worsened 36.8%
90% worse than State average

State average: 19.4%

Low Risk Residents with Bowel/Bladder Incontinence Info Percent of low risk long-stay residents who lose control of their bowels or bladder 30.2%
27% worse than State average

State average: 23.8%

Falls with Major Injury Info Percent of long-stay residents experiencing one or more falls with major injury 5.4%
22% worse than State average

State average: 4.4%

High Risk Residents with Pressure Ulcers Info Percent of long-stay high risk residents with pressure ulcers 7.3%
57% worse than State average

State average: 4.6%

Urinary Tract Infection Info Percent of long-stay residents with a urinary tract infection 0.9%
70% better than State average

State average: 3.1%

Lost Too Much Weight Info Percent of long-stay residents who lose too much weight 1.3%
75% better than State average

State average: 5.1%

Depressive Symptoms Info Percent of long-stay residents who have depressive symptoms 2.2%
58% better than State average

State average: 5.2%

Antipsychotic Use Info Percent of long-stay residents who received an antipsychotic medication 8.1%
52% better than State average

State average: 16.9%

Pneumococcal Vaccine Info Percent of long-stay residents assessed and appropriately given the pneumococcal vaccine 85.7%
7% worse than State average

State average: 91.9%

Influenza Vaccine Info Percent of long-stay residents assessed and appropriately given the seasonal influenza vaccine 100.0%
5% better than State average

State average: 95.5%

Short-stay resident measures
Pneumococcal Vaccine Info Percent of short-stay residents assessed and appropriately given the pneumococcal vaccine 74.0%
In line with State average

State average: 75.6%

Antipsychotic medication increase Info Percent of short-stay residents who newly received an antipsychotic medication 0.0%
100% better than State average

State average: 2.2%

Influenza Vaccine Info Percent of short-stay residents assessed and appropriately given the seasonal influenza vaccine 89.6%
22% better than State average

State average: 73.5%

Breakdown by payment type

Medicare

75% of new residents, usually for short-term rehab.

Typical stay 26 days

Private pay

25% of new residents, often for short stays.

Typical stay 6 - 7 months

Facility Characteristics

Source: CMS Long-Term Care Facility Characteristics (Data as of Jan 2026)

Total residents 36
Medicare
8
22.2% of residents
Private pay or other
28
77.8% of residents
Programs & Services
Residents Group

Residents meet regularly to discuss policies, care quality, and activities

Family Member Group

Family members meet regularly to discuss policies, care quality, and activities

CCRC

Part of a Continuing Care Retirement Community offering multiple care levels

Active Family Council

Organized group of family members that meets regularly to discuss facility policies, resident care, and activities.

Active Resident Council

Organized group of residents that meets regularly to discuss facility policies, quality of life, and activities.

Finances and operations

Based on CMS SNF Cost Report for fiscal year ending in 12/2023.

Nonprofit
Nonprofit Corporation
Net patient revenue Info Net patient revenue — what the home actually collects for resident care, after contractual allowances, bad debt and discounts are subtracted from its gross charges (CMS cost report, Worksheet G-3). It covers resident care only; money the home earns from other sources is shown separately as "Other income."
$13.4M
Net patient income Info Net patient income: net patient revenue minus the home's total operating expenses. A positive figure means it earns more from resident care than it spends to deliver it; a negative figure means the opposite. It excludes non-operating "other income."
-$1.7M
Nonprofit Nonprofit Corporation
Net patient revenue Info Net patient revenue — what the home actually collects for resident care, after contractual allowances, bad debt and discounts are subtracted from its gross charges (CMS cost report, Worksheet G-3). It covers resident care only; money the home earns from other sources is shown separately as "Other income."
$13.4M
Net patient income Info Net patient income: net patient revenue minus the home's total operating expenses. A positive figure means it earns more from resident care than it spends to deliver it; a negative figure means the opposite. It excludes non-operating "other income."
-$1.7M
Other income Info Money the home earns outside of resident care — such as investments, grants, rentals and other non-operating sources (CMS cost report, Worksheet G-3). It is tracked separately from net patient revenue: it is not part of that figure, and it is not included in net patient income.
-$3.0M
Payroll costs Info Staff salaries plus wage-related costs — benefits such as payroll taxes, health insurance and retirement — from the home's own accounting records (CMS cost report, Worksheet A). Contract or agency labor is counted separately, under other operating costs.
$7.0M 51.7% of net patient revenue Info Payroll as a share of revenue: staff salaries and wage-related benefits divided by net patient revenue. A higher figure means more of each revenue dollar goes to staff pay.
Other operating costs Info Everything it costs to run the home apart from payroll — food, utilities, supplies, maintenance, contract labor and administration. Calculated as total operating expense minus payroll (staff salaries and wage-related benefits).
$8.1M
Total costs Info The home's total operating expense for the year — all the costs of running it, salaries included (CMS cost report, Worksheet G-3).
$15.1M

Who this home usually serves

TYPE OF STAY

Mostly short-term rehab stays

Most residents typically stay for a few weeks or months before returning home or moving on.

Most new residents arrive under Medicare (75% of admissions), and a typical Medicare stay runs around 26 days.

Admissions
221 total

Coverage residents most often arrive under.

Medicare 75%
Private pay 25%
Discharges
225 total

Coverage residents most often leave under.

Medicare 56%
Private pay 44%

Places of interest near Claridge Court

Address 0.3 miles from city center Info Estimated distance in miles from Prairie Village's city center to Claridge Court's address, calculated via Google Maps.

Calculate Travel Distance to Claridge Court

Add your location

Address

Compare Nursing Homes around the area

The information below is reported by the Kansas Department for Aging and Disability Services.

Claridge Court
NH
IL
Prairie Village (Prairie Hills) -45 A+ 64 -
Brookdale Rosehill
NH
AL
Shawnee -92 A+ 54 Studio / 1 Bed
Meadowlark Hills Retirement Community
NH
HC
IL
NC
Manhattan (Meadowlark Road) -134 - 28 1 Bed / 2 Bed / 3 Bed
Ascension Living Via Christi Village McLean
NH
AL
IL
MC
Wichita (Indian Hills) -95 - 47 Studio / 1 Bed
Ascension Living Via Christi Village Manhattan
NH
AL
IL
Manhattan (Willow Grove Road) -129 - 10 Studio / 1 Bed / 2 Bed

Frequently Asked Questions about Claridge Court

What neighborhood is Claridge Court in?

Claridge Court is in the Prairie Hills neighborhood of PRAIRIE VILLAGE.

Who is the owner of Claridge Court?

Claridge Court is legally operated by Lifespace Communities Inc, and administered by Emily Filla.

Is Claridge Court in a walkable area?

Claridge Court has a walk score of 64. Moderately walkable. Some errands can be accomplished on foot, with a mix of nearby amenities.

What is the license number of Claridge Court?

According to KS state health department records, Claridge Court's license number is 175343.

What is the occupancy rate at Claridge Court?

Claridge Court's occupancy is 84%.

Does Claridge Court operate as a for-profit or non-profit?

Claridge Court is registered as a non-profit in KS.

Who is the administrator of Claridge Court?

Emily Filla is the administrator of Claridge Court.

Guides for Better Senior Living

Care Cost Calculator: See Prices in Your Area

Nursing Home Data Explorer

Don’t Wait Too Long: 7 Red Flag Signs Your Parent Needs Assisted Living Now

The True Cost of Assisted Living in 2025 – And How Families Are Paying For It

Understanding Senior Living Costs: Pricing Models, Discounts & Financial Assistance