Wheatridge Park Care Center
Nursing Home, Independent Living & Respite Care · Liberal, KS
CMS overall rating Info CMS (the Centers for Medicare & Medicaid Services) is the federal agency that rates nursing home quality. Its Overall Rating runs from 1 to 5 stars, combining health inspections, staffing, and quality measures, with inspections weighted most heavily.

Wheatridge Park Care Center

Nursing Home, Independent Living & Respite Care · Liberal, KS
CMS overall rating Info CMS (the Centers for Medicare & Medicaid Services) is the federal agency that rates nursing home quality. Its Overall Rating runs from 1 to 5 stars, combining health inspections, staffing, and quality measures, with inspections weighted most heavily.
Calculator: See prices in your area
Wheatridge Park Care Center accepts Medicare, Medicaid, and private pay.

Overview of Wheatridge Park Care Center

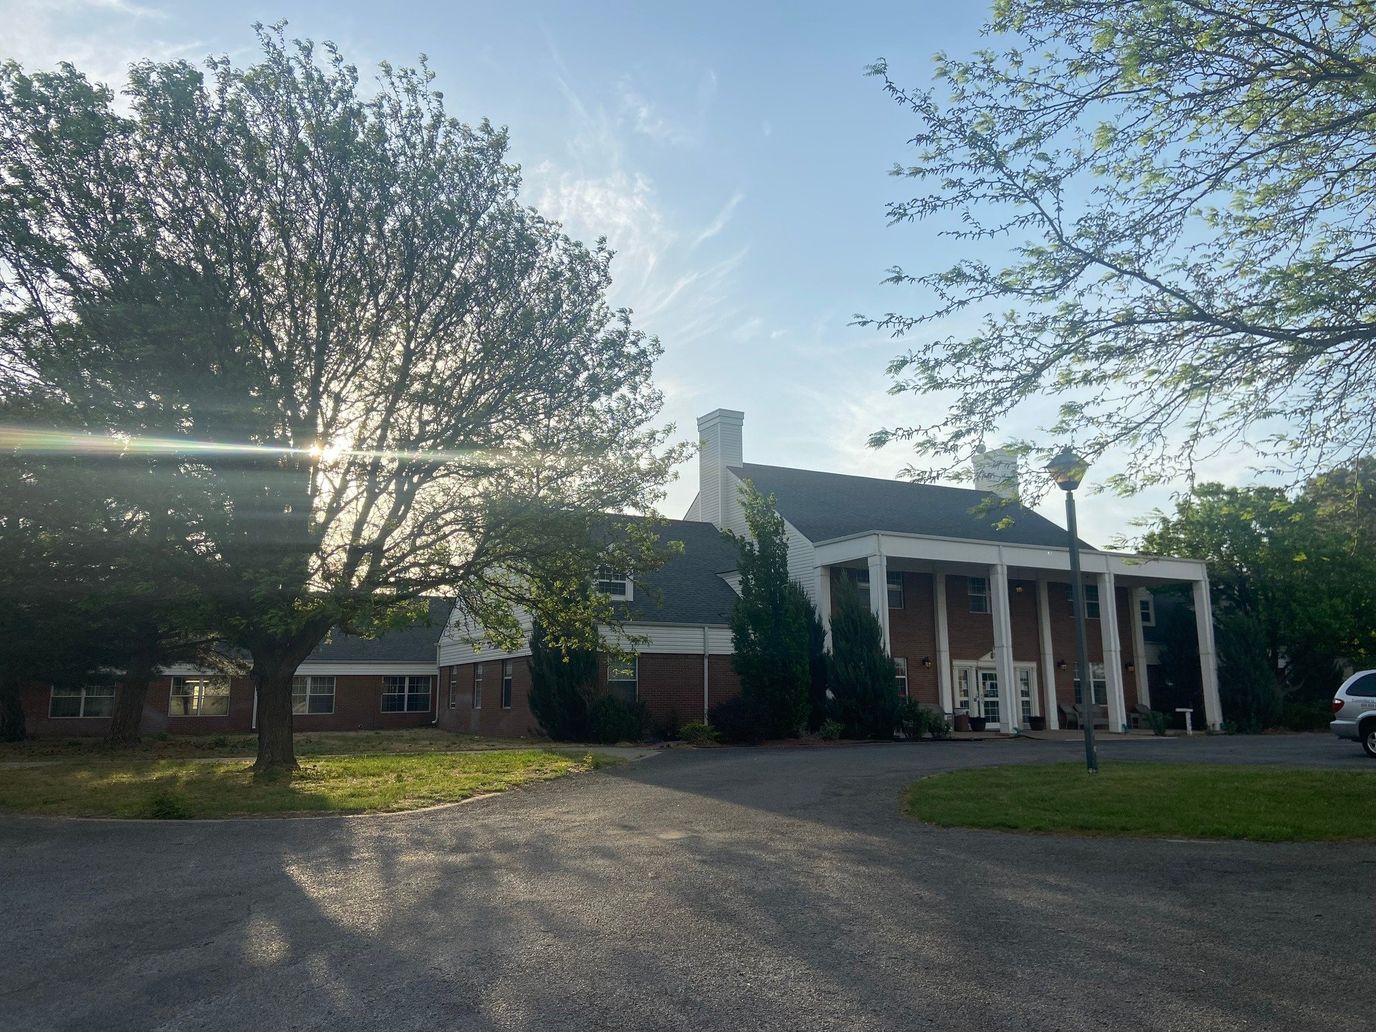
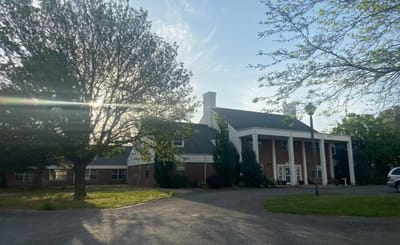
Wheatridge Park Care Center is a 45-bed skilled nursing and rehabilitation community in Liberal, Kansas, offering skilled nursing, extended care, short-term rehabilitation, respite care, and memory care. The facility is operated by Liberal SNF Holdco LLC. It accepts Medicare, Medicaid, and private pay.

CMS rates the facility 1 star overall — primarily due to its Health Inspection score, which is 62% below the Kansas average. Over seven years of inspection data on file, the facility averaged 15.3 deficiencies per year, compared with a Kansas average of 6.

Two substantiated complaint investigations, in 2014 and 2015, identified failures in fall prevention, medication oversight, and resident care planning. No fines or enforcement actions were documented.

The most recent inspection, in August 2018, found zero deficiencies — a marked contrast to earlier years. Nurse staffing averages 3 hours and 49 minutes per resident per day, 19% below the Kansas average of 4 hours and 43 minutes, with Quality Measures also trailing the state.

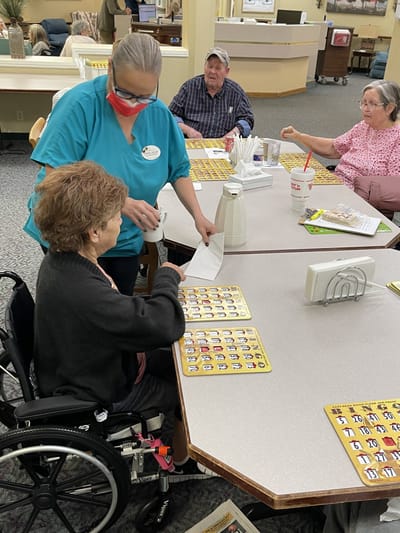
The facility’s occupancy rate tells a different story: at 98%, the facility operates near capacity, well above the Kansas average of 79.5%. The Rehab to Home program targets short-stay post-acute recovery. The facility also provides 24-hour staffing.

Wheatridge Park Care Center is best suited for residents seeking skilled nursing or short-term rehabilitation in Seward County, particularly those prioritizing proximity and immediate availability over star-rating benchmarks.

Quality ratings

Measured by Centers for Medicare & Medicaid Services (CMS)

Overall rating Info The Overall CMS Rating combines results from health inspections, staffing levels and quality measures. Health inspections carry the most weight. Staffing and quality scores can increase or decrease the final rating based on performance compared to state and national standards.
Health Inspection Info Based on the results of the facility's three most recent standard inspections and any complaint investigations. CMS reviews the number, scope, and severity of deficiencies, with more recent findings weighted more heavily.
Staffing Info Measures average nursing staff hours per resident per day, including Registered Nurses (RNs) and total nursing staff. Ratings are adjusted based on the level of care residents require and are compared to state and national benchmarks.
Quality Measures Info Based on clinical and physical health indicators reported to CMS, such as hospital readmissions, falls, pressure ulcers, and improvements in mobility. These measures reflect how well residents' health needs are being managed.

Staffing hours breakdown

Info Daily nursing hours per resident by staff type, reported to CMS. Higher is generally better — compare this facility to state and national averages to see where staffing stands.

Hours per resident per day — compared to state averages

Total nursing care / resident Info Total adjusted nursing hours per resident per day, combining RN, LPN, and aide time. CMS adjusts this for case-mix so facilities can be fairly compared.
3h 49m per day
vs avg

3 of 6 metrics below state avg

Standout metric Weekend RN is +21% above state avg
Staff typeHours / Day / Residentvs state avg
Registered Nurse (RN) Info RNs hold the highest nursing license and can assess residents, interpret test results, and direct care plans. More RN hours per day often signals stronger clinical oversight and faster response to health changes. 44m per day ▲ 3% State avg: 43m per day · National avg: 41m per day
LPN / LVN Info Licensed Practical Nurses (LPNs) or Licensed Vocational Nurses (LVNs) deliver routine hands-on care — medication administration, wound dressing, and monitoring vital signs. They work under RN supervision and make up a large share of daily bedside care. 16m per day ▼ 61% State avg: 40m per day · National avg: 52m per day
Nurse Aide Info Certified Nurse Aides (CNAs) provide the most direct day-to-day assistance: bathing, dressing, feeding, and mobility. Nurse aide hours are typically the largest staffing category and directly affect residents' quality of life. 2h 40m per day ■ Avg State avg: 2h 41m per day · National avg: 2h 20m per day
Weekend Total Nursing Info Combined nursing hours (RN + LPN + Nurse Aide) per resident per day on weekends. Staffing often drops on weekends — this figure reveals whether the facility maintains adequate coverage outside of weekday hours. 3h 22m per day ▼ 6% State avg: 3h 35m per day · National avg: 3h 26m per day
Physical Therapist Info Hours per resident per day provided by licensed Physical Therapists (PTs) or PT Assistants. PT services help residents recover mobility after injury or illness and are especially important for post-acute (short-stay) rehabilitation. 1m per day ▼ 74% State avg: 2m per day · National avg: 4m per day
Weekend RN Info Registered nurse hours specifically on weekends. Facilities sometimes reduce RN presence on Saturdays and Sundays — a low weekend RN figure compared to weekday hours can indicate reduced clinical oversight when most administrative staff are absent. 36m per day ▲ 21% State avg: 30m per day · National avg: 28m per day

Capacity and availability

Avg. Length of Stay
94 days
Bed community size
45-bed community Rank #152 / 224Bed count — State benchmarkedThis home is ranked 152nd out of 224 homes in Kansas. Shows this facility's certified or reported bed count compared to other Kansas facilities. Larger communities may offer more amenities, programs, and on-site services for residents and families.Rankings are based only on facilities in Kansas that report data for that category. Facilities without available data are excluded from the ranking.Click the rank badge to see the full State ranking.Click here to see the full State ranking.
A moderately sized community that may balance personal attention with shared amenities and social activities.
Walk Score
Walk Score: 81 / 100 Rank #12 / 363Walk Score — State benchmarkedThis home is ranked 12th out of 363 homes in Kansas. Shows how walkable this facility's neighborhood is compared to the average Walk Score across Kansas facilities. Higher scores benefit residents, families, and staff.Rankings are based only on facilities in Kansas that report data for that category. Facilities without available data are excluded from the ranking.Click the rank badge to see the full State ranking.Click here to see the full State ranking.
Very walkable. Most errands can be accomplished on foot, and many essentials are within a short walk.

About this community

Occupancy

Occupancy rate
89%
Higher than the Kansas average: 79.5%
Occupied beds
40 / 45
Average occupied beds in Kansas homes 50 beds

Awards

Great Place to Work
National Quality Award
Pinnacle Customer Experience Award

License Details

Facility TypeNursing Facility
StatusActive
CountySeward
License Number175459
CMS Certification Number175459

Ownership & Operating Entity

Wheatridge Park Care Center is administered by Doug Wyckoff.

Owner NameLiberal Snf Real Co LLC

Therapy & Rehabilitation

2 services
Rehabilitation Services
Respite Care

Staffing & Medical

1 service
24-Hour Staffing

Additional Services

1 service
Extended Care

Amenities & Lifestyle

Specific ProgramsRehab to Home
Operating HoursVisiting Hours 24/7

Contact Wheatridge Park Care Center

Inspection History

In Kansas, the Department for Aging and Disability Services, Survey and Certification Commission performs the unannounced inspections required for facility licensing and federal certification.

Since 2012 · 14 years of data 144 deficiencies

Inspection Scorecard Info This scorecard compares key inspection, deficiency, and complaint metrics at this facility against the Kansas state average. Metrics rated ≥15% worse than average are highlighted in red; those ≥15% better are highlighted in green.

Since 2012 vs. Kansas state average
Overall vs. KS average 2 Worse Metrics worse than Kansas average:
• Total deficiencies (44% above)
• Deficiencies per year (45% above)
0 Better No metrics in this bucket.
Latest Inspection September 23, 2024

Deficiencies Info Deficiencies are formal regulatory issues recorded during state inspections.

This FacilityKS Averagevs. KS Avg
Total deficiencies Info Formal regulatory issues recorded by inspectors across all inspection types. 144100 This facility has 44% more total deficiencies than a typical Kansas assisted living residence (144 vs. KS avg 100).↑ 44% worse
Deficiencies per year Info Average deficiencies per year since 2012. 10.37.1 This facility has 45% more deficiencies per year than a typical Kansas assisted living residence (10.3 vs. KS avg 7.1).↑ 45% worse

Inspection Reports Summary Info An editor-reviewed summary of the themes and findings across this facility's recent inspection reports.

  • The most recent inspection on August 27, 2018 found no deficiencies and confirmed the facility was in compliance with all regulations surveyed. Earlier inspections showed a pattern of deficiencies primarily related to immunization documentation, resident care planning, medication management, food handling, and sanitation practices. Complaint investigations from 2014 and 2015 identified issues with fall prevention, medication oversight, and care plan updates, some of which were substantiated and addressed through plans of correction. Enforcement actions such as fines or license suspensions were not listed in the available reports. The facility appears to have made improvements over time, with repeated revisits confirming correction of prior deficiencies.

Health Inspection History

Inspections since 2021
Total health inspections 4

State average N/A


Last Health inspection on Sep 2024

Total health citations
34

State average N/A

Citations per inspection
8.5

State average N/A


Health citations are formal notices following inspections when they fail to comply with safety and care standards.

11 of 34 citations resulted from standard inspections; 1 of 34 resulted from complaint investigations; and 22 of 34 came from combined inspections (standard and complaint).

Breakdown of citation severity (last 5 years)
Critical health citations
1
In line with State average

State average: N/A


Serious health citations
2
In line with State average

State average: N/A

1 critical citation State average: N/A

2 serious citations State average: N/A

29 moderate citations State average: N/A

2 minor citations State average: N/A
Citations history (last 5 years)
Administration moderate citation Sep 16, 2024
Corrected

Environmental moderate citation Sep 16, 2024
Corrected

Infection Control moderate citation Sep 16, 2024
Corrected

Infection Control moderate citation Sep 16, 2024
Corrected

Staffing Data

Reporting period: October 1 – December 31, 2025 (Q4 2025). Source: CMS Payroll-Based Journal report.

Total staff 69
Employees 53
Contractors 16
Staff to resident ratio 1.73 : 1
0% compared with State average

State average ratio: 0 : 0

Avg staff/day 22
Average shift 8.2 hours
0% compared with State average

State average: 0 hours

Total staff hours (quarter) 16,550

Nursing staff breakdown

Q4 2025 · Oct 1 – Dec 31 More info This data comes from the CMS Payroll-Based Journal report covering October 1 – December 31, 2025.
Registered Nurse

Manages medical care and health needs.

RN Staff Info All 7 RN Staff are full-time employees. No contractors work on this role. 7
Average shift length Info Average shift length. Calculated as total hours divided by days worked and average staff per day. 8.1 hours
Licensed Practical Nurse

Assists with medical care and medications.

LPN Staff Info All 3 LPN Staff are full-time employees. No contractors work on this role. 3
Average shift length Info Average shift length. Calculated as total hours divided by days worked and average staff per day. 8.7 hours
Certified Nursing Assistant

Helps with daily care and mobility.

CNA Staff Info 30 total: 26 full-time employees and 4 contractors. 30
Average shift length Info Average shift length. Calculated as total hours divided by days worked and average staff per day. 8.5 hours

Contractor staffing

Q4 2025 · Oct 1 – Dec 31 More info This data comes from the CMS Payroll-Based Journal report covering October 1 – December 31, 2025.

Total hours from contractors

7.1%

1,183 contractor hours this quarter

Certified Nursing Assistant: 4 Qualified Social Worker: 3 Occupational Therapy Aide: 2 Respiratory Therapy Technician: 1 Physical Therapy Assistant: 1 Speech Language Pathologist: 1 Medical Director: 1 Mental Health Service Worker: 1 Physical Therapy Aide: 1 Occupational Therapy Assistant: 1

Staff by category

Q4 2025 · Oct 1 – Dec 31 More info This data comes from the CMS Payroll-Based Journal report covering October 1 – December 31, 2025.
Certified Nursing Assistant264307,78592100%8.5
Medication Aide/Technician6062,40392100%8.6
Registered Nurse7071,7528997%8.1
Licensed Practical Nurse3031,0037683%8.7
Dental Services Staff3036286874%7.8
Nurse Practitioner1015476368%8.7
Speech Language Pathologist0115186773%7.7
Clinical Nurse Specialist1015145964%8.7
Administrator1014786065%8
Physical Therapy Assistant0114576267%7.4
Other Dietary Services Staff5052893841%7.4
Occupational Therapy Assistant0115344%13.1
Respiratory Therapy Technician011342830%1.2
Medical Director011321617%2
Qualified Social Worker033221617%1.3
Occupational Therapy Aide0221455%2.9
Mental Health Service Worker0111233%4
Physical Therapy Aide0111055%2.1
30 Certified Nursing Assistant
% of Days 100%
6 Medication Aide/Technician
% of Days 100%
7 Registered Nurse
% of Days 97%
3 Licensed Practical Nurse
% of Days 83%
3 Dental Services Staff
% of Days 74%
1 Nurse Practitioner
% of Days 68%
1 Speech Language Pathologist
% of Days 73%
1 Clinical Nurse Specialist
% of Days 64%
1 Administrator
% of Days 65%
1 Physical Therapy Assistant
% of Days 67%
5 Other Dietary Services Staff
% of Days 41%
1 Occupational Therapy Assistant
% of Days 4%
1 Respiratory Therapy Technician
% of Days 30%
1 Medical Director
% of Days 17%
3 Qualified Social Worker
% of Days 17%
2 Occupational Therapy Aide
% of Days 5%
1 Mental Health Service Worker
% of Days 3%
1 Physical Therapy Aide
% of Days 5%

Penalties and fines

Includes penalties issued in 2024

Federal penalties imposed by CMS for regulatory violations, including civil money penalties (fines) and denials of payment for new Medicare/Medicaid admissions.

Source: CMS Penalties Database (Data as of Jan 2026)

Total fines amount $159K
261% higher than State average

State average: $44K

Number of fines 2
17% fewer fines than State average

State average: 2.4

Payment Denials Info Serious action where Medicare and/or Medicaid temporarily stops payments for new residents until issues are fixed. 0
100% fewer payment denials than State average

State average: 0.3

Fines amount comparison
This facility $159K
State average $44K
Penalty History

Penalties are imposed by CMS for violations of federal nursing home regulations.

2 penalties in the past 3 years

Multiple penalties were reported in the last 3 years.

Civil Money Penalty Info Fines imposed for noncompliance, which can be assessed per day or per instance of violation. Sep 16, 2024
$28K
Civil Money Penalty Info Fines imposed for noncompliance, which can be assessed per day or per instance of violation. Jan 4, 2024
$131K

Last updated: Jan 2026

Quality of care over time

These measures show how residents usually do over time at this home, based on health outcomes and preventive care.

High-risk clinical events score Info A composite score based on pressure ulcers, falls with injury, weight loss, walking ability decline, and activities of daily living decline. 12.7
21% worse than State average

State average: 10.5

Functional decline score Info A composite score based on activities of daily living decline, walking ability decline, and incontinence. 25.1
21% worse than State average

State average: 20.7

Long-stay resident measures
Average State avg: 3.0 Info CMS star rating based on long-stay quality measure performance. 5 stars = significantly above average, 1 star = significantly below average.
Need for Help with Daily Activities Increased Info Percent of long-stay residents whose need for help with daily activities has increased 25.2%
32% worse than State average

State average: 19.0%

Walking Ability Worsened Info Percent of long-stay residents whose ability to move independently worsened 24.9%
28% worse than State average

State average: 19.4%

Low Risk Residents with Bowel/Bladder Incontinence Info Percent of low risk long-stay residents who lose control of their bowels or bladder 25.1%
5% worse than State average

State average: 23.8%

Falls with Major Injury Info Percent of long-stay residents experiencing one or more falls with major injury 2.8%
36% better than State average

State average: 4.4%

High Risk Residents with Pressure Ulcers Info Percent of long-stay high risk residents with pressure ulcers 6.5%
40% worse than State average

State average: 4.6%

Urinary Tract Infection Info Percent of long-stay residents with a urinary tract infection 2.2%
31% better than State average

State average: 3.1%

Lost Too Much Weight Info Percent of long-stay residents who lose too much weight 3.9%
24% better than State average

State average: 5.1%

Depressive Symptoms Info Percent of long-stay residents who have depressive symptoms 1.6%
69% better than State average

State average: 5.2%

Antipsychotic Use Info Percent of long-stay residents who received an antipsychotic medication 4.4%
74% better than State average

State average: 16.9%

Pneumococcal Vaccine Info Percent of long-stay residents assessed and appropriately given the pneumococcal vaccine 88.8%
In line with State average

State average: 91.9%

Influenza Vaccine Info Percent of long-stay residents assessed and appropriately given the seasonal influenza vaccine 94.7%
In line with State average

State average: 95.5%

Hospitalizations per 1,000 days Info Number of hospitalizations per 1,000 long-stay resident days. 1.78
In line with State average

State average: 1.84

ED visits per 1,000 days Info Number of outpatient emergency department visits per 1,000 long-stay resident days. 0.86
60% better than State average

State average: 2.16

Short-stay resident measures
Significantly below average State avg: 2.6 Info CMS star rating based on short-stay quality measure performance. 5 stars = much above average, 1 star = much below average.
Pneumococcal Vaccine Info Percent of short-stay residents assessed and appropriately given the pneumococcal vaccine 50.4%
33% worse than State average

State average: 75.6%

Antipsychotic medication increase Info Percent of short-stay residents who newly received an antipsychotic medication 1.3%
39% better than State average

State average: 2.2%

Influenza Vaccine Info Percent of short-stay residents assessed and appropriately given the seasonal influenza vaccine 50.0%
32% worse than State average

State average: 73.5%

Re-hospitalized after SNF stay Info Percentage of short-stay residents who were re-hospitalized after their nursing home admission. 23.3%
In line with State average

State average: 23.0%

Emergency department visits Info Percentage of short-stay residents who had an outpatient emergency department visit. 8.3%
29% better than State average

State average: 11.7%

Falls with major injury Info Percentage of SNF residents who experience falls with major injury during their stay. 2.7%
251% worse than State average

State average: 0.8%

Ability to care for self at discharge Info Percentage of residents at or above expected ability to care for themselves at discharge. 19.4%
64% worse than State average

State average: 53.7%

Successful return to home or community Info Rate of successful return to home or community from a skilled nursing facility. 27.4%
46% worse than State average

State average: 50.6%

Breakdown by payment type

Medicare

37% of new residents, usually for short-term rehab.

Typical stay 2 - 3 months

Private pay

43% of new residents, often for short stays.

Typical stay 1 - 2 months

Medicaid

20% of new residents, often for long-term daily care.

Typical stay 7 - 8 months

Facility Characteristics

Source: CMS Long-Term Care Facility Characteristics (Data as of Jan 2026)

Total residents 40
Medicare
4
10% of residents
Medicaid
25
62.5% of residents
Private pay or other
11
27.5% of residents
Programs & Services
Residents Group

Residents meet regularly to discuss policies, care quality, and activities

Active Resident Council

Organized group of residents that meets regularly to discuss facility policies, quality of life, and activities.

Finances and operations

Based on CMS SNF Cost Report for fiscal year ending in 12/2023.

For-profit
Operated by a single business entity.
Net patient revenue Info Net patient revenue — what the home actually collects for resident care, after contractual allowances, bad debt and discounts are subtracted from its gross charges (CMS cost report, Worksheet G-3). It covers resident care only; money the home earns from other sources is shown separately as "Other income."
$5.2M
Net patient income Info Net patient income: net patient revenue minus the home's total operating expenses. A positive figure means it earns more from resident care than it spends to deliver it; a negative figure means the opposite. It excludes non-operating "other income."
$354.3K
For-profit Operated by a single business entity.
Net patient revenue Info Net patient revenue — what the home actually collects for resident care, after contractual allowances, bad debt and discounts are subtracted from its gross charges (CMS cost report, Worksheet G-3). It covers resident care only; money the home earns from other sources is shown separately as "Other income."
$5.2M
Net patient income Info Net patient income: net patient revenue minus the home's total operating expenses. A positive figure means it earns more from resident care than it spends to deliver it; a negative figure means the opposite. It excludes non-operating "other income."
$354.3K
Other income Info Money the home earns outside of resident care — such as investments, grants, rentals and other non-operating sources (CMS cost report, Worksheet G-3). It is tracked separately from net patient revenue: it is not part of that figure, and it is not included in net patient income.
$4.9K
Payroll costs Info Staff salaries plus wage-related costs — benefits such as payroll taxes, health insurance and retirement — from the home's own accounting records (CMS cost report, Worksheet A). Contract or agency labor is counted separately, under other operating costs.
$2.3M 43.5% of net patient revenue Info Payroll as a share of revenue: staff salaries and wage-related benefits divided by net patient revenue. A higher figure means more of each revenue dollar goes to staff pay.
Other operating costs Info Everything it costs to run the home apart from payroll — food, utilities, supplies, maintenance, contract labor and administration. Calculated as total operating expense minus payroll (staff salaries and wage-related benefits).
$2.6M
Total costs Info The home's total operating expense for the year — all the costs of running it, salaries included (CMS cost report, Worksheet G-3).
$4.9M

Who this home usually serves

TYPE OF STAY

Mix of rehab and long-term care

This home supports both short-term rehab and long-term care, with residents staying for a wide range of durations.

New residents most often arrive under private pay (43% of admissions), and a typical private pay stay runs around 1 - 2 months.

Admissions
162 total

Coverage residents most often arrive under.

Medicare 37%
Private pay 43%
Medicaid 20%
Discharges
165 total

Coverage residents most often leave under.

Medicare 39%
Private pay 43%
Medicaid 18%

Places of interest near Wheatridge Park Care Center

Address 0.0 miles from city center Info Estimated distance in miles from Liberal's city center to Wheatridge Park Care Center's address, calculated via Google Maps.

Calculate Travel Distance to Wheatridge Park Care Center

Add your location

Address

Compare Nursing Homes around the area

The information below is reported by the Kansas Department for Aging and Disability Services.

Wheatridge Park Care Center
NH
IL
RC
Liberal -45 - 81 -
Brookdale Rosehill
NH
AL
Shawnee -92 A+ 54 Studio / 1 Bed
Meadowlark Hills Retirement Community
NH
HC
IL
NC
Manhattan (Meadowlark Road) -134 - 28 1 Bed / 2 Bed / 3 Bed
Ascension Living Via Christi Village McLean
NH
AL
IL
MC
Wichita (Indian Hills) -95 - 47 Studio / 1 Bed
Ascension Living Via Christi Village Manhattan
NH
AL
IL
Manhattan (Willow Grove Road) -129 - 10 Studio / 1 Bed / 2 Bed

Frequently Asked Questions about Wheatridge Park Care Center

Who is the owner of Wheatridge Park Care Center?

Wheatridge Park Care Center is legally operated by Liberal Snf Real Co Llc, and administered by Doug Wyckoff.

Is Wheatridge Park Care Center in a walkable area?

Wheatridge Park Care Center has a walk score of 81. Very walkable. Most errands can be accomplished on foot, and many essentials are within a short walk.

What is the license number of Wheatridge Park Care Center?

According to KS state health department records, Wheatridge Park Care Center's license number is 175459.

What is the occupancy rate at Wheatridge Park Care Center?

Wheatridge Park Care Center's occupancy is 89%.

Does Wheatridge Park Care Center operate as a for-profit or non-profit?

Wheatridge Park Care Center is registered as a for-profit in KS.

Who is the administrator of Wheatridge Park Care Center?

Doug Wyckoff is the administrator of Wheatridge Park Care Center.

How many beds does Wheatridge Park Care Center have?

Wheatridge Park Care Center has 45 beds.

Guides for Better Senior Living

Care Cost Calculator: See Prices in Your Area

Nursing Home Data Explorer

Don’t Wait Too Long: 7 Red Flag Signs Your Parent Needs Assisted Living Now

The True Cost of Assisted Living in 2025 – And How Families Are Paying For It

Understanding Senior Living Costs: Pricing Models, Discounts & Financial Assistance