


Total health inspections
6
State average N/A
Last Health inspection on Sep 2025
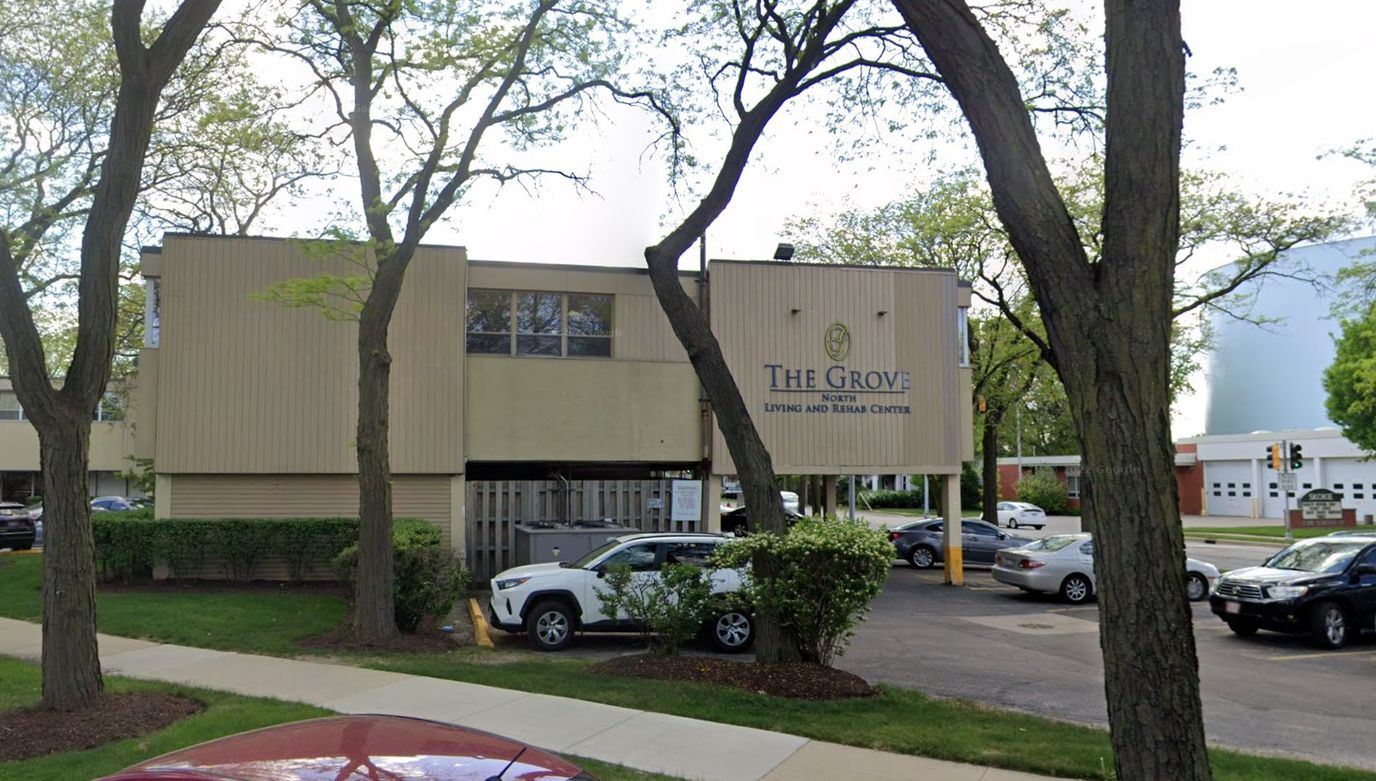


Indulge in a senior living experience like never before at The Grove in Skokie, where personalized attention and exceptional care are the norms. With a compassionate and skilled clinical team by your side, you can recover with ease and speed through advanced therapies and specialized treatments, including neuromuscular therapy and wound care. Moreover, pain management services and affiliations with top-notch hospitals ensure that you receive the best care and support available. They also cater to seniors who need orthopedic and neurological rehab, as well as behavioral health treatment.
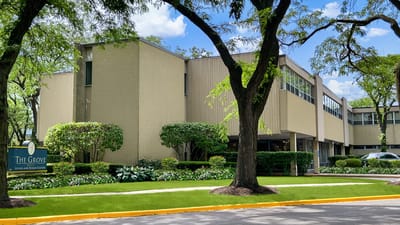
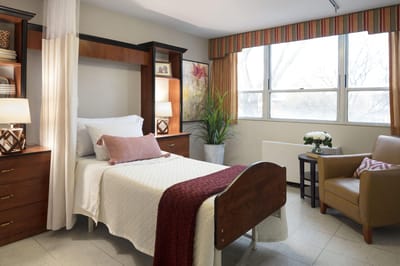
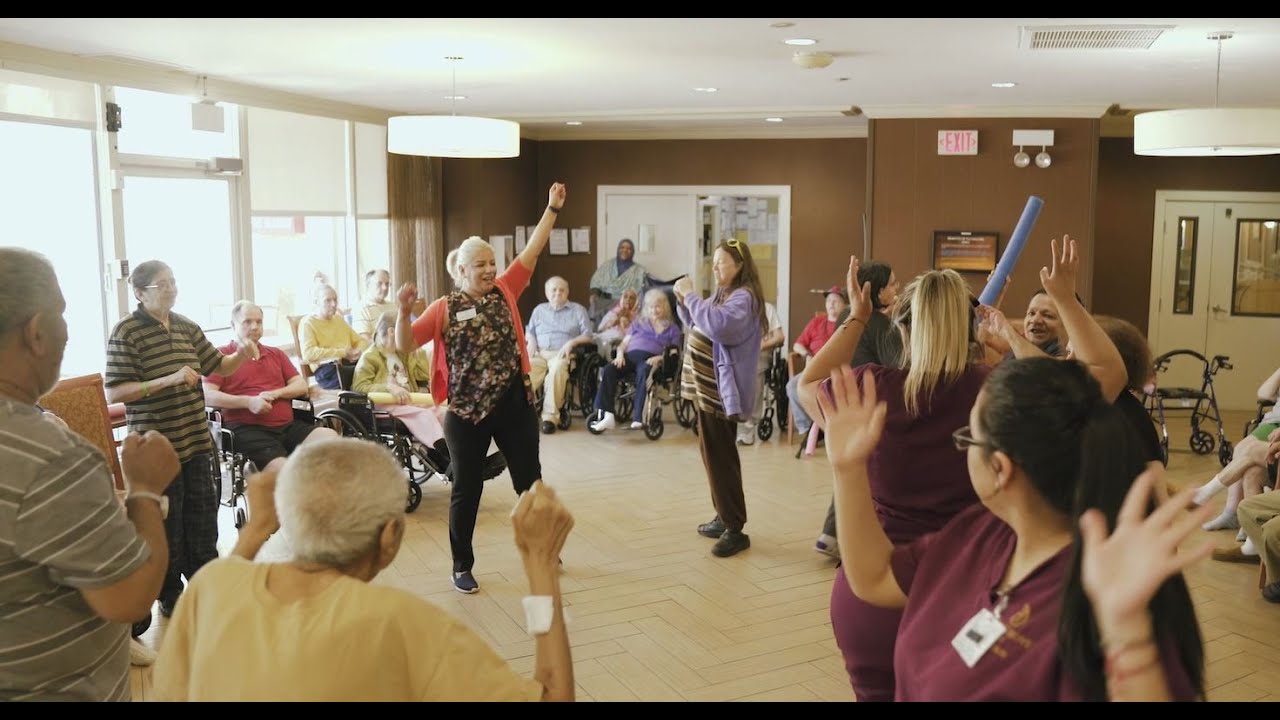
The home also serves Indian and Pakistani communities with staff who speak multiple languages. With a variety of vegetarian menu options and Indian cuisine, residents can indulge in flavors that feel like home. Along with excellent care, The Grove also provides luxurious amenities, including high-speed Wi-Fi, concierge services, and salon services. Each private and semi-private suite is immaculately designed with careful attention to detail, making it an oasis for relaxation. The outdoor spaces are also beautiful, allowing residents to soak up the sun and fresh air. At The Grove, senior living isn’t just about finding a place to reside, but it’s a complete and ultimate experience that sets the bar high for others to follow.
| Staff type | Hours / Day / Resident | vs state avg |
|---|---|---|
|
Registered Nurse (RN)
| 20m per day | ▼ 55% State avg: 44m per day · National avg: 41m per day |
|
LPN / LVN
| 43m per day | ▲ 13% State avg: 38m per day · National avg: 52m per day |
|
Nurse Aide
| 1h 22m per day | ▼ 36% State avg: 2h 8m per day · National avg: 2h 21m per day |
|
Weekend Total Nursing
| 2h 25m per day | ▼ 22% State avg: 3h 5m per day · National avg: 3h 26m per day |
|
Physical Therapist
| 2m per day | ▼ 46% State avg: 3m per day · National avg: 4m per day |
|
Weekend RN
| 21m per day | ▼ 39% State avg: 34m per day · National avg: 29m per day |
Key information about the people who lead and staff this community.
In Illinois, the Department of Public Health, Office of Health Care Regulation conducts annual unannounced surveys to assess compliance with state and federal healthcare facility standards.
Deficiencies
| This Facility | IL Average | vs. IL Avg |
|---|---|---|---|
|
Total deficiencies
| 12 | 7 | This facility has 71% more total deficiencies than a typical Illinois assisted living residence (12 vs. IL avg 7).↑ 71% worse |
|
Deficiencies per year
| 4 | 2.3 | This facility has 74% more deficiencies per year than a typical Illinois assisted living residence (4 vs. IL avg 2.3).↑ 74% worse |
State average N/A
Last Health inspection on Sep 2025
State average N/A
State average N/A
Health citations are formal notices following inspections when they fail to comply with safety and care standards.
8 of 11 citations resulted from standard inspections; and 3 of 11 resulted from complaint investigations.
State average: N/A
State average: N/A
Reporting period: October 1 – December 31, 2025 (Q4 2025). Source: CMS Payroll-Based Journal report.
State average ratio: 0 : 0
State average: 0 hours
Manages medical care and health needs.
Assists with medical care and medications.
Helps with daily care and mobility.
Total hours from contractors
1,468 contractor hours this quarter
| Certified Nursing Assistant | 38 | 0 | 38 | 16,857 | 92 | 100% | 7.8 |
| Licensed Practical Nurse | 17 | 0 | 17 | 8,379 | 92 | 100% | 8.9 |
| Clinical Nurse Specialist | 5 | 0 | 5 | 1,881 | 90 | 98% | 5.6 |
| Other Dietary Services Staff | 5 | 0 | 5 | 1,838 | 92 | 100% | 7.7 |
| Registered Nurse | 10 | 0 | 10 | 1,705 | 89 | 97% | 8.3 |
| Dental Services Staff | 2 | 0 | 2 | 967 | 90 | 98% | 5.6 |
| Mental Health Service Worker | 1 | 0 | 1 | 514 | 88 | 96% | 5.8 |
| Nurse Practitioner | 1 | 0 | 1 | 508 | 90 | 98% | 5.6 |
| RN Director of Nursing | 1 | 0 | 1 | 508 | 88 | 96% | 5.8 |
| Speech Language Pathologist | 0 | 1 | 1 | 496 | 62 | 67% | 8 |
| Dietitian | 1 | 0 | 1 | 452 | 79 | 86% | 5.7 |
| Administrator | 1 | 0 | 1 | 415 | 73 | 79% | 5.7 |
| Physical Therapy Aide | 0 | 3 | 3 | 389 | 66 | 72% | 5.9 |
| Respiratory Therapy Technician | 0 | 4 | 4 | 337 | 54 | 59% | 5.9 |
| Physical Therapy Assistant | 0 | 4 | 4 | 145 | 34 | 37% | 4.3 |
| Qualified Social Worker | 0 | 4 | 4 | 102 | 35 | 38% | 2.9 |
Federal penalties imposed by CMS for regulatory violations, including civil money penalties (fines) and denials of payment for new Medicare/Medicaid admissions.
Source: CMS Penalties Database
No penalties in the past 3 years
No civil money penalties or payment denials were reported in the last 3 years.
These measures show how residents usually do over time at this home, based on health outcomes and preventive care.
State average: 9.7
State average: 18.6
State average: 15.5%
State average: 18.4%
State average: 21.6%
State average: 3.4%
State average: 5.3%
State average: 1.8%
State average: 6.5%
State average: 48.1%
State average: 20.2%
State average: 89.2%
State average: 91.6%
State average: 2.05
State average: 2.25
State average: 68.3%
State average: 2.3%
State average: 63.0%
State average: 26.2%
State average: 14.0%
State average: 0.8%
State average: 53.7%
State average: 50.6%
Quality measures are calculated from Minimum Data Set (MDS) assessments. For most measures, lower percentages indicate better care quality.
12% of new residents, usually for short-term rehab.
72% of new residents, often for short stays.
16% of new residents, often for long-term daily care.
Source: CMS Long-Term Care Facility Characteristics (Data as of Jan 2026)
Residents meet regularly to discuss policies, care quality, and activities
Organized group of residents that meets regularly to discuss facility policies, quality of life, and activities.
Data sourced from CMS Long-Term Care Facility Characteristics quarterly report. Payer mix reflects the current resident census by primary payment source.
Historical financial and operational data for The Grove of Skokie from 2011–2023, based on CMS SNF Cost Reports.
Key figures below are for fiscal year ending in 12/2023.
Based on CMS SNF Cost Report for fiscal year ending in 12/2023.
Most residents stay long-term, while a smaller portion are admitted for short-term rehab.
Most new residents arrive under private pay (72% of admissions), and a typical private pay stay runs around 6 - 7 months.
Coverage residents most often arrive under.
Coverage residents most often leave under.
![]() 4.0 miles from city center
4.0 miles from city center
![]() Estimated distance in miles from Skokie's city center to The Grove of Skokie's address, calculated via Google Maps.
— 3.23 miles to nearest hospital (Resurrection Medical Center - Emergency Fast Track)
Estimated distance in miles from Skokie's city center to The Grove of Skokie's address, calculated via Google Maps.
— 3.23 miles to nearest hospital (Resurrection Medical Center - Emergency Fast Track)
Add your location
The information below is reported by the Illinois Department of Public Health, Office of Health Care Regulation.
| Westminster Place | NH AL IL MC RC SNF | Evanston (Grant Street) | - | 105 | - | 44 | Studio / 1 Bed / 2 Bed |
| Tabor Hills | NH AL IL RC SNF | Naperville (Naperville Park District) | - | 96 | A+ | 21 | Studio / 1 Bed / 2 Bed |
| The Mather | NH AL IL MC SNF | Evanston (Davis Street) | - | 22 | - | 95 | 1 Bed / 2 Bed |
| The Springs at Monarch Landing | NH MC RC SNF | Naperville (Naperville Park District) | - | 28 | - | 27 | Private Rooms / Semi-Private Rooms |
| The Grove of Skokie | NH SNF | Skokie (Forest Glen) | - | 149 | A+ | 75 | - |
The Grove of Skokie is in the Forest Glen neighborhood of Skokie.
The Grove of Skokie has a walk score of 75. Very walkable. Most errands can be accomplished on foot, and many essentials are within a short walk.
The Grove of Skokie's occupancy is 89.4%.
No, The Grove of Skokie has a no-pet policy.
The Grove of Skokie is registered as a for-profit in IL.
Yes — there are 32 photos of The Grove of Skokie in the photo gallery on this page.
The Grove of Skokie is located at 9000 N. Lavergne Avenue, Skokie, IL 60077.
Care Cost Calculator: See Prices in Your Area
Nursing Home Data Explorer
Don’t Wait Too Long: 7 Red Flag Signs Your Parent Needs Assisted Living Now
The True Cost of Assisted Living in 2025 – And How Families Are Paying For It
Understanding Senior Living Costs: Pricing Models, Discounts & Financial Assistance


