Kindred Hospital Greensboro
CMS overall rating Info CMS (the Centers for Medicare & Medicaid Services) is the federal agency that rates nursing home quality. Its Overall Rating runs from 1 to 5 stars, combining health inspections, staffing, and quality measures, with inspections weighted most heavily.

Kindred Hospital Greensboro

CMS overall rating Info CMS (the Centers for Medicare & Medicaid Services) is the federal agency that rates nursing home quality. Its Overall Rating runs from 1 to 5 stars, combining health inspections, staffing, and quality measures, with inspections weighted most heavily.

Overview of Kindred Hospital Greensboro

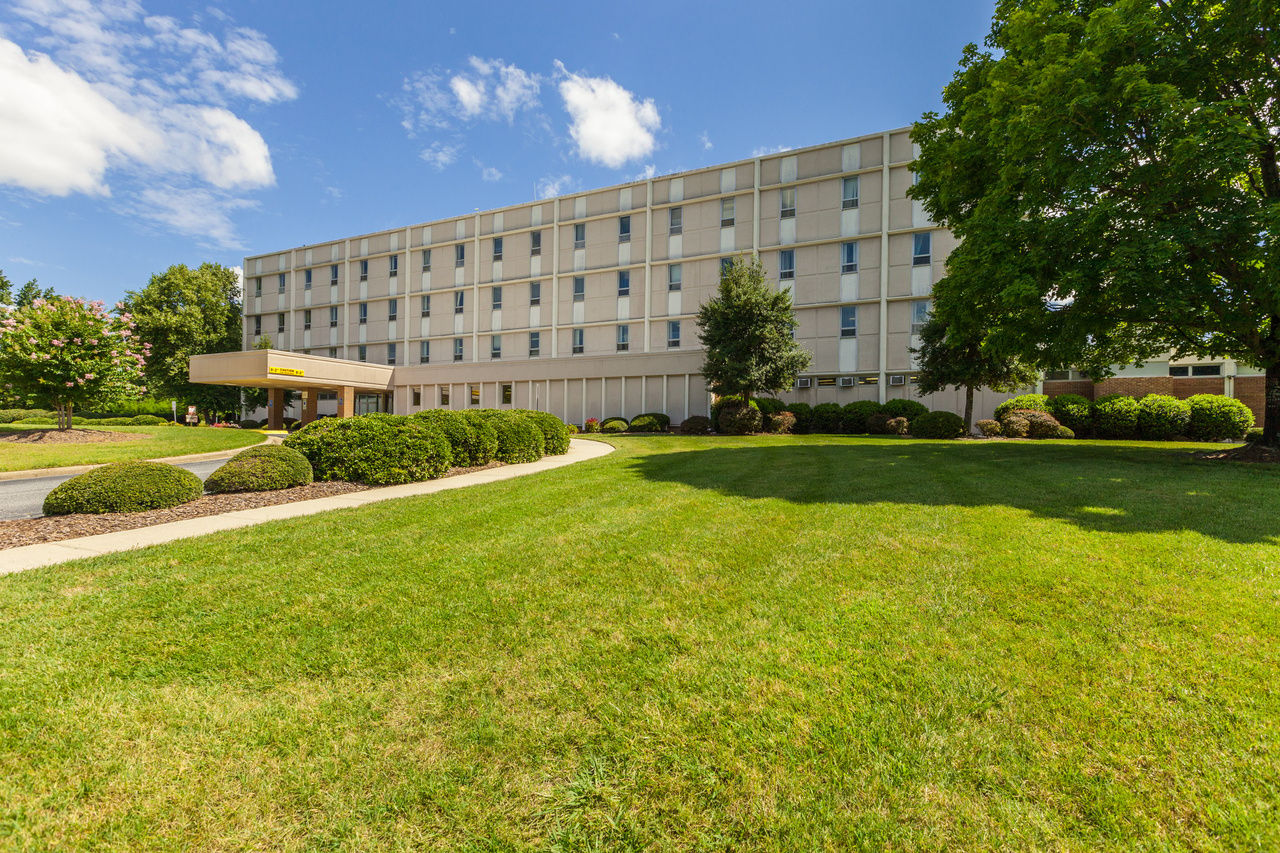
Kindred Hospital Greensboro is a top-notch long-term acute care hospital located in the heart of Greensboro, North Carolina. With 101 beds and cutting-edge medical technology, this facility is equipped to handle even the most complex medical needs. The physician-led team of skilled professionals is dedicated to helping patients recover from various conditions, including organ transplant care, intensive care, IV drug and nutrition therapy, cardiac care and recovery, traumatic brain injury, stroke care, and more.
The facility values family involvement and strives to maintain open lines of communication with patients and their loved ones. Upon admission, each patient or family is assigned a case manager to ensure that all their needs and concerns are addressed promptly and effectively. In addition to providing exceptional medical care, Kindred Hospital Greensboro also takes care of the everyday needs of its patients and their families. The facility’s cafeteria is equipped with microwaves and vending machines, and free coffee and tea are available. They also provide ample parking and 24/7 security staff to ensure a safe and secure environment.

(336) 604-2300

Quality ratings

Measured by Centers for Medicare & Medicaid Services (CMS)

Overall rating Info The Overall CMS Rating combines results from health inspections, staffing levels and quality measures. Health inspections carry the most weight. Staffing and quality scores can increase or decrease the final rating based on performance compared to state and national standards.
▲ 7.3% Above NC avg. ▲ 7.3% Above NC avg.NC average: 2.8Click the badge to see the full State ranking.Click here to see the full State ranking.
Health Inspection Info Based on the results of the facility's three most recent standard inspections and any complaint investigations. CMS reviews the number, scope, and severity of deficiencies, with more recent findings weighted more heavily.
▲ 6.2% Above NC avg. ▲ 6.2% Above NC avg.NC average: 2.8Click the badge to see the full State ranking.Click here to see the full State ranking.
Staffing Info Measures average nursing staff hours per resident per day, including Registered Nurses (RNs) and total nursing staff. Ratings are adjusted based on the level of care residents require and are compared to state and national benchmarks.
▼ 24.8% Below NC avg. ▼ 24.8% Below NC avg.NC average: 2.7Click the badge to see the full State ranking.Click here to see the full State ranking.
Quality Measures Info Based on clinical and physical health indicators reported to CMS, such as hospital readmissions, falls, pressure ulcers, and improvements in mobility. These measures reflect how well residents' health needs are being managed.
▼ 5.5% Below NC avg. ▼ 5.5% Below NC avg.NC average: 3.2Click the badge to see the full State ranking.Click here to see the full State ranking.

Staffing hours breakdown

Info Daily nursing hours per resident by staff type, reported to CMS. Higher is generally better — compare this facility to state and national averages to see where staffing stands.

Hours per resident per day — compared to North Carolina state averages

Total nursing care / resident Info This home is ranked 95th out of 97 homes in North Carolina for nurse hours. Total adjusted nursing hours per resident per day, combining RN, LPN, and aide time. CMS adjusts this for case-mix so facilities can be fairly compared.
2h 51m per day
Rank #95 / 97Nurse hours — State benchmarkedThis home is ranked 95th out of 97 homes in North Carolina. Shows adjusted nurse hours per resident per day benchmarked to the North Carolina average, with a ranking across 97 North Carolina facilities. More hours mean more direct care. The national average is about 3.5 hrs; below 3.0 is a red flag.Ranking totals vary by category as each rank only includes facilities that report data for that metric. Homes missing that data point aren't included in the ranking.Click the rank badge to see the full State ranking.Click here to see the full State ranking.
This facility North Carolina avg (3h 59m per day)
vs North Carolina avg
-28%

0 of 6 metrics below state avg

Standout metric LPN / LVN is +146% above state avg
Staff typeHours / Day / Residentvs state avg
Registered Nurse (RN) Info RNs hold the highest nursing license and can assess residents, interpret test results, and direct care plans. More RN hours per day often signals stronger clinical oversight and faster response to health changes. 1h 14m per day ▲ 102% State avg: 37m per day · National avg: 41m per day
LPN / LVN Info Licensed Practical Nurses (LPNs) or Licensed Vocational Nurses (LVNs) deliver routine hands-on care — medication administration, wound dressing, and monitoring vital signs. They work under RN supervision and make up a large share of daily bedside care. 2h 12m per day ▲ 146% State avg: 53m per day · National avg: 52m per day
Nurse Aide Info Certified Nurse Aides (CNAs) provide the most direct day-to-day assistance: bathing, dressing, feeding, and mobility. Nurse aide hours are typically the largest staffing category and directly affect residents' quality of life. 3h 14m per day ▲ 39% State avg: 2h 19m per day · National avg: 2h 20m per day
Weekend Total Nursing Info Combined nursing hours (RN + LPN + Nurse Aide) per resident per day on weekends. Staffing often drops on weekends — this figure reveals whether the facility maintains adequate coverage outside of weekday hours. 6h 0m per day ▲ 75% State avg: 3h 26m per day · National avg: 3h 27m per day
Physical Therapist Info Hours per resident per day provided by licensed Physical Therapists (PTs) or PT Assistants. PT services help residents recover mobility after injury or illness and are especially important for post-acute (short-stay) rehabilitation. 9m per day ▲ 73% State avg: 5m per day · National avg: 4m per day
Weekend RN Info Registered nurse hours specifically on weekends. Facilities sometimes reduce RN presence on Saturdays and Sundays — a low weekend RN figure compared to weekday hours can indicate reduced clinical oversight when most administrative staff are absent. 40m per day ▲ 68% State avg: 24m per day · National avg: 29m per day
Bed community size
23-bed community Rank #333 / 390Bed count — State benchmarkedThis home is ranked 333rd out of 390 homes in North Carolina. Shows this facility's certified or reported bed count compared to other North Carolina facilities. Larger communities may offer more amenities, programs, and on-site services for residents and families.Ranking totals vary by category as each rank only includes facilities that report data for that metric. Homes missing that data point aren't included in the ranking.Click the rank badge to see the full State ranking.Click here to see the full State ranking.
A smaller, more intimate setting that may offer a quieter environment and closer staff-resident interactions.
Walk Score
Walk Score: 23 / 100 Rank #358 / 572Walk Score — State benchmarkedThis home is ranked 358th out of 572 homes in North Carolina. Shows how walkable this facility's neighborhood is compared to the average Walk Score across North Carolina facilities. Higher scores benefit residents, families, and staff.Ranking totals vary by category as each rank only includes facilities that report data for that metric. Homes missing that data point aren't included in the ranking.Click the rank badge to see the full State ranking.Click here to see the full State ranking.
Car-dependent. Most errands require a car, with limited nearby walkable options.

About this community

License Details

CertificationsJoint Commission Certifications in Respiratory Failure, Sepsis
AccreditationsJoint Commission

Therapy & Rehabilitation

2 services
Rehabilitation Services
Short-Term Rehab

Staffing & Medical

2 services
Doctor on Staff
24-Hour Staffing

Additional Policies & Features

Visitor PolicyVisitors are welcome between 8 a.m. and 8 p.m. daily. Children allowed but age restrictions may apply.
Admission CriteriaTreated without regard to race, color, creed, age, handicap, national origin or payment classification.

Amenities & Lifestyle

101-Bed Hospital
Intensive Care Unit
Subacute Unit
Cafeteria
Wellness ProgramSubacute care is designed to provide short-term rehabilitation to help recover from an injury or illness, or to provide compassionate care for multiple medical problems.
Specific ProgramsPatients & Families, Patient Care, Why Kindred?, Patient Success Stories, Frequent Questions, Healthcare Professionals, Why Refer to Kindred?, Research & Insights, Refer a Patient, Respiratory Care, Wound Care, Infectious Disease Care, Medically Complex Care, Intensive Care, Brain Injury & Stroke Care, Cardiac Care, Kidney Care
Operating Hours24/7

Dining & Nutrition

Meal ScheduleBreakfast: 7-9am; Lunch: 11:30-1:30pm; Dinner: Not specified

Contact Kindred Hospital Greensboro

Staffing Data

Reporting period: October 1 – December 31, 2025 (Q4 2025). Source: CMS Payroll-Based Journal report.

Total staff 68
Employees 57
Contractors 11
Staff to resident ratio 3.24 : 1
80% more staff per resident than North Carolina average
North Carolina average ratio: 1.80 : 1 North Carolina average ratio: 1.80 : 1See full North Carolina ranking
Avg staff/day 25
Average shift 8.6 hours
8% better than North Carolina average
North Carolina average: 8 hours North Carolina average shift: 8 hoursSee full North Carolina ranking
Total staff hours (quarter) 19,692

Nursing staff breakdown

Q4 2025 · Oct 1 – Dec 31 More info This data comes from the CMS Payroll-Based Journal report covering October 1 – December 31, 2025.
Registered Nurse

Manages medical care and health needs.

RN Staff Info All 4 RN Staff are full-time employees. No contractors work on this role. 4
Average shift length Info Average shift length. Calculated as total hours divided by days worked and average staff per day. 8.2 hours
Licensed Practical Nurse

Assists with medical care and medications.

LPN Staff Info All 10 LPN Staff are full-time employees. No contractors work on this role. 10
Average shift length Info Average shift length. Calculated as total hours divided by days worked and average staff per day. 9.7 hours
Certified Nursing Assistant

Helps with daily care and mobility.

CNA Staff Info All 13 CNA Staff are full-time employees. No contractors work on this role. 13
Average shift length Info Average shift length. Calculated as total hours divided by days worked and average staff per day. 9.9 hours

Contractor staffing

Q4 2025 · Oct 1 – Dec 31 More info This data comes from the CMS Payroll-Based Journal report covering October 1 – December 31, 2025.

Total hours from contractors

6.9%

1,353 contractor hours this quarter

Qualified Social Worker: 3 Respiratory Therapy Technician: 2 Physical Therapy Assistant: 2 Physical Therapy Aide: 2 Other Physician: 1 Occupational Therapy Assistant: 1

Staff by category

Q4 2025 · Oct 1 – Dec 31 More info This data comes from the CMS Payroll-Based Journal report covering October 1 – December 31, 2025.
Certified Nursing Assistant130136,01292100%9.9
Qualified Activities Professional220224,29592100%9.3
Licensed Practical Nurse100104,08692100%9.7
Registered Nurse4041,1258289%8.2
Clinical Nurse Specialist2026506672%6.7
Dietitian1015355964%9.1
Administrator1015286672%8
Nurse Practitioner1015286672%8
Physical Therapy Aide0224636571%6.8
Qualified Social Worker0334586571%7
Mental Health Service Worker2024276267%6.6
Respiratory Therapy Technician0222846368%4.2
Occupational Therapy Aide1011533942%3.9
Physical Therapy Assistant0221145661%2
Other Physician011241112%2.2
Occupational Therapy Assistant011102224%0.5
13 Certified Nursing Assistant
% of Days 100%
22 Qualified Activities Professional
% of Days 100%
10 Licensed Practical Nurse
% of Days 100%
4 Registered Nurse
% of Days 89%
2 Clinical Nurse Specialist
% of Days 72%
1 Dietitian
% of Days 64%
1 Administrator
% of Days 72%
1 Nurse Practitioner
% of Days 72%
2 Physical Therapy Aide
% of Days 71%
3 Qualified Social Worker
% of Days 71%
2 Mental Health Service Worker
% of Days 67%
2 Respiratory Therapy Technician
% of Days 68%
1 Occupational Therapy Aide
% of Days 42%
2 Physical Therapy Assistant
% of Days 61%
1 Other Physician
% of Days 12%
1 Occupational Therapy Assistant
% of Days 24%

Penalties and fines

Federal penalties imposed by CMS for regulatory violations, including civil money penalties (fines) and denials of payment for new Medicare/Medicaid admissions.

Source: CMS Penalties Database

No penalties in the past 3 years

No civil money penalties or payment denials were reported in the last 3 years.

Quality of care over time

These measures show how residents usually do over time at this home, based on health outcomes and preventive care.

High-risk clinical events score Info A composite score based on pressure ulcers, falls with injury, weight loss, walking ability decline, and activities of daily living decline. 16.9
47% worse than North Carolina average

North Carolina average: 11.5

Functional decline score Info A composite score based on activities of daily living decline, walking ability decline, and incontinence. 17.9
13% better than North Carolina average

North Carolina average: 20.6

Long-stay resident measures
Need for Help with Daily Activities Increased Info Percent of long-stay residents whose need for help with daily activities has increased 33.3%
90% worse than North Carolina average

North Carolina average: 17.5%

Low Risk Residents with Bowel/Bladder Incontinence Info Percent of low risk long-stay residents who lose control of their bowels or bladder 2.5%
88% better than North Carolina average

North Carolina average: 21.4%

Falls with Major Injury Info Percent of long-stay residents experiencing one or more falls with major injury 0.0%
100% better than North Carolina average

North Carolina average: 3.6%

High Risk Residents with Pressure Ulcers Info Percent of long-stay high risk residents with pressure ulcers 20.3%
223% worse than North Carolina average

North Carolina average: 6.3%

Urinary Tract Infection Info Percent of long-stay residents with a urinary tract infection 1.4%
47% better than North Carolina average

North Carolina average: 2.6%

Lost Too Much Weight Info Percent of long-stay residents who lose too much weight 13.9%
89% worse than North Carolina average

North Carolina average: 7.4%

Depressive Symptoms Info Percent of long-stay residents who have depressive symptoms 0.0%
100% better than North Carolina average

North Carolina average: 4.4%

Antipsychotic Use Info Percent of long-stay residents who received an antipsychotic medication 20.3%
51% worse than North Carolina average

North Carolina average: 13.4%

Pneumococcal Vaccine Info Percent of long-stay residents assessed and appropriately given the pneumococcal vaccine 100.0%
9% better than North Carolina average

North Carolina average: 91.6%

Influenza Vaccine Info Percent of long-stay residents assessed and appropriately given the seasonal influenza vaccine 96.0%
In line with North Carolina average

North Carolina average: 94.1%

Short-stay resident measures
Pneumococcal Vaccine Info Percent of short-stay residents assessed and appropriately given the pneumococcal vaccine 97.2%
22% better than North Carolina average

North Carolina average: 79.9%

Antipsychotic medication increase Info Percent of short-stay residents who newly received an antipsychotic medication 2.9%
92% worse than North Carolina average

North Carolina average: 1.5%

Facility Characteristics

Source: CMS Long-Term Care Facility Characteristics (Data as of Jan 2026)

Total residents 21
Medicare
5
23.8% of residents
Medicaid
13
61.9% of residents
Private pay or other
3
14.3% of residents
Programs & Services
Residents Group

Residents meet regularly to discuss policies, care quality, and activities

Active Resident Council

Organized group of residents that meets regularly to discuss facility policies, quality of life, and activities.

Compare Nursing Home around Greensboro

The information below is reported by the North Carolina Department of Health and Human Services, Division of Health Service Regulation.

4 facilities compared · CMS & NC Dept. of Health data

Maryfield Nursing Home
NH
MC
NC
PC
Greensboro
115
Facility 115
NC AVG 72
Rank #55 / 390
85.7%
Facility 85.7%
NC AVG 76.4%
Rank #75 / 271
+12%
4.21
Facility 4.21
NC AVG 3.98
Rank #35 / 97
+3%+6%
$0
Facility $0
NC AVG $74.6k
Rank #1 / 105
1
Facility 1
NC AVG 20.9
Rank #1 / 101
1.0
Facility 1.0
NC AVG 5.0
Rank #1 / 101
-103-
31
Facility 31
NC AVG 33
Rank #294 / 572
Maryfield, Inc.
$31.4M
Facility $31.4M
NC AVG $13.2M
Rank #11 / 104
$16.3M
Facility $16.3M
NC AVG $4.9M
Rank #12 / 104
52%
Facility 52%
NC AVG 39.8%
Rank #69 / 104
345093
Maple Grove Health & Rehabilitation Center
NH
MC
Greensboro
210
Facility 210
NC AVG 72
Rank #2 / 390
41.6%
Facility 41.6%
NC AVG 76.4%
Rank #221 / 271
-46%
3.81
Facility 3.81
NC AVG 3.98
Rank #58 / 97
-7%-4%
$50.3k
Facility $50.3k
NC AVG $74.6k
Rank #81 / 105
24
Facility 24
NC AVG 20.9
Rank #75 / 101
6.0
Facility 6.0
NC AVG 5.0
Rank #80 / 101
3107-
51
Facility 51
NC AVG 33
Rank #137 / 572
-
$11.6M
Facility $11.6M
NC AVG $13.2M
Rank #76 / 104
$5.0M
Facility $5.0M
NC AVG $4.9M
Rank #38 / 104
42.8%
Facility 42.8%
NC AVG 39.8%
Rank #5 / 104
345448
Heartland Living and Rehabilitation
NH
NC
RC
Greensboro
107
Facility 107
NC AVG 72
Rank #67 / 390
67.3%
Facility 67.3%
NC AVG 76.4%
Rank #162 / 271
-12%
4.05
Facility 4.05
NC AVG 3.98
Rank #43 / 97
-80%+2%
$0
Facility $0
NC AVG $74.6k
Rank #1 / 105
12
Facility 12
NC AVG 20.9
Rank #45 / 101
4.0
Facility 4.0
NC AVG 5.0
Rank #49 / 101
-92-
39
Facility 39
NC AVG 33
Rank #231 / 572
Horace Wilson
$11.8M
Facility $11.8M
NC AVG $13.2M
Rank #58 / 104
$4.8M
Facility $4.8M
NC AVG $4.9M
Rank #54 / 104
40.2%
Facility 40.2%
NC AVG 39.8%
Rank #29 / 104
345391
Kindred Hospital Greensboro
NH
Greensboro
23
Facility 23
NC AVG 72
Rank #333 / 390
--
2.85
Facility 2.85
NC AVG 3.98
Rank #95 / 97
-36%-28%
$0
Facility $0
NC AVG $74.6k
Rank #1 / 105
7
Facility 7
NC AVG 20.9
Rank #27 / 101
7.0
Facility 7.0
NC AVG 5.0
Rank #89 / 101
-20-
23
Facility 23
NC AVG 33
Rank #358 / 572
----345273

Financial Assistance for
Nursing Home in North Carolina

Kindred Hospital Greensboro is located in Greensboro, North Carolina.
Here are the financial assistance programs available to residents in North Carolina.

Get Financial aid guidance

Community Alternatives Program for Disabled Adults

NC Medicaid CAP/DA

Age 65+ or disabled
General North Carolina resident, Medicaid- eligible, nursing home-level care need.
Income Limits (2025) ~$2,829/month 300% FBR, individual
Asset Limits $2,000 (individual), $3,000 (couple).
NC

High demand; waitlists common in urban areas.

Benefits
Personal care (5-7 hours/day) Respite (240 hours/year) Adult day care ($60/day) Home modifications ($1,500 avg.)

North Carolina Senior Care Options

NC SCO (via NFCSP)

Age Caregiver of someone 60+ (or with dementia)
General North Carolina resident.
Income Limits No strict limit; prioritizes low-income.
Asset Limits Not applicable.
NC

Limited slots; rural/urban balance.

Benefits
In-home respite (4-6 hours/day) Adult day care (~$60/day) Short-term facility care (up to 5 days)

Program of All-Inclusive Care for the Elderly (PACE)

North Carolina PACE (e.g., PACE of the Triad)

Age 55+
General NC resident (specific counties), NFLOC, safe with PACE support.
Income Limits (2025) ~$2,829/month (Medicaid-eligible); private pay option available.
Asset Limits $2,000 (individual), $3,000 (couple) for Medicaid enrollees.
NC

Available in 10+ counties (e.g., Guilford, Wake); multiple providers (e.g., PACE of the Southern Piedmont).

Benefits
Personal care (5-7 hours/day) Medical care Meals Transportation Respite Therapies

In-Home Aide Services

North Carolina In-Home Aide Services

Age 60+
General NC resident, unable to perform 1+ ADL, at risk of nursing home placement.
Income Limits (2025) No strict cap; prioritizes low-income ~$24,980/year
Asset Limits Not assessed; need-based.
NC

Family can be aides; varies by county funding.

Benefits
Personal care (5-20 hours/week) Meal prep Respite (~5 days/year) Errands

Medicare Savings Program (MSP)

North Carolina Medicare Savings Program

Age 65+ or disabled
General NC resident, Medicare Part A/B.
Income Limits (2025) ~$2,510/month (QMB), ~$3,380/month (SLMB), ~$3,598/month (QI)—individual.
Asset Limits $9,430 (individual), $14,130 (couple).
NC

Three tiers; no waitlist; includes Extra Help for Part D.

Benefits
Covers Part B premiums ($174.70/month) Deductibles ($240/year) Copays (~20%)

VA Aid and Attendance (A&A) and Housebound Benefits

North Carolina VA Aid and Attendance/Housebound

Age 65+ or disabled veteran/spouse
General NC resident, wartime service, need for ADL help (A&A) or homebound.
Income Limits (2025) Net income < ~$1,984/month (veteran with dependent, A&A); pension offsets income.
Asset Limits ~$155,356 net worth limit
NC

High veteran demand in rural/urban areas.

Benefits
Cash (~$1,433-$2,642/month veteran, ~$951-$1,318 spouse) for care costs (e.g., in-home, assisted living)

Urgent Repair Program (URP)

North Carolina Urgent Repair Program

Age 60+ prioritized
General NC resident, homeowner, low-income.
Income Limits (2025) ~$30,258/year 50% AMI, varies by county
Asset Limits Not strictly assessed; home value considered.
NC

Forgivable at $2,000/year; statewide via local partners.

Benefits
Repairs (~$8,000-$12,000 avg.) for safety (e.g., roofs, heating, accessibility)

State/County Special Assistance (SA)

North Carolina Special Assistance

Age 65+ (or disabled)
General NC resident, in licensed adult care home, low-income.
Income Limits (2025) ~$1,255/month (individual, 100% FPL); varies by facility rate.
Asset Limits $2,000 individual
NC

Covers assisted living; counties supplement state funds.

Benefits
Cash (~$1,200-$1,500/month) for room/board; Medicaid covers care services

Frequently Asked Questions about Kindred Hospital Greensboro

Is Kindred Hospital Greensboro in a walkable area?

Kindred Hospital Greensboro has a walk score of 23. Car-dependent. Most errands require a car, with limited nearby walkable options.

Are there photos of Kindred Hospital Greensboro?

Yes — there are 2 photos of Kindred Hospital Greensboro in the photo gallery on this page.

What is the phone number of Kindred Hospital Greensboro?

(336) 604-2300 will put you in contact with the team at Kindred Hospital Greensboro.

Is Kindred Hospital Greensboro Medicare or Medicaid certified?

Yes — Kindred Hospital Greensboro is a CMS-certified provider of Medicare and Medicaid.

Guides for Better Senior Living

Care Cost Calculator: See Prices in Your Area

Nursing Home Data Explorer

Don’t Wait Too Long: 7 Red Flag Signs Your Parent Needs Assisted Living Now

The True Cost of Assisted Living in 2025 – And How Families Are Paying For It

Understanding Senior Living Costs: Pricing Models, Discounts & Financial Assistance