Maryfield Nursing Home
Nursing Home, Memory Care, Nursing Care & Palliative Care · Greensboro, NC
CMS overall rating Info CMS (the Centers for Medicare & Medicaid Services) is the federal agency that rates nursing home quality. Its Overall Rating runs from 1 to 5 stars, combining health inspections, staffing, and quality measures, with inspections weighted most heavily.

Maryfield Nursing Home

Nursing Home, Memory Care, Nursing Care & Palliative Care · Greensboro, NC
CMS overall rating Info CMS (the Centers for Medicare & Medicaid Services) is the federal agency that rates nursing home quality. Its Overall Rating runs from 1 to 5 stars, combining health inspections, staffing, and quality measures, with inspections weighted most heavily.
Calculator: See prices in your area
Maryfield Nursing Home accepts Medicare, Medicaid, and private pay.

Overview of Maryfield Nursing Home

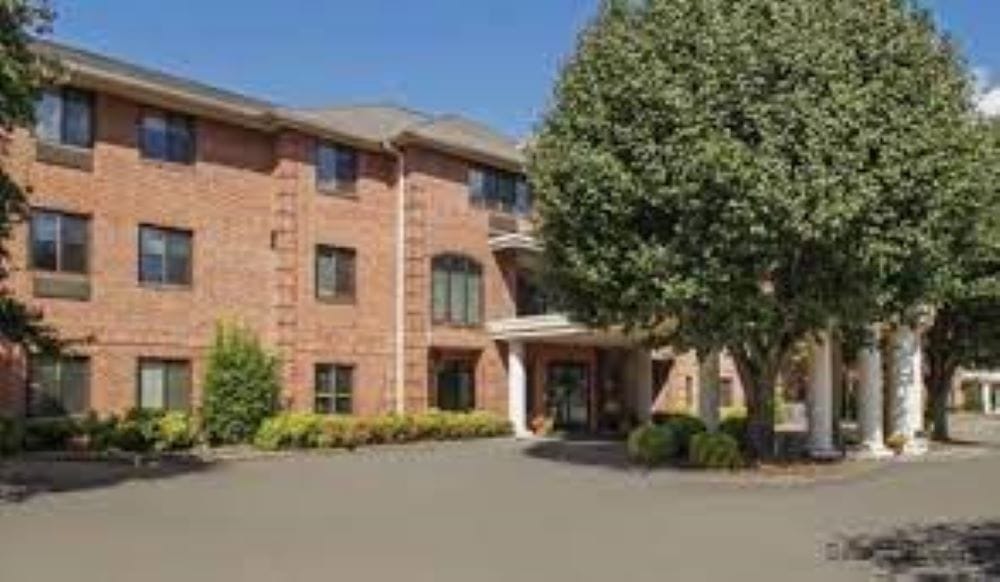
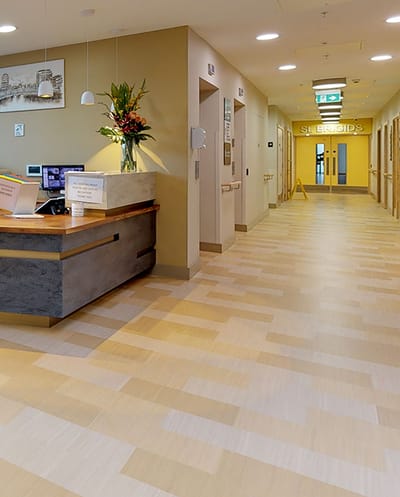
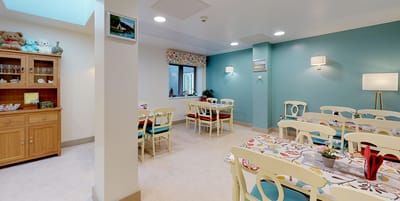
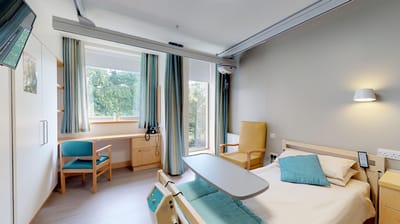
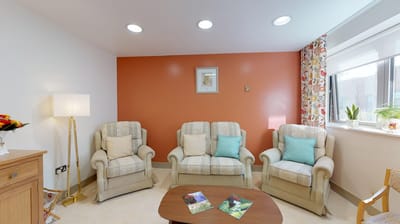
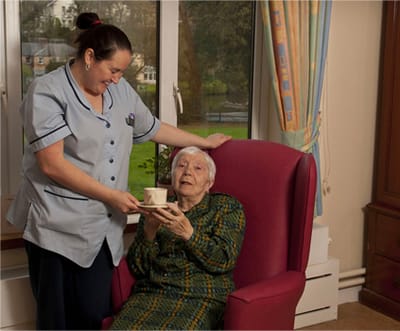
Maryfield Nursing Home is a welcoming community located in High Point, North Carolina. This non-profit facility offers 115 beds and participates in Medicare and Medicaid to provide the best care possible. The community is located near High Point, Lincoln Park, West Fork, and Deep River, which offers tranquility and plenty of opportunities for outdoor recreation activities. They offer both short and long-term care, ensuring that residents have access to the care they need, when they need it. The facility also has a 24-hour emergency call response system in place to ensure the safety and well-being of all residents. 
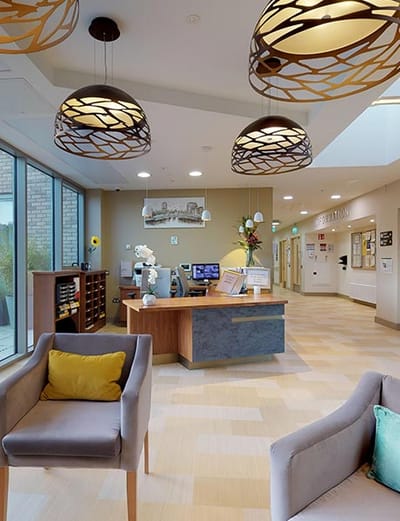
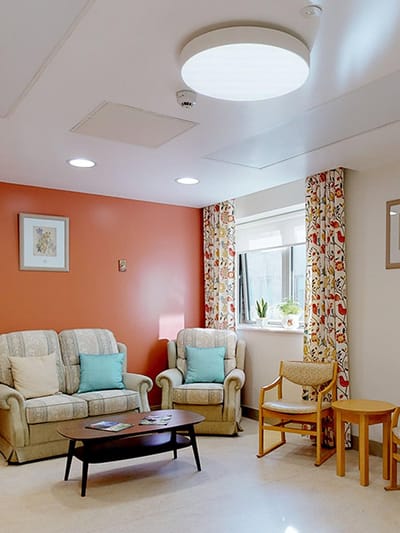
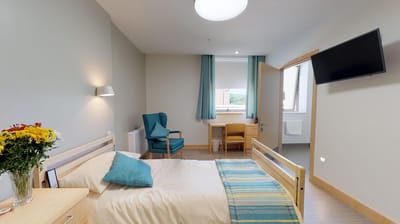
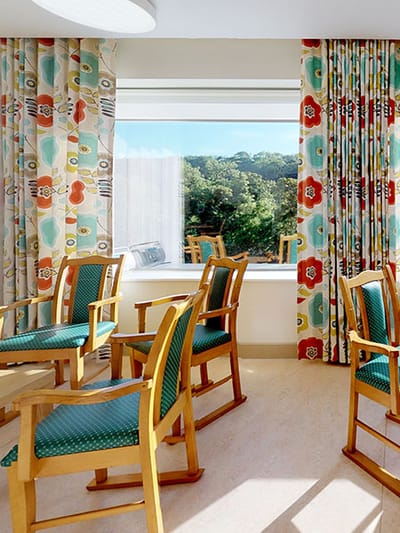
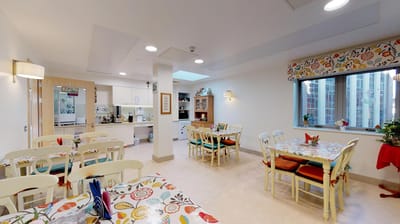
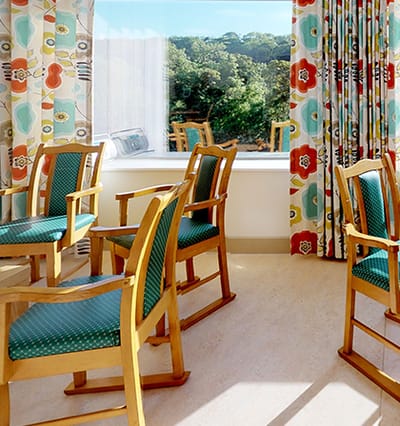
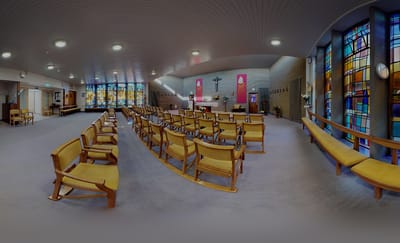
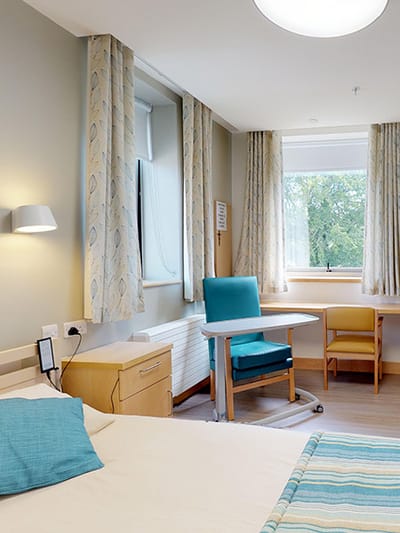
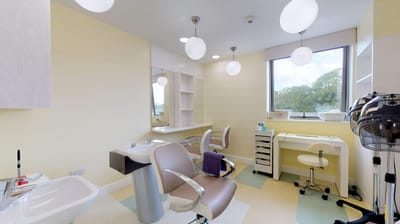
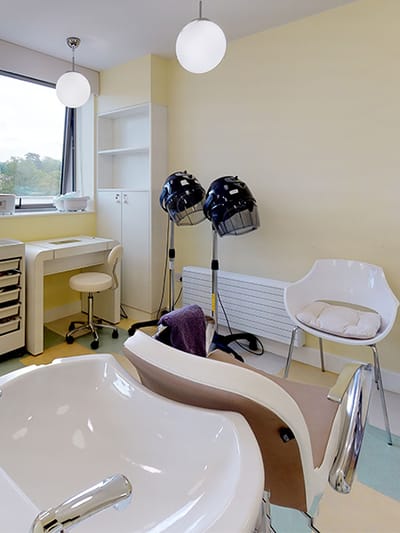
On-site therapy and physicians help to monitor and manage medications, while also providing assistance with daily living activities. Delicious, dietician-approved, chef-prepared meals are available, ensuring that residents are well-fed and satisfied. Residents can enjoy a variety of amenities, including a library, a comfortable lounge, a beauty and barber salon, and fitness classes led by trained exercise specialists. They can choose between one or two bedroom units, complete with private bathrooms, and they do not have to worry about the hassle of home maintenance.

Quality ratings

Measured by Centers for Medicare & Medicaid Services (CMS)

Overall rating Info The Overall CMS Rating combines results from health inspections, staffing levels and quality measures. Health inspections carry the most weight. Staffing and quality scores can increase or decrease the final rating based on performance compared to state and national standards.
▲ 78.8% Above NC avg. ▲ 78.8% Above NC avg.NC average: 2.8Click the badge to see the full State ranking.Click here to see the full State ranking.
Health Inspection Info Based on the results of the facility's three most recent standard inspections and any complaint investigations. CMS reviews the number, scope, and severity of deficiencies, with more recent findings weighted more heavily.
▲ 77.0% Above NC avg. ▲ 77.0% Above NC avg.NC average: 2.8Click the badge to see the full State ranking.Click here to see the full State ranking.
Staffing Info Measures average nursing staff hours per resident per day, including Registered Nurses (RNs) and total nursing staff. Ratings are adjusted based on the level of care residents require and are compared to state and national benchmarks.
▲ 50.4% Above NC avg. ▲ 50.4% Above NC avg.NC average: 2.7Click the badge to see the full State ranking.Click here to see the full State ranking.
Quality Measures Info Based on clinical and physical health indicators reported to CMS, such as hospital readmissions, falls, pressure ulcers, and improvements in mobility. These measures reflect how well residents' health needs are being managed.
▲ 26.0% Above NC avg. ▲ 26.0% Above NC avg.NC average: 3.2Click the badge to see the full State ranking.Click here to see the full State ranking.

Staffing hours breakdown

Info Daily nursing hours per resident by staff type, reported to CMS. Higher is generally better — compare this facility to state and national averages to see where staffing stands.

Hours per resident per day — compared to North Carolina state averages

Total nursing care / resident Info This home is ranked 35th out of 97 homes in North Carolina for nurse hours. Total adjusted nursing hours per resident per day, combining RN, LPN, and aide time. CMS adjusts this for case-mix so facilities can be fairly compared.
4h 12m per day
Rank #35 / 97Nurse hours — State benchmarkedThis home is ranked 35th out of 97 homes in North Carolina. Shows adjusted nurse hours per resident per day benchmarked to the North Carolina average, with a ranking across 97 North Carolina facilities. More hours mean more direct care. The national average is about 3.5 hrs; below 3.0 is a red flag.Ranking totals vary by category as each rank only includes facilities that report data for that metric. Homes missing that data point aren't included in the ranking.Click the rank badge to see the full State ranking.Click here to see the full State ranking.
This facility North Carolina avg (3h 59m per day)
vs North Carolina avg
+6%

4 of 6 metrics below state avg

Standout metric Nurse Aide is +17% above state avg
Staff typeHours / Day / Residentvs state avg
Registered Nurse (RN) Info RNs hold the highest nursing license and can assess residents, interpret test results, and direct care plans. More RN hours per day often signals stronger clinical oversight and faster response to health changes. 35m per day ▼ 3% State avg: 37m per day · National avg: 41m per day
LPN / LVN Info Licensed Practical Nurses (LPNs) or Licensed Vocational Nurses (LVNs) deliver routine hands-on care — medication administration, wound dressing, and monitoring vital signs. They work under RN supervision and make up a large share of daily bedside care. 42m per day ▼ 22% State avg: 53m per day · National avg: 52m per day
Nurse Aide Info Certified Nurse Aides (CNAs) provide the most direct day-to-day assistance: bathing, dressing, feeding, and mobility. Nurse aide hours are typically the largest staffing category and directly affect residents' quality of life. 2h 43m per day ▲ 17% State avg: 2h 19m per day · National avg: 2h 20m per day
Weekend Total Nursing Info Combined nursing hours (RN + LPN + Nurse Aide) per resident per day on weekends. Staffing often drops on weekends — this figure reveals whether the facility maintains adequate coverage outside of weekday hours. 3h 35m per day ▲ 4% State avg: 3h 26m per day · National avg: 3h 27m per day
Physical Therapist Info Hours per resident per day provided by licensed Physical Therapists (PTs) or PT Assistants. PT services help residents recover mobility after injury or illness and are especially important for post-acute (short-stay) rehabilitation. 2m per day ▼ 55% State avg: 5m per day · National avg: 4m per day
Weekend RN Info Registered nurse hours specifically on weekends. Facilities sometimes reduce RN presence on Saturdays and Sundays — a low weekend RN figure compared to weekday hours can indicate reduced clinical oversight when most administrative staff are absent. 22m per day ▼ 10% State avg: 24m per day · National avg: 29m per day

Capacity and availability

This home usually has limited availability

Higher occupancy than the North Carolina average: 76.4%
Occupancy rate
85.7% Rank #75 / 271Occupancy rate — State benchmarkedThis home is ranked 75th out of 271 homes in North Carolina. Shows this facility's occupancy rate versus the North Carolina average, with its Statewide rank out of 271. Higher occupancy signals strong local demand and financial stability.Ranking totals vary by category as each rank only includes facilities that report data for that metric. Homes missing that data point aren't included in the ranking.Click the rank badge to see the full State ranking.Click here to see the full State ranking.
Avg. Length of Stay
157 days
Bed community size
115-bed community Rank #55 / 390Bed count — State benchmarkedThis home is ranked 55th out of 390 homes in North Carolina. Shows this facility's certified or reported bed count compared to other North Carolina facilities. Larger communities may offer more amenities, programs, and on-site services for residents and families.Ranking totals vary by category as each rank only includes facilities that report data for that metric. Homes missing that data point aren't included in the ranking.Click the rank badge to see the full State ranking.Click here to see the full State ranking.
A larger shared setting that may offer more common spaces and organized community services.
Walk Score
Walk Score: 31 / 100 Rank #294 / 572Walk Score — State benchmarkedThis home is ranked 294th out of 572 homes in North Carolina. Shows how walkable this facility's neighborhood is compared to the average Walk Score across North Carolina facilities. Higher scores benefit residents, families, and staff.Ranking totals vary by category as each rank only includes facilities that report data for that metric. Homes missing that data point aren't included in the ranking.Click the rank badge to see the full State ranking.Click here to see the full State ranking.
Somewhat walkable. A few nearby services may be reachable on foot, but most trips require transportation.

About this community

Amenities & Lifestyle

Library
Chapel
Dining Room
Specific Programsgeneral and dementia care
Religious ServicesYes
Volunteer ProgramsYes

Contact Maryfield Nursing Home

Staffing Data

Reporting period: October 1 – December 31, 2025 (Q4 2025). Source: CMS Payroll-Based Journal report.

Total staff 203
Employees 183
Contractors 20
Staff to resident ratio 1.77 : 1
0% compared with North Carolina average
North Carolina average ratio: 1.80 : 1 North Carolina average ratio: 1.80 : 1See full North Carolina ranking
Avg staff/day 69
Average shift 6.8 hours
15% worse than North Carolina average
North Carolina average: 8 hours North Carolina average shift: 8 hoursSee full North Carolina ranking
Total staff hours (quarter) 43,191

Nursing staff breakdown

Q4 2025 · Oct 1 – Dec 31 More info This data comes from the CMS Payroll-Based Journal report covering October 1 – December 31, 2025.
Registered Nurse

Manages medical care and health needs.

RN Staff Info All 19 RN Staff are full-time employees. No contractors work on this role. 19
Average shift length Info Average shift length. Calculated as total hours divided by days worked and average staff per day. 7.6 hours
Licensed Practical Nurse

Assists with medical care and medications.

LPN Staff Info All 29 LPN Staff are full-time employees. No contractors work on this role. 29
Average shift length Info Average shift length. Calculated as total hours divided by days worked and average staff per day. 7.7 hours
Certified Nursing Assistant

Helps with daily care and mobility.

CNA Staff Info All 111 CNA Staff are full-time employees. No contractors work on this role. 111
Average shift length Info Average shift length. Calculated as total hours divided by days worked and average staff per day. 6.7 hours

Contractor staffing

Q4 2025 · Oct 1 – Dec 31 More info This data comes from the CMS Payroll-Based Journal report covering October 1 – December 31, 2025.

Total hours from contractors

6.3%

2,738 contractor hours this quarter

Speech Language Pathologist: 4 Qualified Social Worker: 3 Physical Therapy Aide: 3 Respiratory Therapy Technician: 3 Other Physician: 2 Physical Therapy Assistant: 2 Feeding Assistant: 1 Medical Director: 1 Occupational Therapy Assistant: 1

Staff by category

Q4 2025 · Oct 1 – Dec 31 More info This data comes from the CMS Payroll-Based Journal report covering October 1 – December 31, 2025.
Certified Nursing Assistant111011125,51592100%6.7
Licensed Practical Nurse290295,72992100%7.7
Registered Nurse190193,53592100%7.6
Clinical Nurse Specialist4041,6906874%7.4
Mental Health Service Worker3031,2216571%7.4
RN Director of Nursing2028636267%7.5
Speech Language Pathologist0447355964%4.5
Physical Therapy Aide0336206975%4
Administrator1014355863%7.5
Occupational Therapy Aide1014355863%7.5
Physical Therapy Assistant0224045762%6.8
Nurse Practitioner1013985358%7.5
Respiratory Therapy Technician0333766470%3.5
Medication Aide/Technician100103293841%7.5
Other Dietary Services Staff2023043740%8.2
Qualified Social Worker0333005863%5.2
Medical Director0111472729%5.4
Occupational Therapy Assistant011891921%4.7
Feeding Assistant0114055%8
Other Physician022281415%2
111 Certified Nursing Assistant
% of Days 100%
29 Licensed Practical Nurse
% of Days 100%
19 Registered Nurse
% of Days 100%
4 Clinical Nurse Specialist
% of Days 74%
3 Mental Health Service Worker
% of Days 71%
2 RN Director of Nursing
% of Days 67%
4 Speech Language Pathologist
% of Days 64%
3 Physical Therapy Aide
% of Days 75%
1 Administrator
% of Days 63%
1 Occupational Therapy Aide
% of Days 63%
2 Physical Therapy Assistant
% of Days 62%
1 Nurse Practitioner
% of Days 58%
3 Respiratory Therapy Technician
% of Days 70%
10 Medication Aide/Technician
% of Days 41%
2 Other Dietary Services Staff
% of Days 40%
3 Qualified Social Worker
% of Days 63%
1 Medical Director
% of Days 29%
1 Occupational Therapy Assistant
% of Days 21%
1 Feeding Assistant
% of Days 5%
2 Other Physician
% of Days 15%

Penalties and fines

Federal penalties imposed by CMS for regulatory violations, including civil money penalties (fines) and denials of payment for new Medicare/Medicaid admissions.

Source: CMS Penalties Database

No penalties in the past 3 years

No civil money penalties or payment denials were reported in the last 3 years.

Quality of care over time

These measures show how residents usually do over time at this home, based on health outcomes and preventive care.

High-risk clinical events score Info A composite score based on pressure ulcers, falls with injury, weight loss, walking ability decline, and activities of daily living decline. 9.8
15% better than North Carolina average

North Carolina average: 11.5

Functional decline score Info A composite score based on activities of daily living decline, walking ability decline, and incontinence. 17.7
14% better than North Carolina average

North Carolina average: 20.6

Long-stay resident measures
Need for Help with Daily Activities Increased Info Percent of long-stay residents whose need for help with daily activities has increased 18.5%
5% worse than North Carolina average

North Carolina average: 17.5%

Walking Ability Worsened Info Percent of long-stay residents whose ability to move independently worsened 16.2%
31% better than North Carolina average

North Carolina average: 23.3%

Low Risk Residents with Bowel/Bladder Incontinence Info Percent of low risk long-stay residents who lose control of their bowels or bladder 18.6%
13% better than North Carolina average

North Carolina average: 21.4%

Falls with Major Injury Info Percent of long-stay residents experiencing one or more falls with major injury 4.3%
17% worse than North Carolina average

North Carolina average: 3.6%

High Risk Residents with Pressure Ulcers Info Percent of long-stay high risk residents with pressure ulcers 3.4%
46% better than North Carolina average

North Carolina average: 6.3%

Urinary Tract Infection Info Percent of long-stay residents with a urinary tract infection 3.6%
36% worse than North Carolina average

North Carolina average: 2.6%

Lost Too Much Weight Info Percent of long-stay residents who lose too much weight 6.5%
12% better than North Carolina average

North Carolina average: 7.4%

Depressive Symptoms Info Percent of long-stay residents who have depressive symptoms 3.0%
31% better than North Carolina average

North Carolina average: 4.4%

Antipsychotic Use Info Percent of long-stay residents who received an antipsychotic medication 13.6%
In line with North Carolina average

North Carolina average: 13.4%

Pneumococcal Vaccine Info Percent of long-stay residents assessed and appropriately given the pneumococcal vaccine 99.7%
9% better than North Carolina average

North Carolina average: 91.6%

Influenza Vaccine Info Percent of long-stay residents assessed and appropriately given the seasonal influenza vaccine 100.0%
6% better than North Carolina average

North Carolina average: 94.1%

Short-stay resident measures
Pneumococcal Vaccine Info Percent of short-stay residents assessed and appropriately given the pneumococcal vaccine 85.1%
7% better than North Carolina average

North Carolina average: 79.9%

Antipsychotic medication increase Info Percent of short-stay residents who newly received an antipsychotic medication 1.9%
26% worse than North Carolina average

North Carolina average: 1.5%

Influenza Vaccine Info Percent of short-stay residents assessed and appropriately given the seasonal influenza vaccine 94.7%
21% better than North Carolina average

North Carolina average: 78.1%

Breakdown by payment type

Medicare

22% of new residents, usually for short-term rehab.

Typical stay 12 days

Private pay

59% of new residents, often for short stays.

Typical stay 1 - 2 months

Medicaid

19% of new residents, often for long-term daily care.

Typical stay 3 - 4 months

Facility Characteristics

Source: CMS Long-Term Care Facility Characteristics (Data as of Jan 2026)

Total residents 115
Medicare
2
1.7% of residents
Medicaid
35
30.4% of residents
Private pay or other
78
67.8% of residents
Programs & Services
Residents Group

Residents meet regularly to discuss policies, care quality, and activities

Family Member Group

Family members meet regularly to discuss policies, care quality, and activities

CCRC

Part of a Continuing Care Retirement Community offering multiple care levels

Active Family Council

Organized group of family members that meets regularly to discuss facility policies, resident care, and activities.

Active Resident Council

Organized group of residents that meets regularly to discuss facility policies, quality of life, and activities.

Finances and operations

Based on CMS SNF Cost Report for fiscal year ending in 09/2023.

Governmental community
Net patient revenue Info Net patient revenue — what the home actually collects for resident care, after contractual allowances, bad debt and discounts are subtracted from its gross charges (CMS cost report, Worksheet G-3). It covers resident care only; money the home earns from other sources is shown separately as "Other income."
$31.4M
Net patient income Info Net patient income: net patient revenue minus the home's total operating expenses. A positive figure means it earns more from resident care than it spends to deliver it; a negative figure means the opposite. It excludes non-operating "other income."
-$4.3M
Governmental community
Net patient revenue Info Net patient revenue — what the home actually collects for resident care, after contractual allowances, bad debt and discounts are subtracted from its gross charges (CMS cost report, Worksheet G-3). It covers resident care only; money the home earns from other sources is shown separately as "Other income."
$31.4M Rank #11 / 104Revenue — State benchmarkedThis home is ranked 11th out of 104 homes in North Carolina. Shows this facility's annual revenue compared to the North Carolina average. Higher revenue generally means more resources for staffing and capital — read alongside Payroll %.Ranking totals vary by category as each rank only includes facilities that report data for that metric. Homes missing that data point aren't included in the ranking.Click the rank badge to see the full State ranking.Click here to see the full State ranking.
Net patient income Info Net patient income: net patient revenue minus the home's total operating expenses. A positive figure means it earns more from resident care than it spends to deliver it; a negative figure means the opposite. It excludes non-operating "other income."
-$4.3M
Other income Info Money the home earns outside of resident care — such as investments, grants, rentals and other non-operating sources (CMS cost report, Worksheet G-3). It is tracked separately from net patient revenue: it is not part of that figure, and it is not included in net patient income.
$5.5M
Payroll costs Info Staff salaries plus wage-related costs — benefits such as payroll taxes, health insurance and retirement — from the home's own accounting records (CMS cost report, Worksheet A). Contract or agency labor is counted separately, under other operating costs. Rank #12 / 104Payroll — State benchmarkedThis home is ranked 12th out of 104 homes in North Carolina. Shows total annual staff payroll benchmarked to the North Carolina average. Higher payroll investment relative to peers often signals better staffing and less reliance on cheaper contract labor.Ranking totals vary by category as each rank only includes facilities that report data for that metric. Homes missing that data point aren't included in the ranking.Click the rank badge to see the full State ranking.Click here to see the full State ranking.
$16.3M 52% of net patient revenue Info Payroll as a share of revenue: staff salaries and wage-related benefits divided by net patient revenue. A higher figure means more of each revenue dollar goes to staff pay. Rank #69 / 104Payroll % — State benchmarkedThis home is ranked 69th out of 104 homes in North Carolina. Shows payroll as a percentage of revenue versus the North Carolina average. Well-run North Carolina facilities typically land around 49–62% — the top third Statewide. Below 25% may signal understaffing or heavy agency use — read with Staffing ratings.Ranking totals vary by category as each rank only includes facilities that report data for that metric. Homes missing that data point aren't included in the ranking.Click the rank badge to see the full State ranking.Click here to see the full State ranking.
Other operating costs Info Everything it costs to run the home apart from payroll — food, utilities, supplies, maintenance, contract labor and administration. Calculated as total operating expense minus payroll (staff salaries and wage-related benefits).
$19.4M
Total costs Info The home's total operating expense for the year — all the costs of running it, salaries included (CMS cost report, Worksheet G-3).
$35.8M

Who this home usually serves

TYPE OF STAY

Mix of rehab and long-term care

This home supports both short-term rehab and long-term care, with residents staying for a wide range of durations.

Most new residents arrive under private pay (59% of admissions), and a typical private pay stay runs around 1 - 2 months.

Admissions
750 total

Coverage residents most often arrive under.

Medicare 22%
Private pay 59%
Medicaid 19%
Discharges
249 total

Coverage residents most often leave under.

Medicare 24%
Private pay 74%
Medicaid 2%

Compare Nursing Home around Greensboro

The information below is reported by the North Carolina Department of Health and Human Services, Division of Health Service Regulation.

4 facilities compared · CMS & NC Dept. of Health data

Maryfield Nursing Home
NH
MC
NC
PC
Greensboro
115
Facility 115
NC AVG 72
Rank #55 / 390
85.7%
Facility 85.7%
NC AVG 76.4%
Rank #75 / 271
+12%
4.21
Facility 4.21
NC AVG 3.98
Rank #35 / 97
+3%+6%
$0
Facility $0
NC AVG $74.6k
Rank #1 / 105
1
Facility 1
NC AVG 20.9
Rank #1 / 101
1.0
Facility 1.0
NC AVG 5.0
Rank #1 / 101
-103-
31
Facility 31
NC AVG 33
Rank #294 / 572
Maryfield, Inc.
$31.4M
Facility $31.4M
NC AVG $13.2M
Rank #11 / 104
$16.3M
Facility $16.3M
NC AVG $4.9M
Rank #12 / 104
52%
Facility 52%
NC AVG 39.8%
Rank #69 / 104
345093
Maple Grove Health & Rehabilitation Center
NH
MC
Greensboro
210
Facility 210
NC AVG 72
Rank #2 / 390
41.6%
Facility 41.6%
NC AVG 76.4%
Rank #221 / 271
-46%
3.81
Facility 3.81
NC AVG 3.98
Rank #58 / 97
-7%-4%
$50.3k
Facility $50.3k
NC AVG $74.6k
Rank #81 / 105
24
Facility 24
NC AVG 20.9
Rank #75 / 101
6.0
Facility 6.0
NC AVG 5.0
Rank #80 / 101
3107-
51
Facility 51
NC AVG 33
Rank #137 / 572
-
$11.6M
Facility $11.6M
NC AVG $13.2M
Rank #76 / 104
$5.0M
Facility $5.0M
NC AVG $4.9M
Rank #38 / 104
42.8%
Facility 42.8%
NC AVG 39.8%
Rank #5 / 104
345448
Heartland Living and Rehabilitation
NH
NC
RC
Greensboro
107
Facility 107
NC AVG 72
Rank #67 / 390
67.3%
Facility 67.3%
NC AVG 76.4%
Rank #162 / 271
-12%
4.05
Facility 4.05
NC AVG 3.98
Rank #43 / 97
-80%+2%
$0
Facility $0
NC AVG $74.6k
Rank #1 / 105
12
Facility 12
NC AVG 20.9
Rank #45 / 101
4.0
Facility 4.0
NC AVG 5.0
Rank #49 / 101
-92-
39
Facility 39
NC AVG 33
Rank #231 / 572
Horace Wilson
$11.8M
Facility $11.8M
NC AVG $13.2M
Rank #58 / 104
$4.8M
Facility $4.8M
NC AVG $4.9M
Rank #54 / 104
40.2%
Facility 40.2%
NC AVG 39.8%
Rank #29 / 104
345391
Kindred Hospital Greensboro
NH
Greensboro
23
Facility 23
NC AVG 72
Rank #333 / 390
--
2.85
Facility 2.85
NC AVG 3.98
Rank #95 / 97
-36%-28%
$0
Facility $0
NC AVG $74.6k
Rank #1 / 105
7
Facility 7
NC AVG 20.9
Rank #27 / 101
7.0
Facility 7.0
NC AVG 5.0
Rank #89 / 101
-20-
23
Facility 23
NC AVG 33
Rank #358 / 572
----345273

Financial Assistance for
Nursing Home in North Carolina

Maryfield Nursing Home is located in Greensboro, North Carolina.
Here are the financial assistance programs available to residents in North Carolina.

Get Financial aid guidance

Community Alternatives Program for Disabled Adults

NC Medicaid CAP/DA

Age 65+ or disabled
General North Carolina resident, Medicaid- eligible, nursing home-level care need.
Income Limits (2025) ~$2,829/month 300% FBR, individual
Asset Limits $2,000 (individual), $3,000 (couple).
NC

High demand; waitlists common in urban areas.

Benefits
Personal care (5-7 hours/day) Respite (240 hours/year) Adult day care ($60/day) Home modifications ($1,500 avg.)

North Carolina Senior Care Options

NC SCO (via NFCSP)

Age Caregiver of someone 60+ (or with dementia)
General North Carolina resident.
Income Limits No strict limit; prioritizes low-income.
Asset Limits Not applicable.
NC

Limited slots; rural/urban balance.

Benefits
In-home respite (4-6 hours/day) Adult day care (~$60/day) Short-term facility care (up to 5 days)

Program of All-Inclusive Care for the Elderly (PACE)

North Carolina PACE (e.g., PACE of the Triad)

Age 55+
General NC resident (specific counties), NFLOC, safe with PACE support.
Income Limits (2025) ~$2,829/month (Medicaid-eligible); private pay option available.
Asset Limits $2,000 (individual), $3,000 (couple) for Medicaid enrollees.
NC

Available in 10+ counties (e.g., Guilford, Wake); multiple providers (e.g., PACE of the Southern Piedmont).

Benefits
Personal care (5-7 hours/day) Medical care Meals Transportation Respite Therapies

In-Home Aide Services

North Carolina In-Home Aide Services

Age 60+
General NC resident, unable to perform 1+ ADL, at risk of nursing home placement.
Income Limits (2025) No strict cap; prioritizes low-income ~$24,980/year
Asset Limits Not assessed; need-based.
NC

Family can be aides; varies by county funding.

Benefits
Personal care (5-20 hours/week) Meal prep Respite (~5 days/year) Errands

Medicare Savings Program (MSP)

North Carolina Medicare Savings Program

Age 65+ or disabled
General NC resident, Medicare Part A/B.
Income Limits (2025) ~$2,510/month (QMB), ~$3,380/month (SLMB), ~$3,598/month (QI)—individual.
Asset Limits $9,430 (individual), $14,130 (couple).
NC

Three tiers; no waitlist; includes Extra Help for Part D.

Benefits
Covers Part B premiums ($174.70/month) Deductibles ($240/year) Copays (~20%)

VA Aid and Attendance (A&A) and Housebound Benefits

North Carolina VA Aid and Attendance/Housebound

Age 65+ or disabled veteran/spouse
General NC resident, wartime service, need for ADL help (A&A) or homebound.
Income Limits (2025) Net income < ~$1,984/month (veteran with dependent, A&A); pension offsets income.
Asset Limits ~$155,356 net worth limit
NC

High veteran demand in rural/urban areas.

Benefits
Cash (~$1,433-$2,642/month veteran, ~$951-$1,318 spouse) for care costs (e.g., in-home, assisted living)

Urgent Repair Program (URP)

North Carolina Urgent Repair Program

Age 60+ prioritized
General NC resident, homeowner, low-income.
Income Limits (2025) ~$30,258/year 50% AMI, varies by county
Asset Limits Not strictly assessed; home value considered.
NC

Forgivable at $2,000/year; statewide via local partners.

Benefits
Repairs (~$8,000-$12,000 avg.) for safety (e.g., roofs, heating, accessibility)

State/County Special Assistance (SA)

North Carolina Special Assistance

Age 65+ (or disabled)
General NC resident, in licensed adult care home, low-income.
Income Limits (2025) ~$1,255/month (individual, 100% FPL); varies by facility rate.
Asset Limits $2,000 individual
NC

Covers assisted living; counties supplement state funds.

Benefits
Cash (~$1,200-$1,500/month) for room/board; Medicaid covers care services

Frequently Asked Questions about Maryfield Nursing Home

Is Maryfield Nursing Home in a walkable area?

Maryfield Nursing Home has a walk score of 31. Somewhat walkable. A few nearby services may be reachable on foot, but most trips require transportation.

What is the occupancy rate at Maryfield Nursing Home?

Maryfield Nursing Home's occupancy is 85.7%.

Are there photos of Maryfield Nursing Home?

Yes — there are 30 photos of Maryfield Nursing Home in the photo gallery on this page.

What is the phone number of Maryfield Nursing Home?

(336) 821-4000 will put you in contact with the team at Maryfield Nursing Home.

Is Maryfield Nursing Home Medicare or Medicaid certified?

Yes — Maryfield Nursing Home is a CMS-certified provider of Medicare and Medicaid.

Guides for Better Senior Living

Care Cost Calculator: See Prices in Your Area

Nursing Home Data Explorer

Don’t Wait Too Long: 7 Red Flag Signs Your Parent Needs Assisted Living Now

The True Cost of Assisted Living in 2025 – And How Families Are Paying For It

Understanding Senior Living Costs: Pricing Models, Discounts & Financial Assistance