Evergreen Living Center at Stagecoach
Nursing Home, Memory Care, Respite Care & Skilled Nursing · Bryant, AR
CMS overall rating Info CMS (the Centers for Medicare & Medicaid Services) is the federal agency that rates nursing home quality. Its Overall Rating runs from 1 to 5 stars, combining health inspections, staffing, and quality measures, with inspections weighted most heavily.

Evergreen Living Center at Stagecoach

Nursing Home, Memory Care, Respite Care & Skilled Nursing · Bryant, AR
CMS overall rating Info CMS (the Centers for Medicare & Medicaid Services) is the federal agency that rates nursing home quality. Its Overall Rating runs from 1 to 5 stars, combining health inspections, staffing, and quality measures, with inspections weighted most heavily.
Calculator: See prices in your area
Evergreen Living Center at Stagecoach accepts Medicare, Medicaid, and private pay.

Overview of Evergreen Living Center at Stagecoach

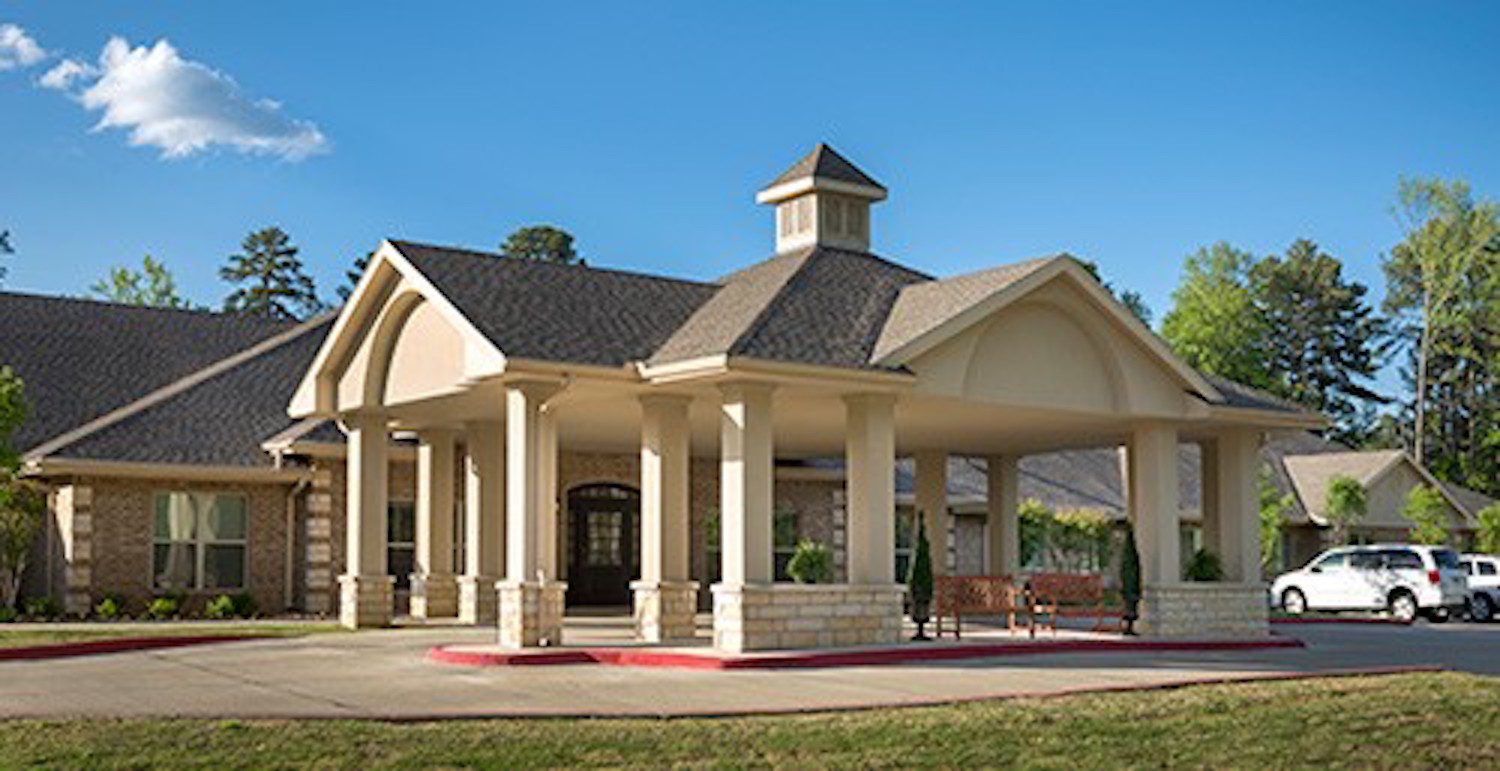
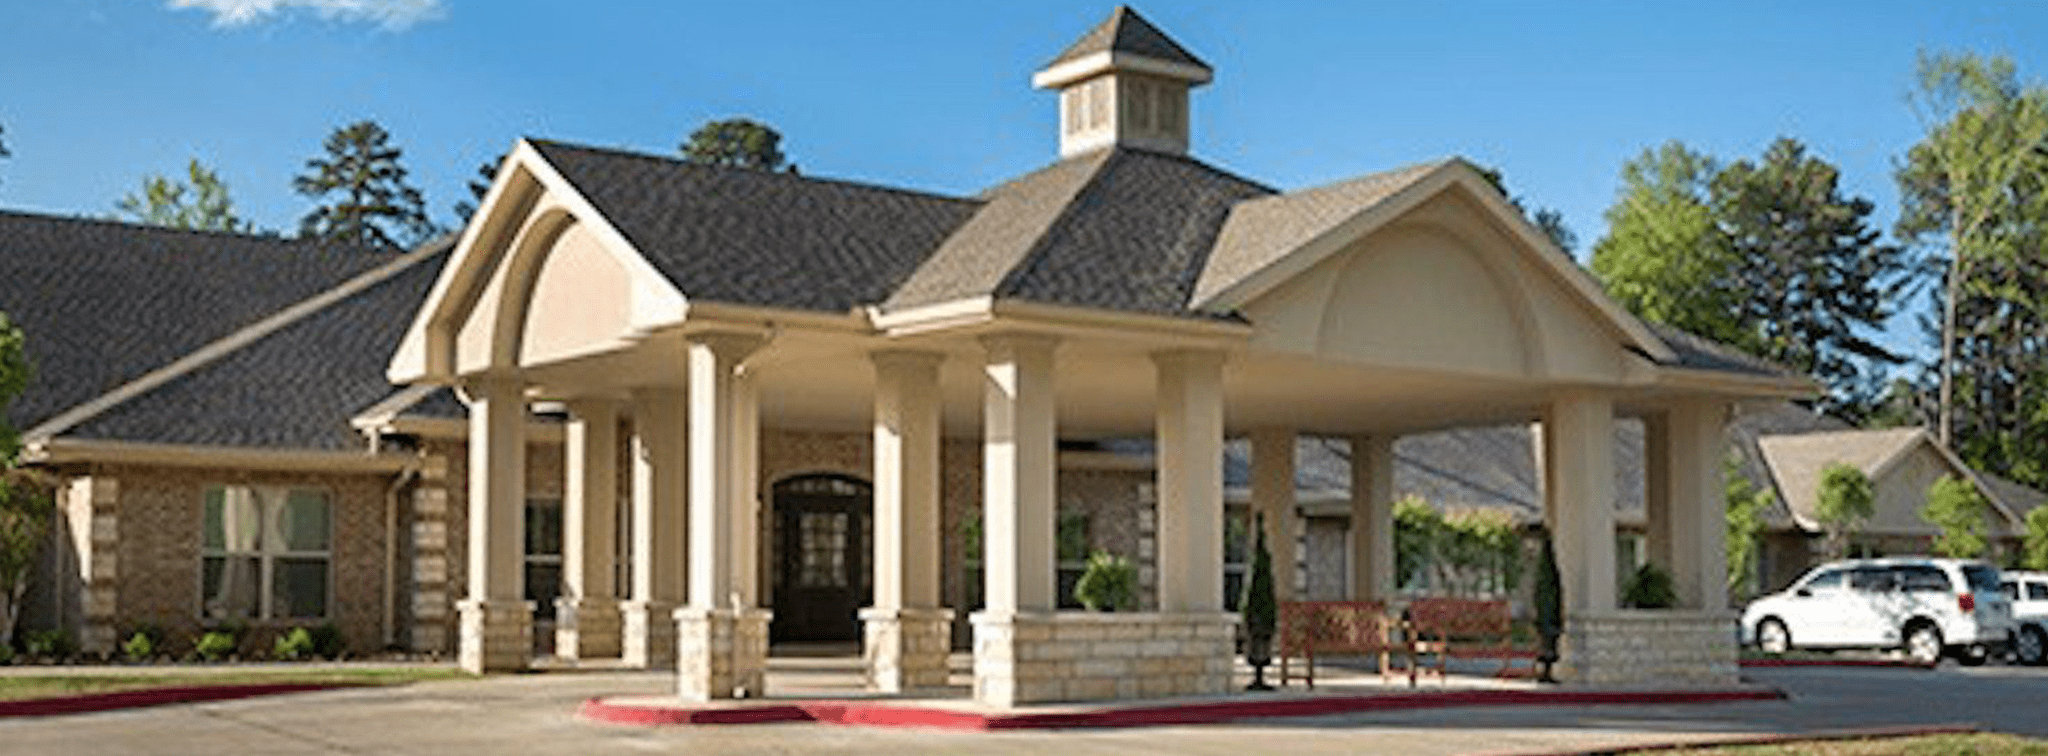
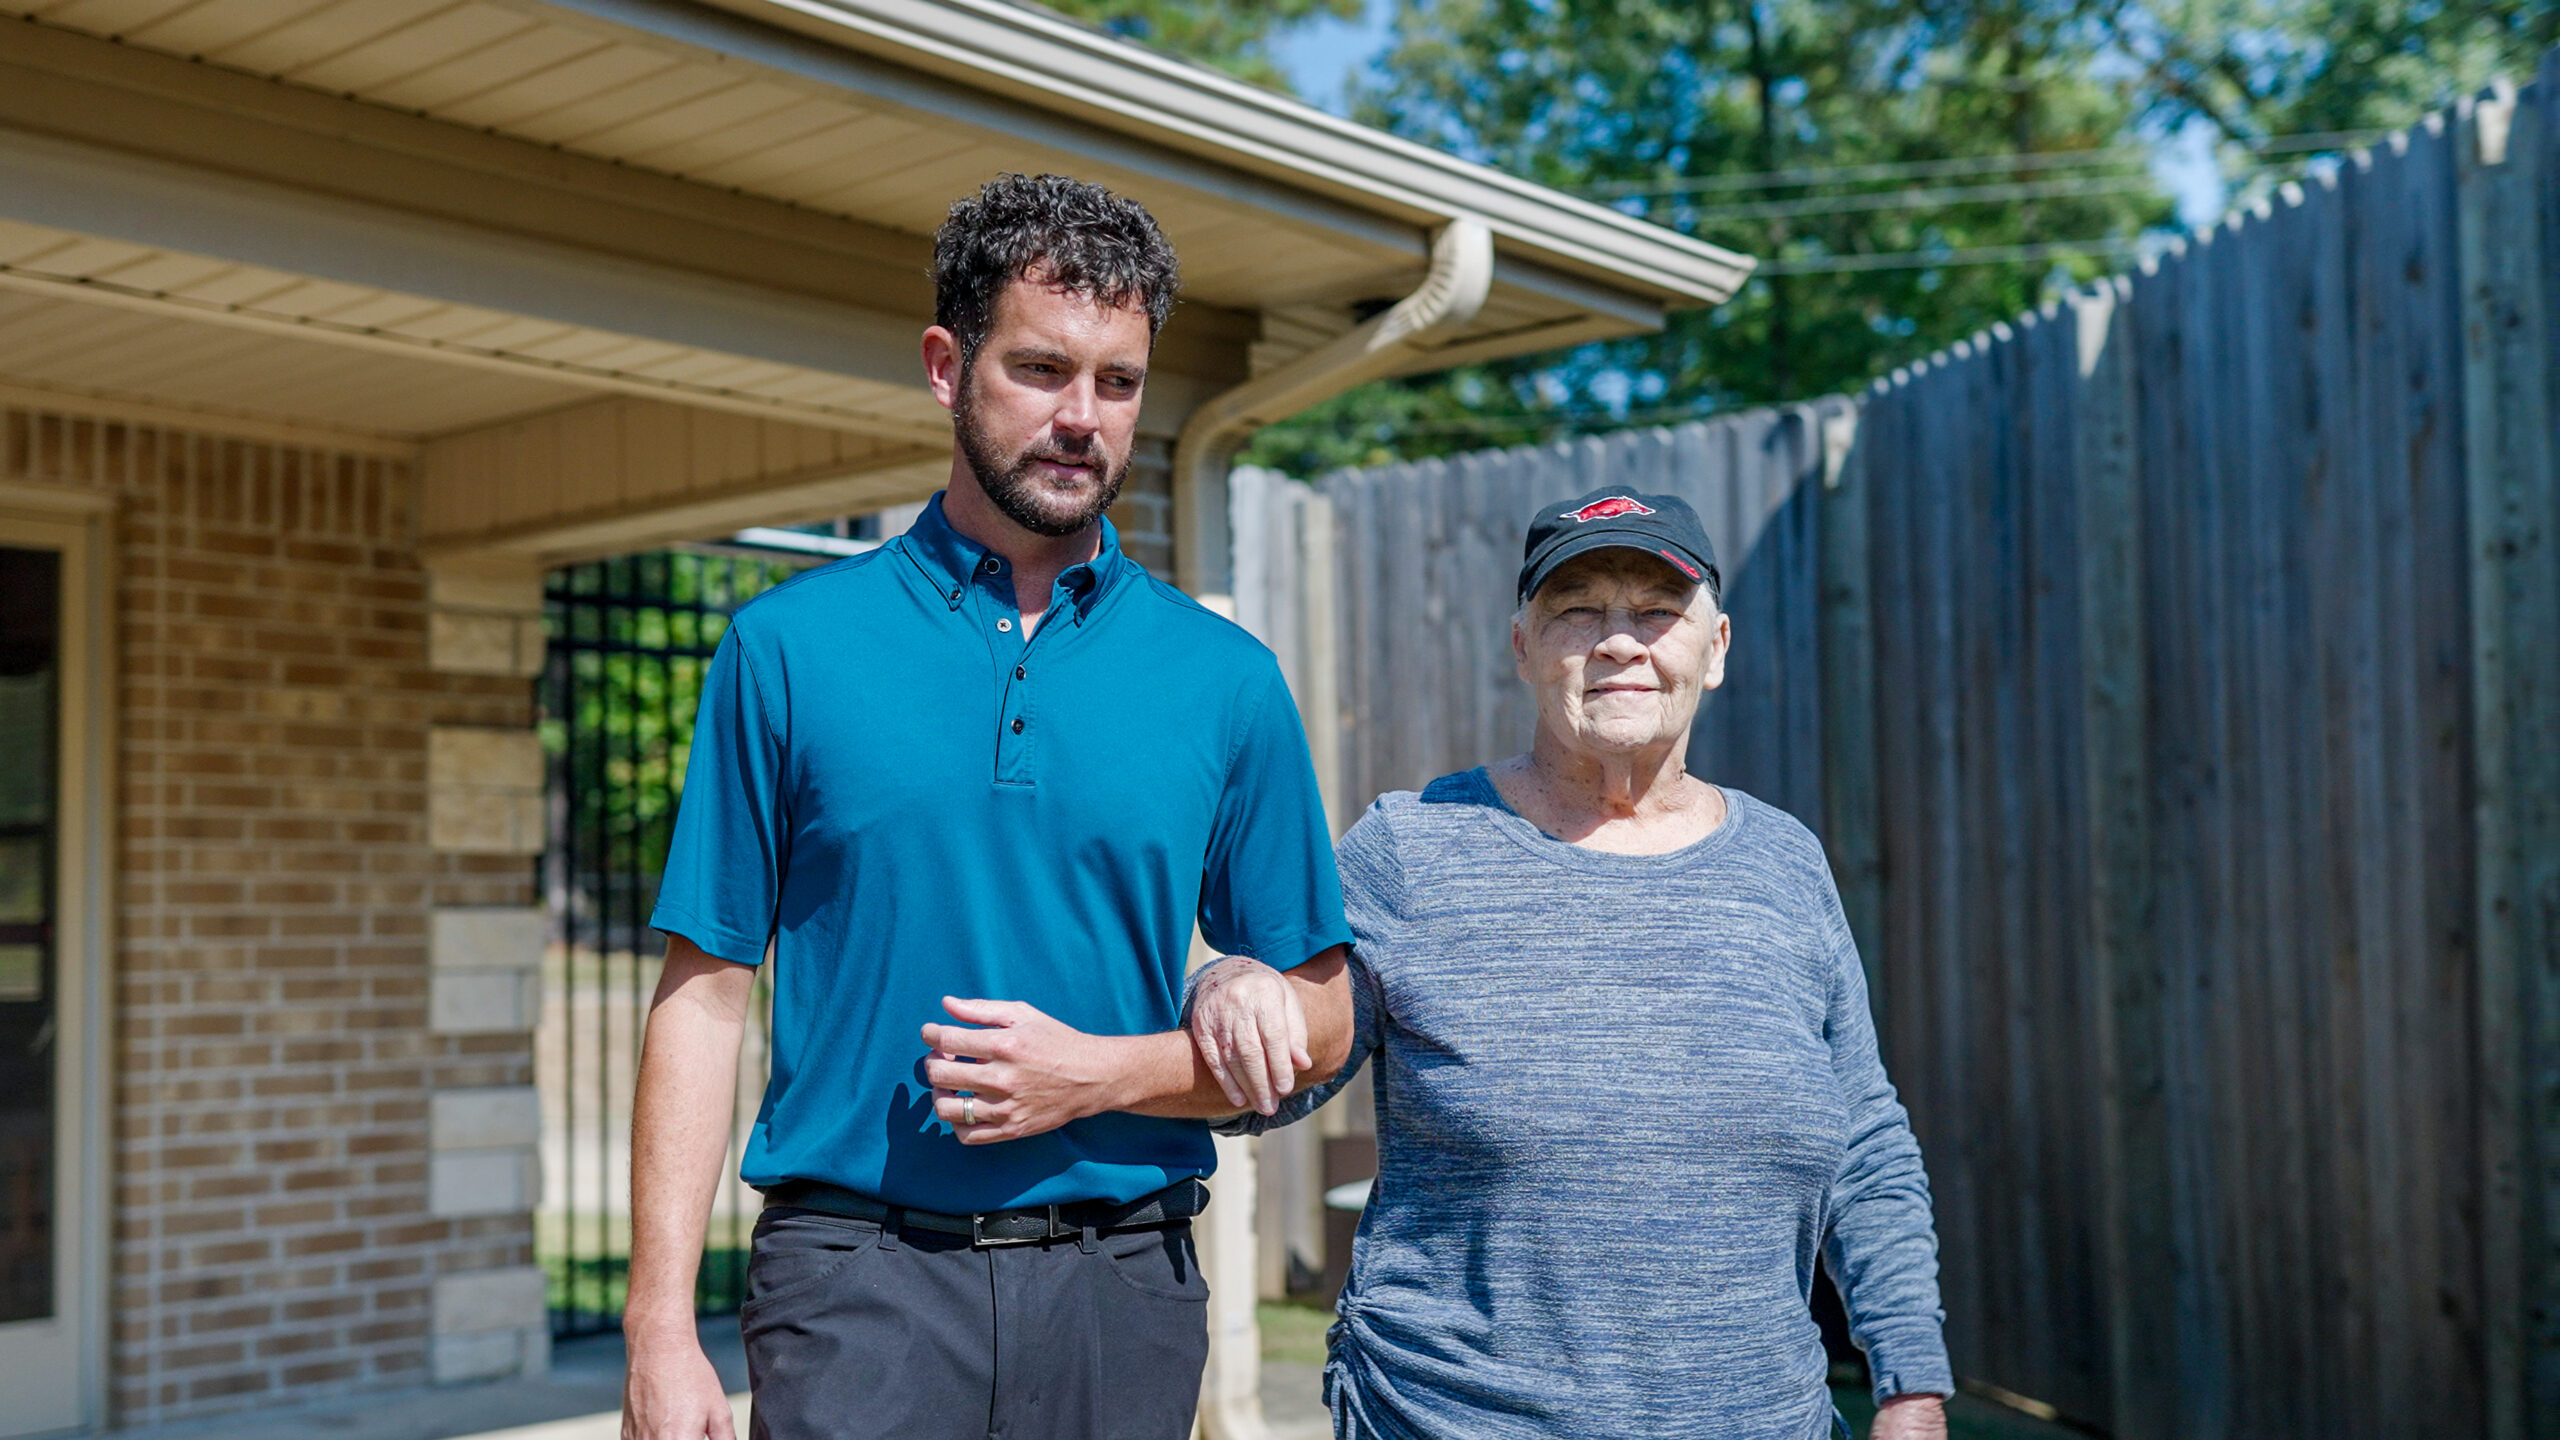
Evergreen Living Center at Stagecoach, a nursing home in Bryant, Arkansas, is part of a network operated by Salco NC, Inc., under the ownership of Orenthia Steverson. With 116 beds, it accepts Medicare, Medicaid, and private pay, offering families multiple ways to pay for short-term rehabilitation and longer-term care.

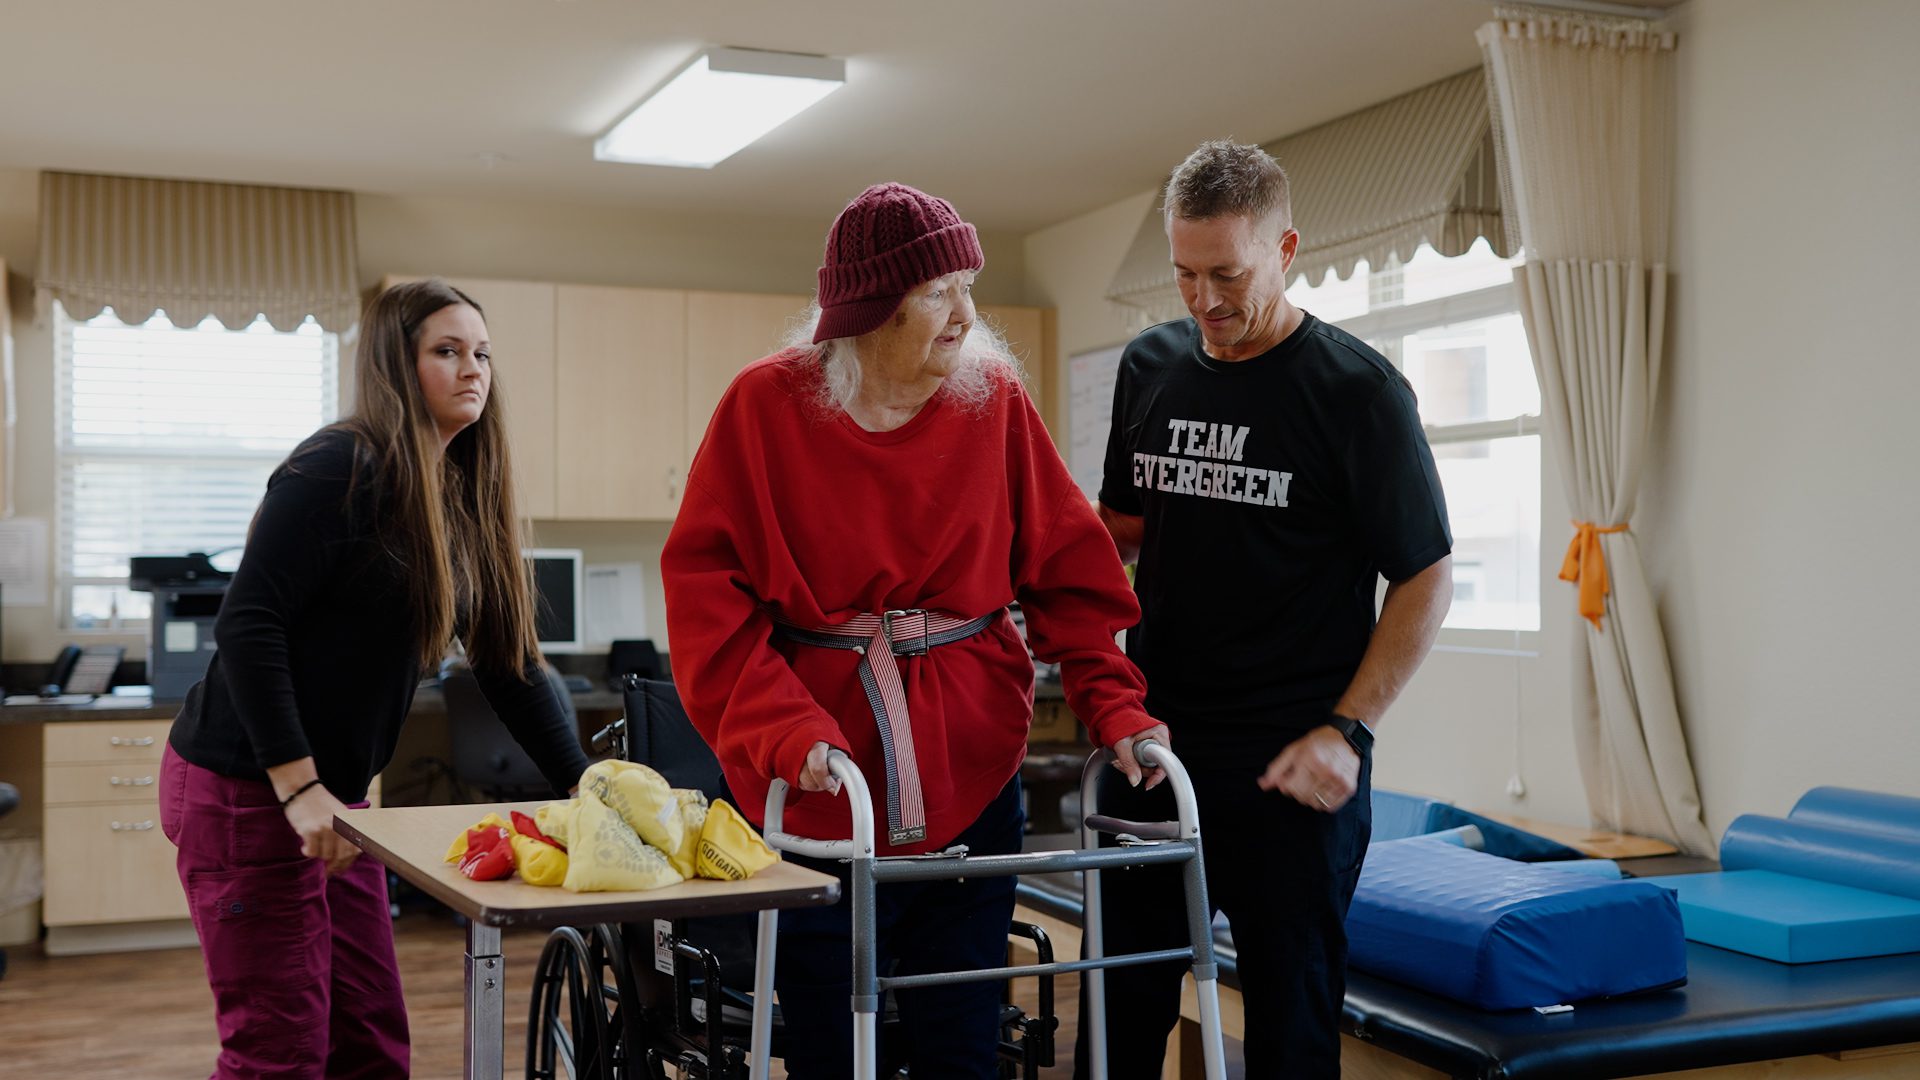
The facility’s current occupancy is 84%, and most residents stay an average of 232 days. This shows the balance between post-acute rehabilitation admissions and ongoing skilled nursing care. The facility primarily focuses on rehabilitation and short-term recovery. It offers a formal short-term rehabilitation program, respite care, and standard nursing services.

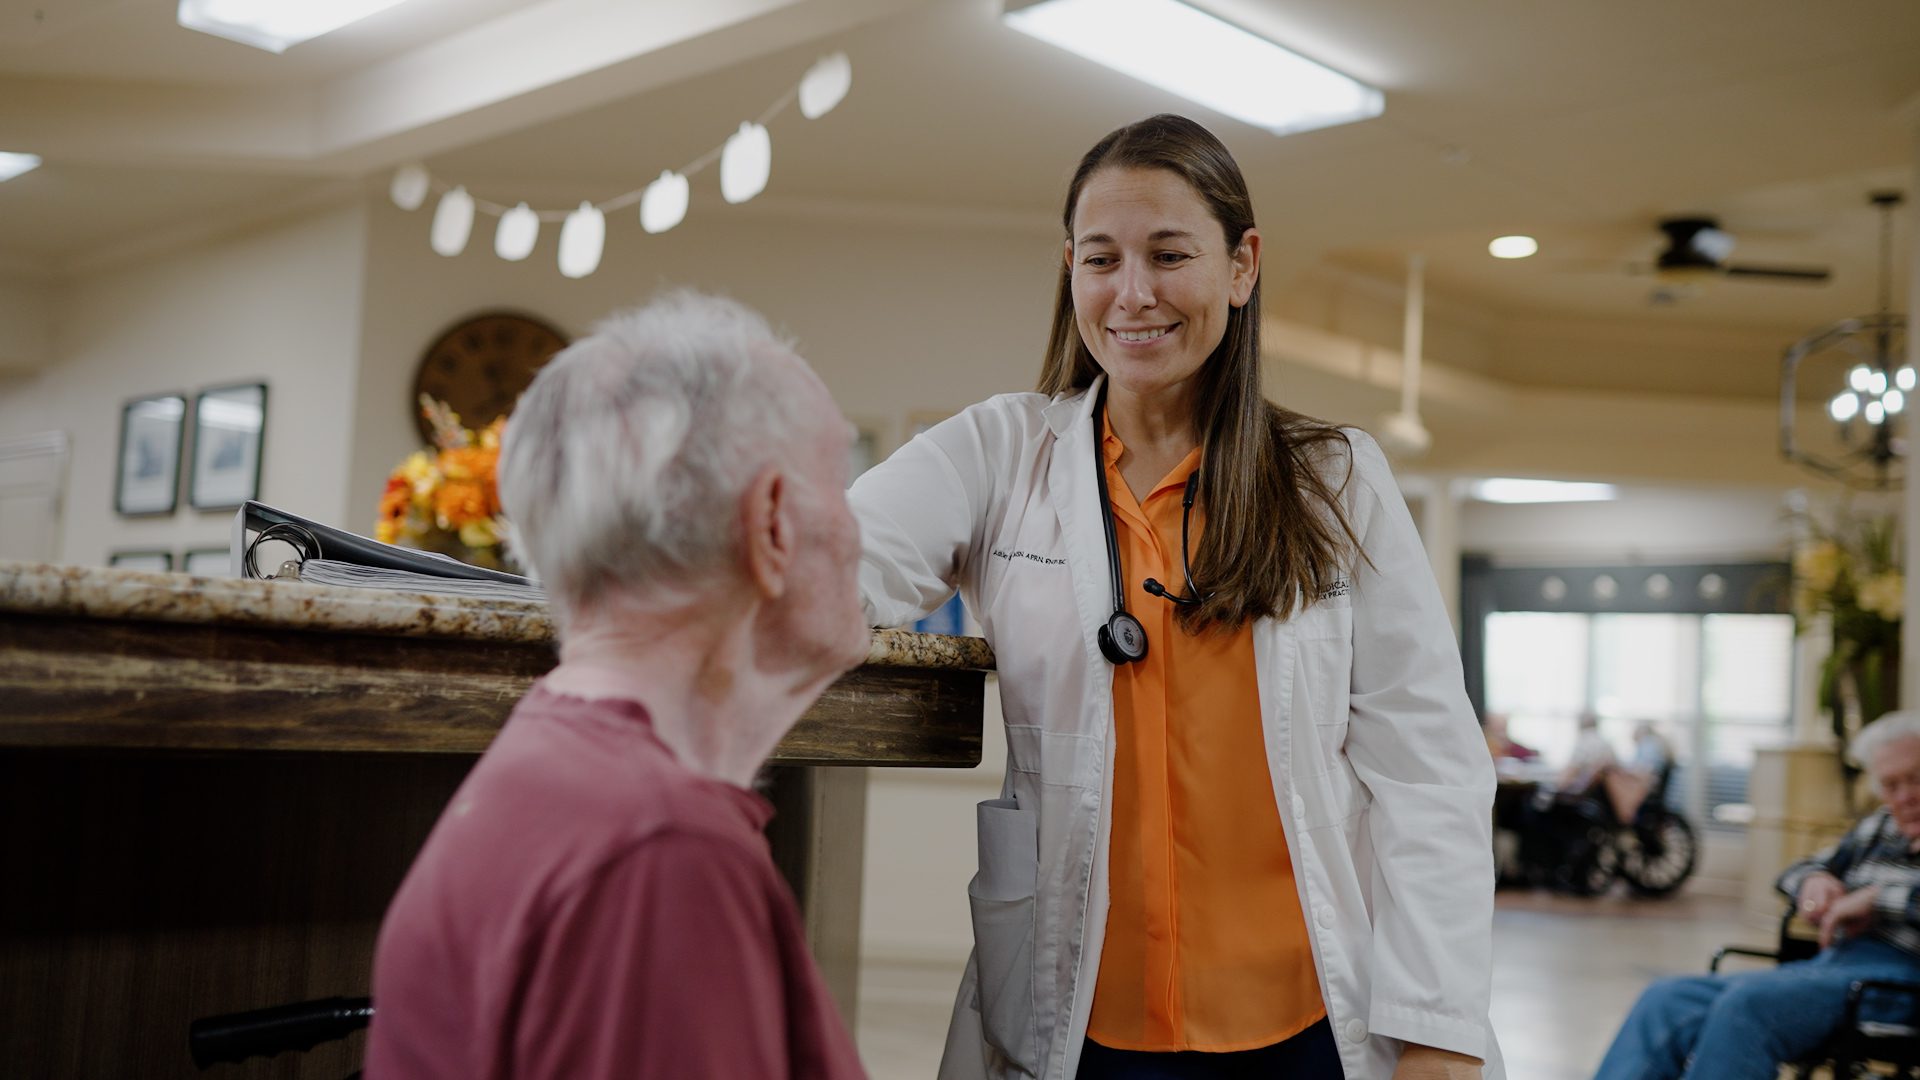
Daily nurse staffing averages about 4 hours and 37 minutes per resident daily, which is made up of registered nurses, licensed nurses, and nursing aides. The facility has 24-hour staffing to provide continuous services for residents needing assistance with medical care, medication management, and activities of daily living.

State inspections cited deficiencies in staffing adequacy, adherence to care procedures, documentation completeness, and consistency in infection control and environmental safety protocols. So, families evaluating the facility should ask directly how they manage resident transfers, staff scheduling, care-planning documentation, and infection prevention.

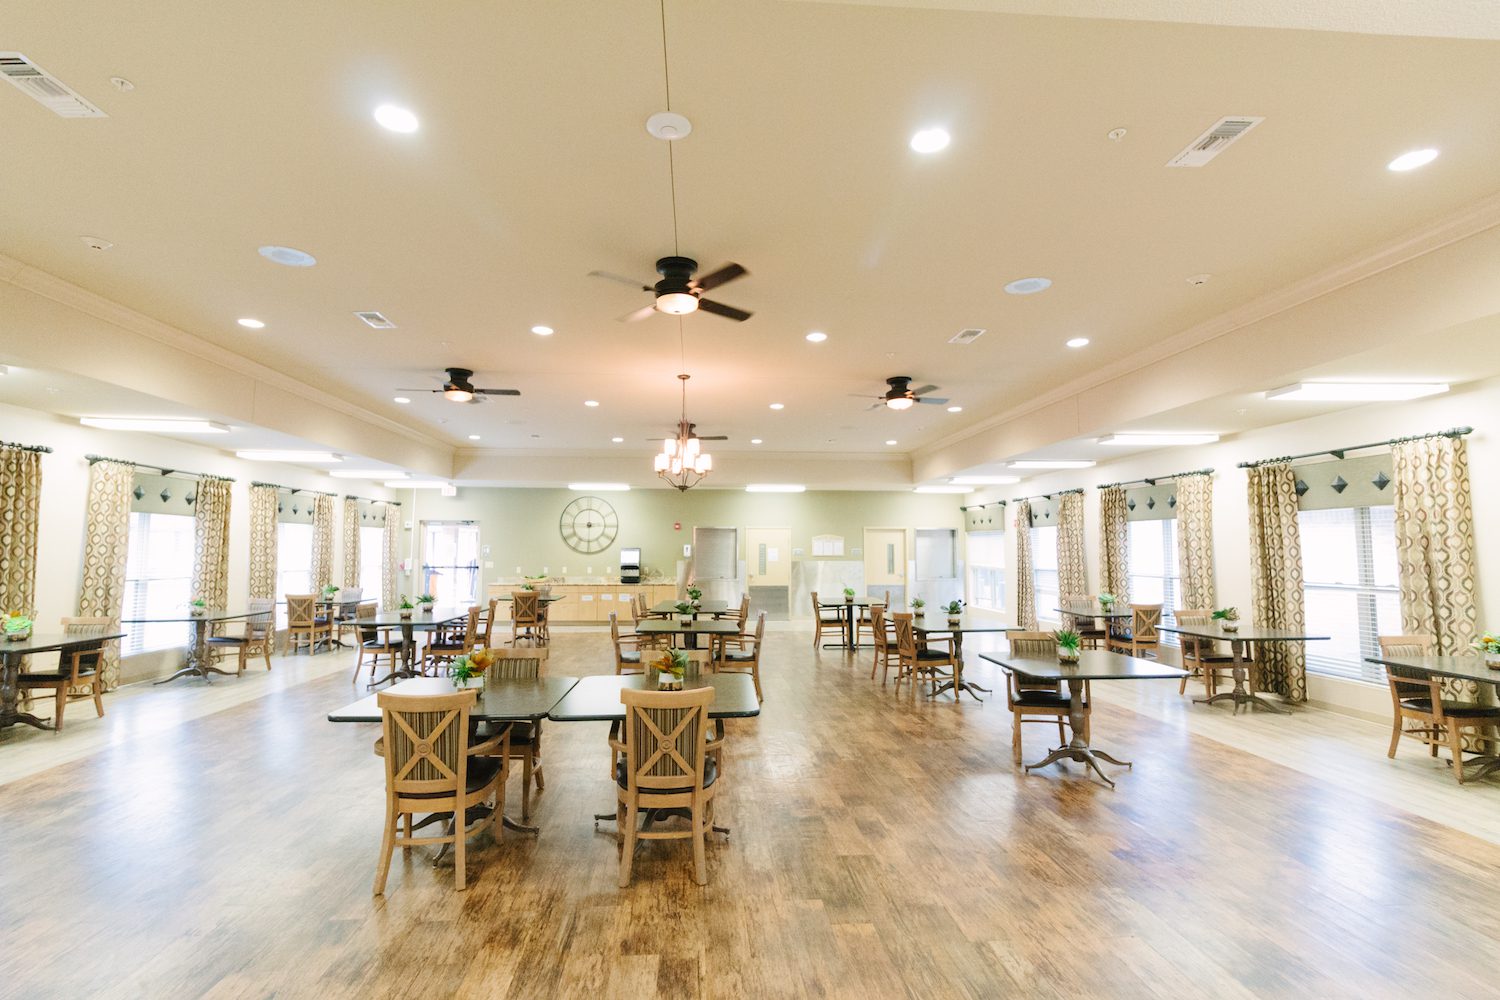
Daily life of residents is supported by a certified dietary manager and cooking staff who prepare nutritious meals. They work with residents and families to honor food preferences and medical diet requirements.

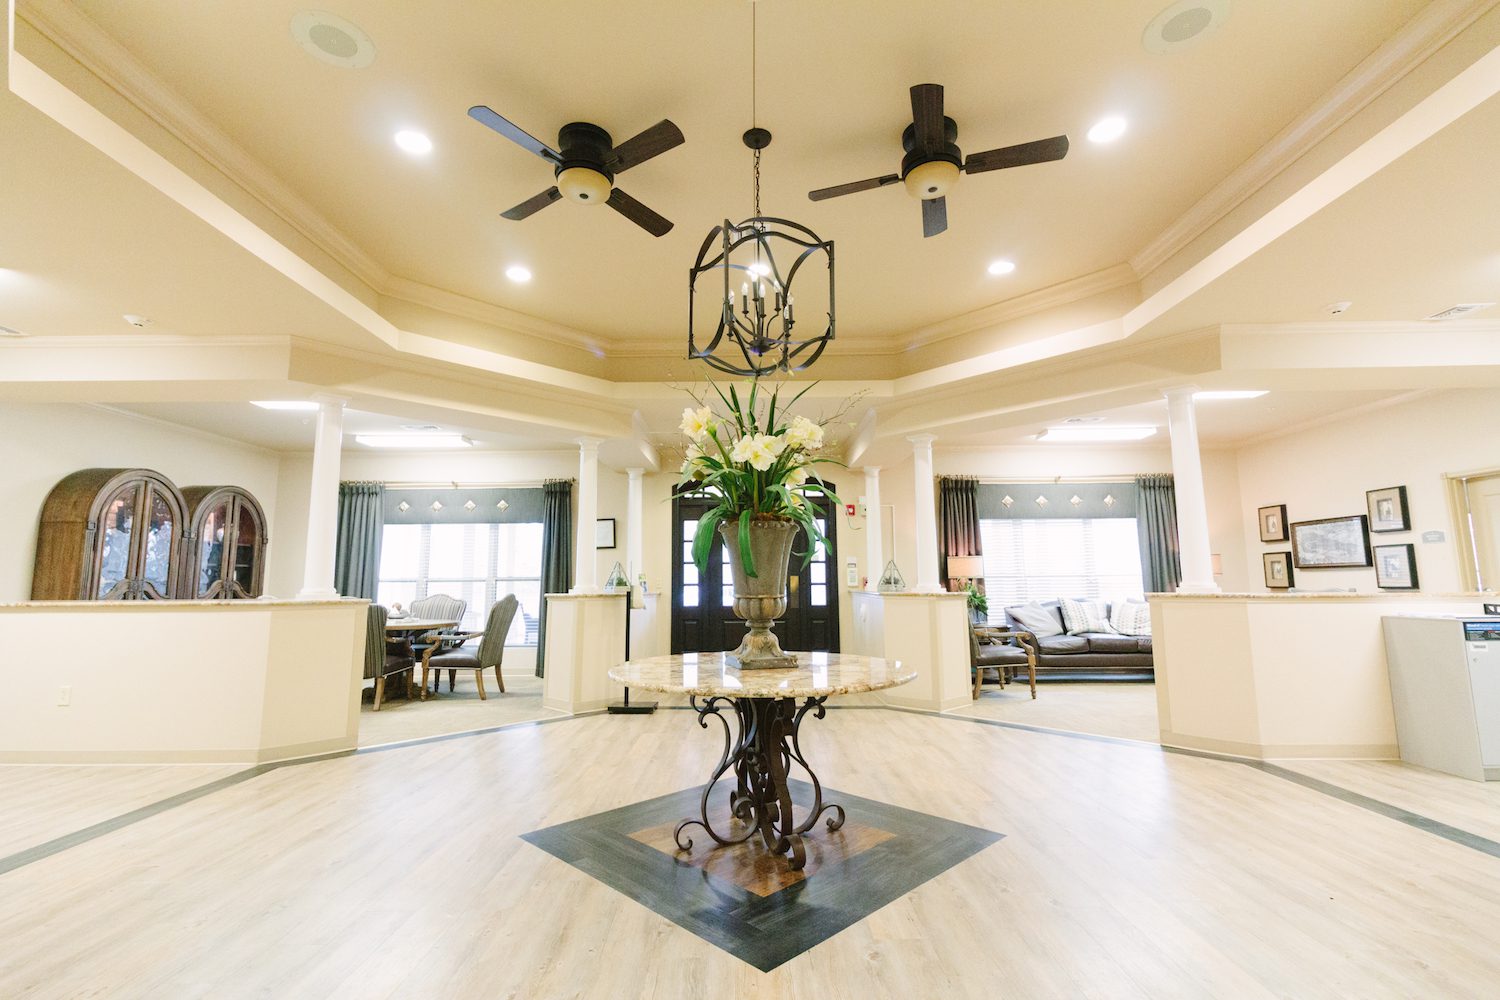
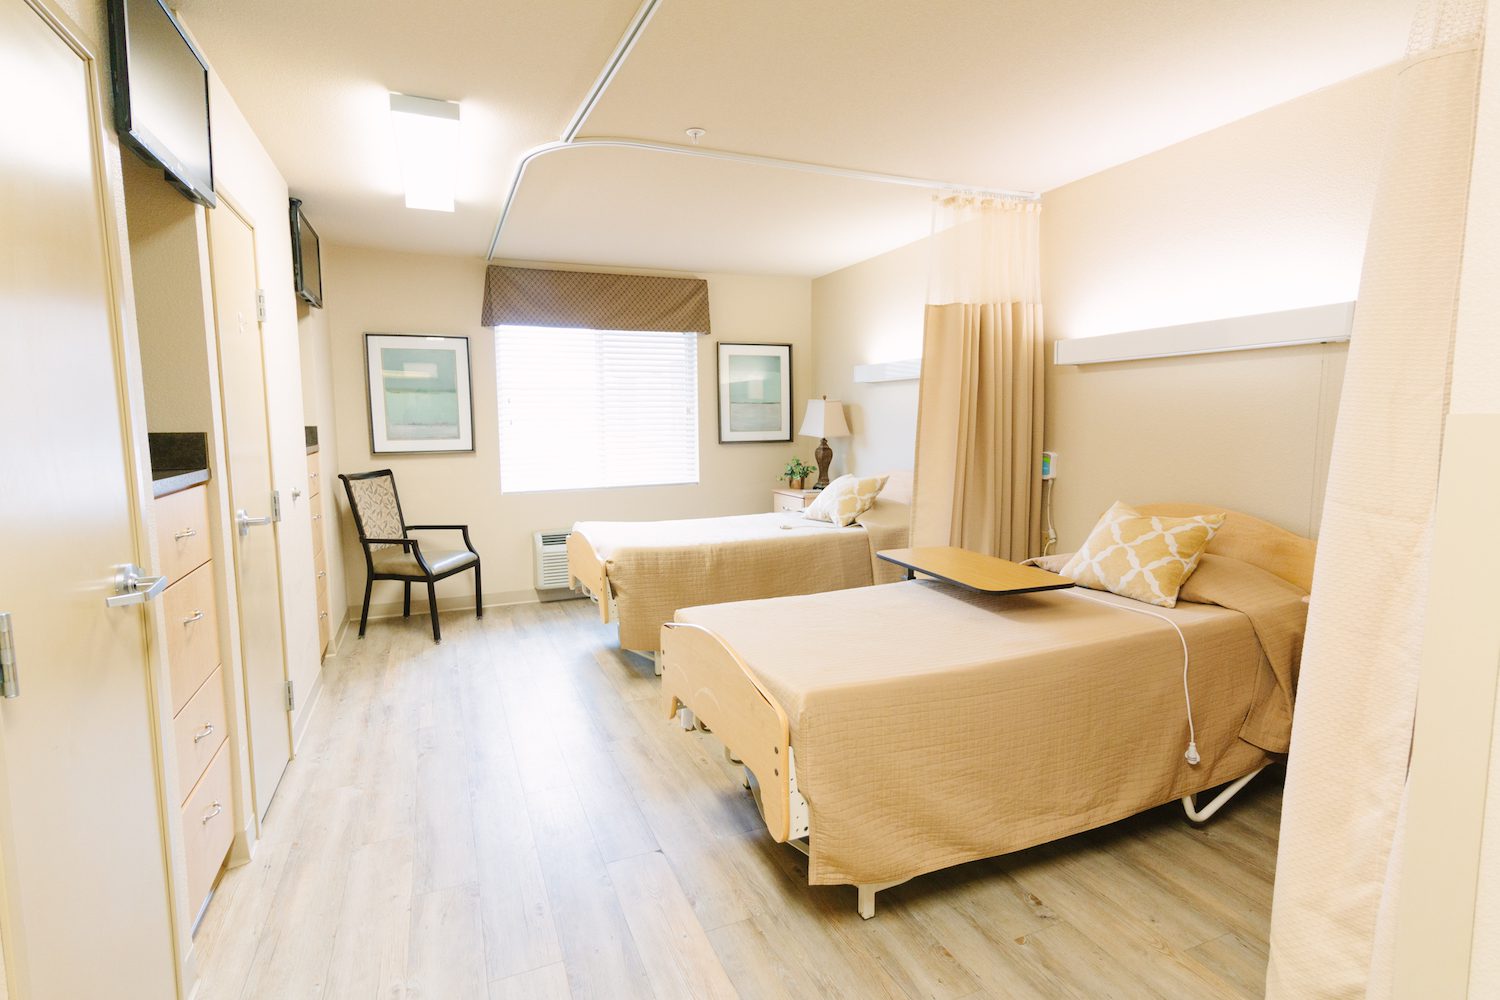
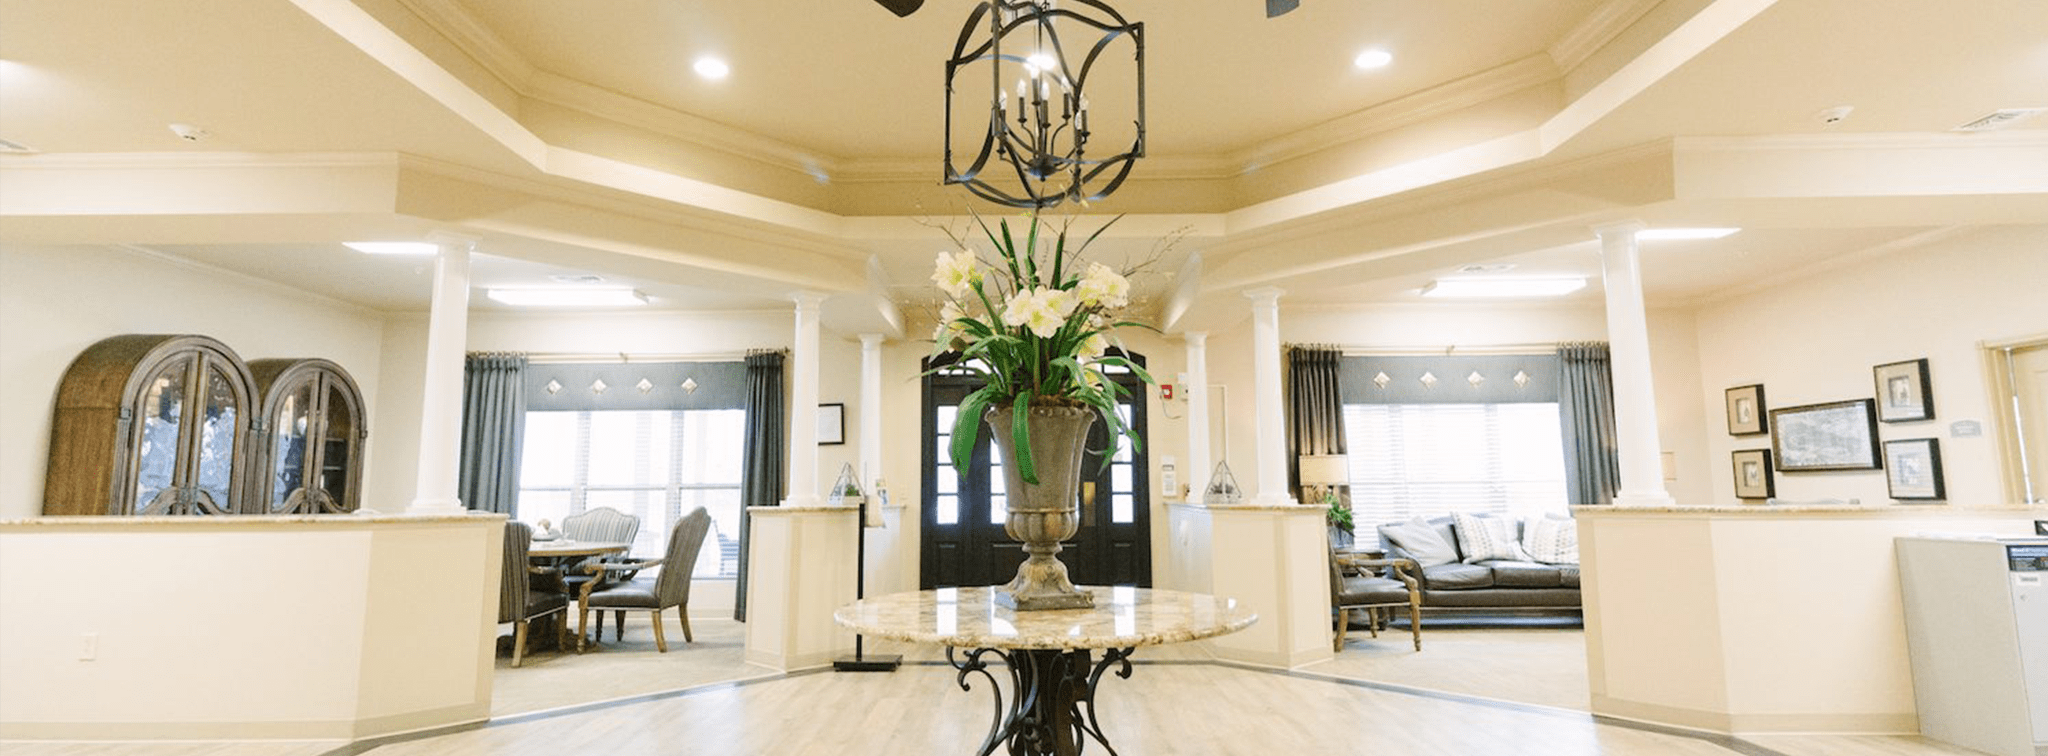
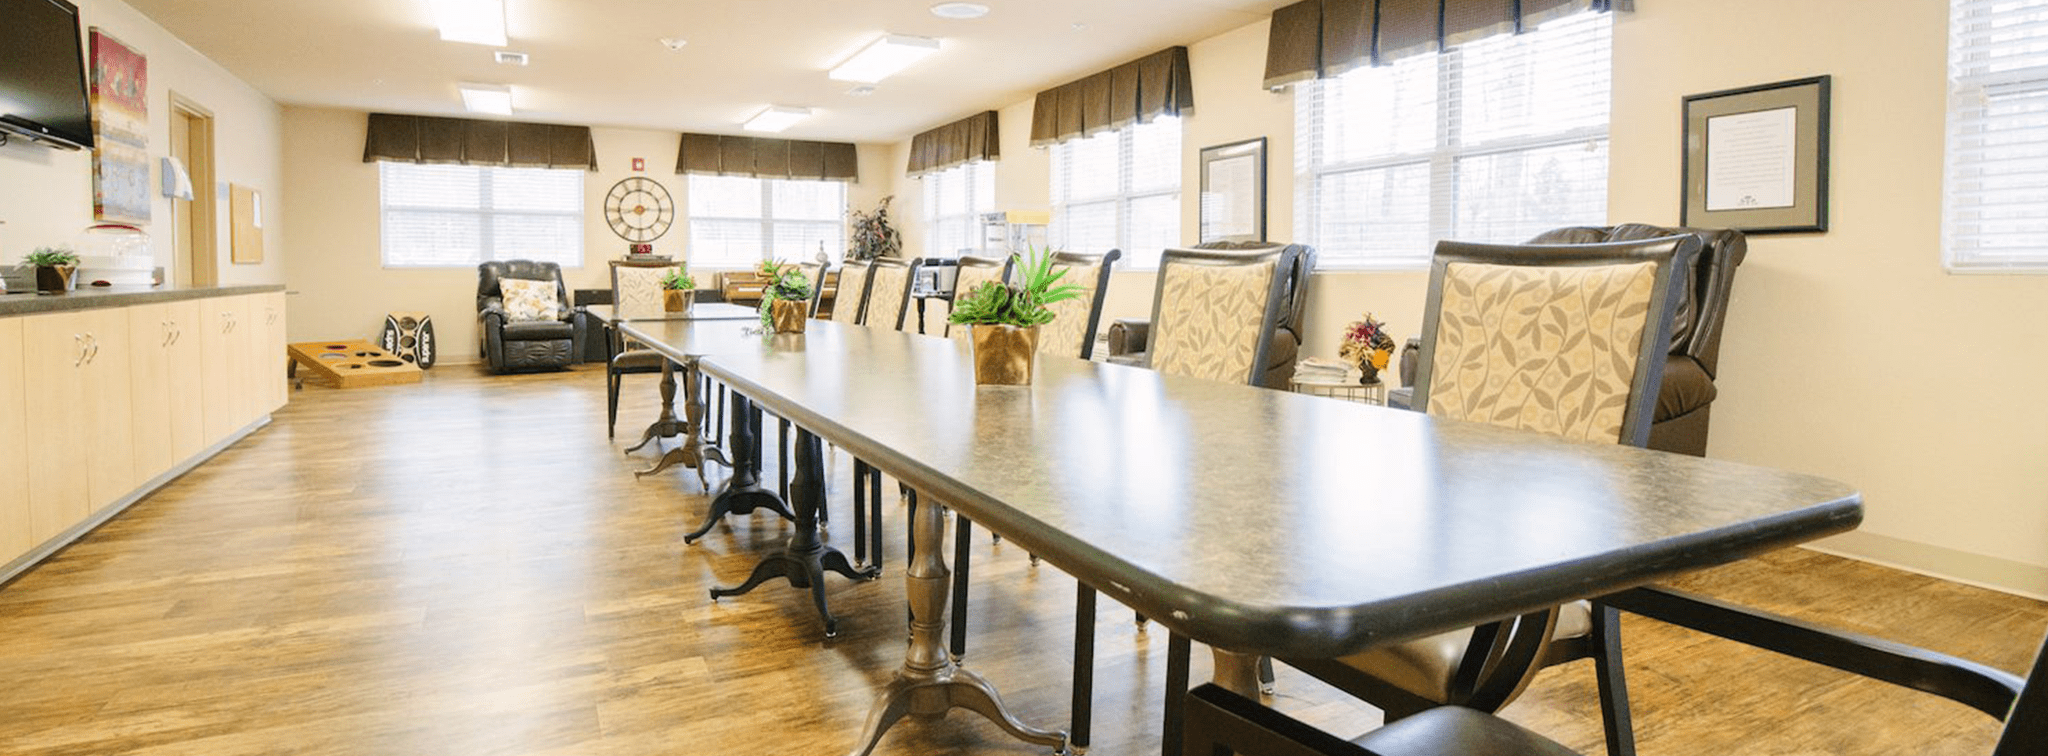
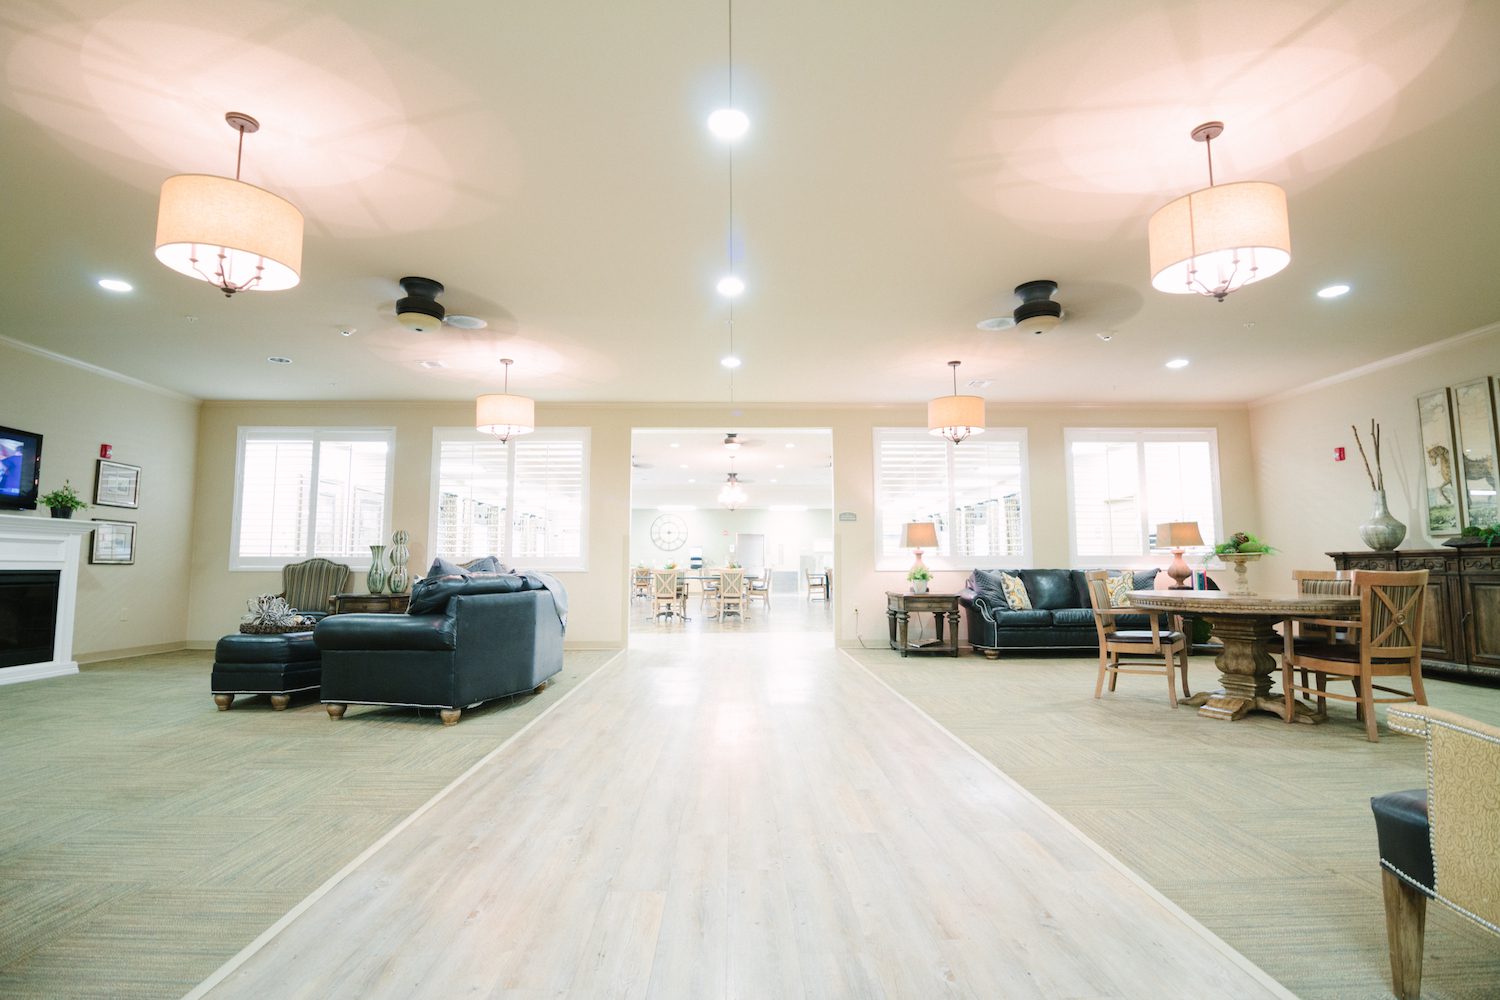
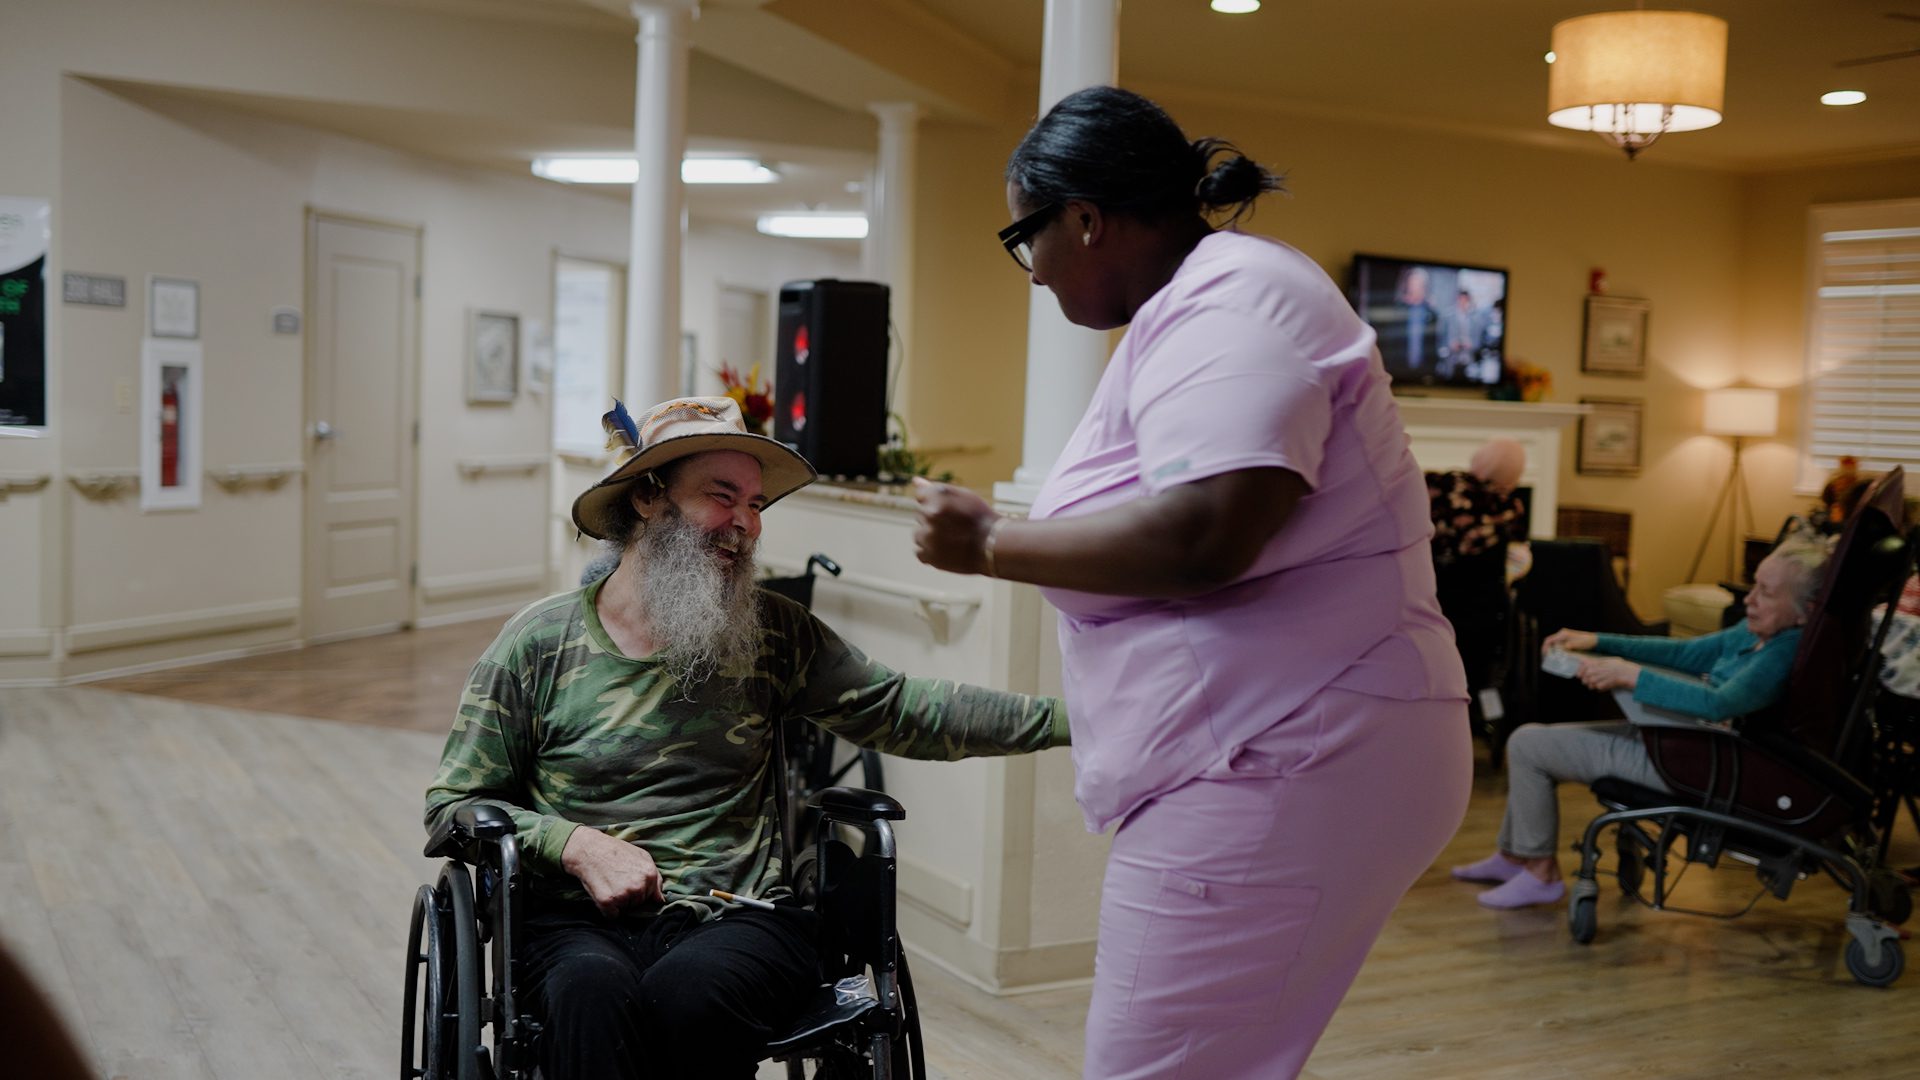
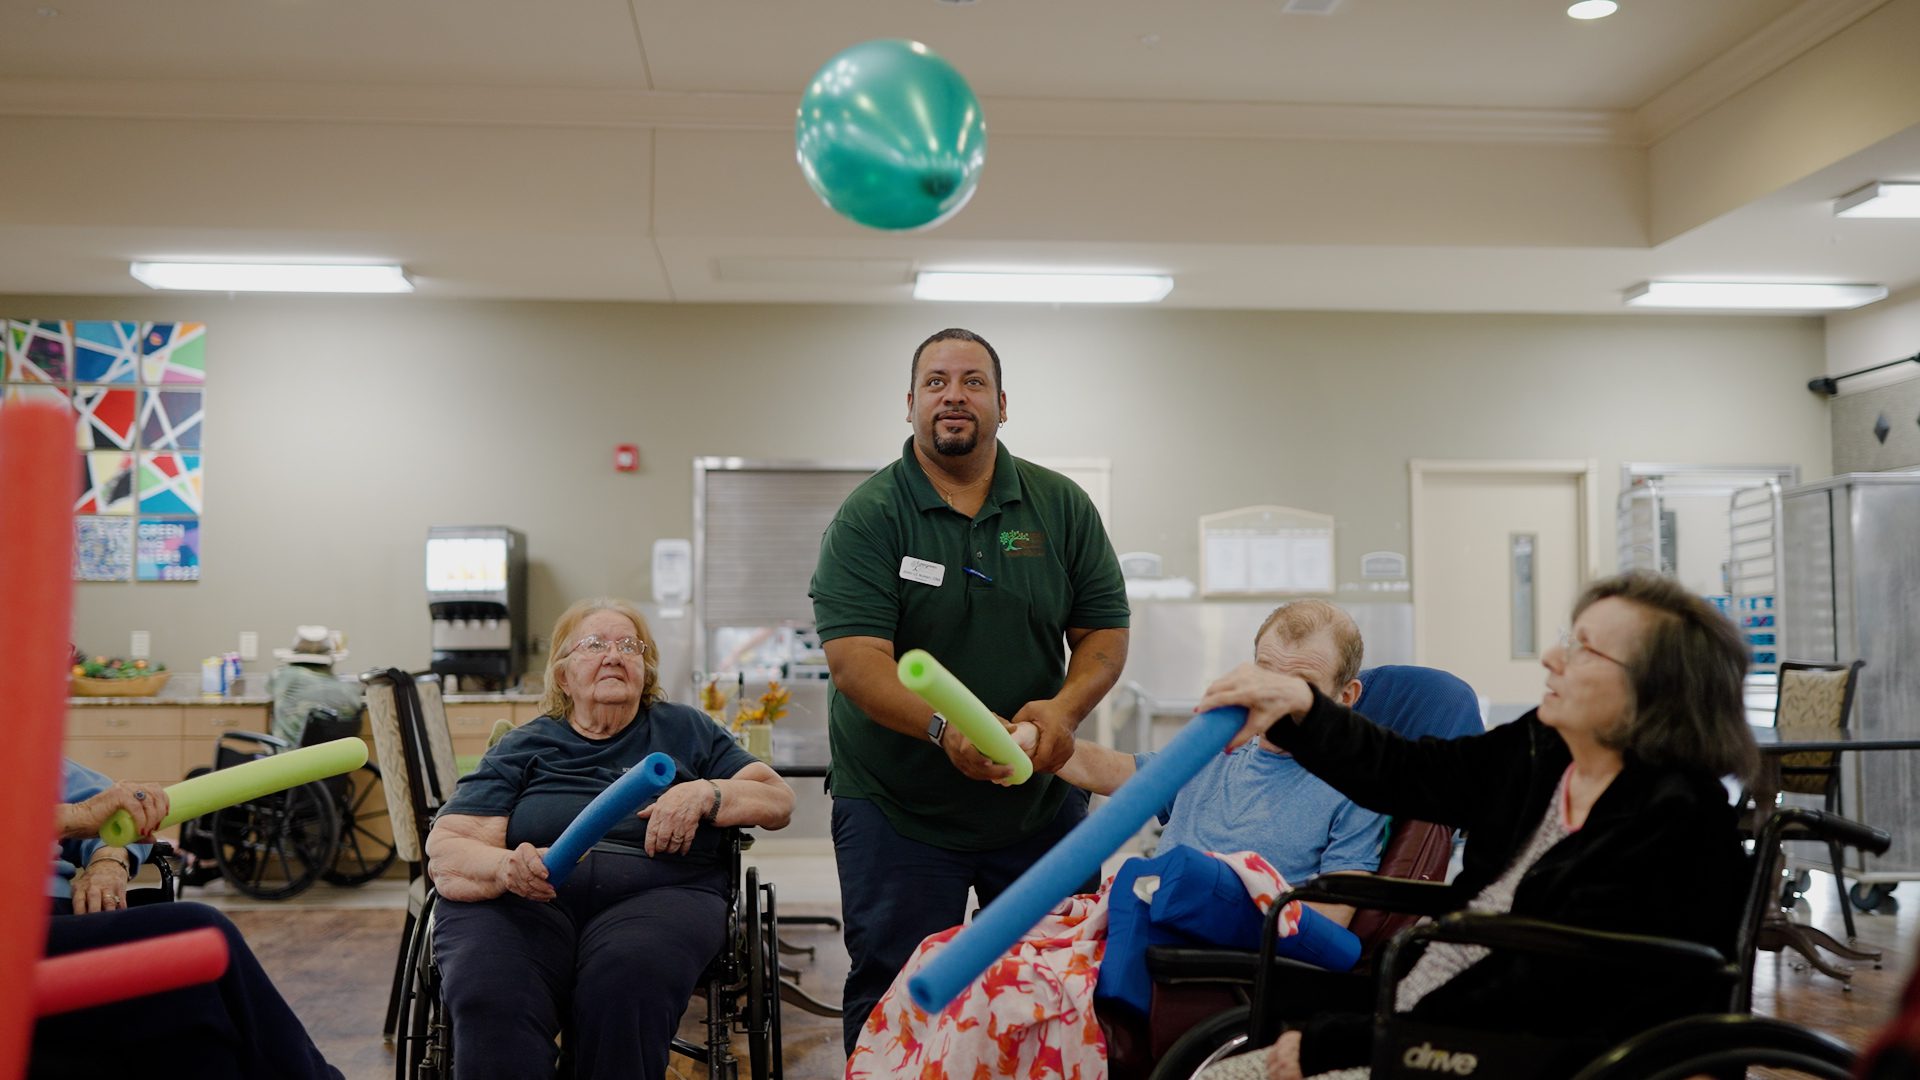
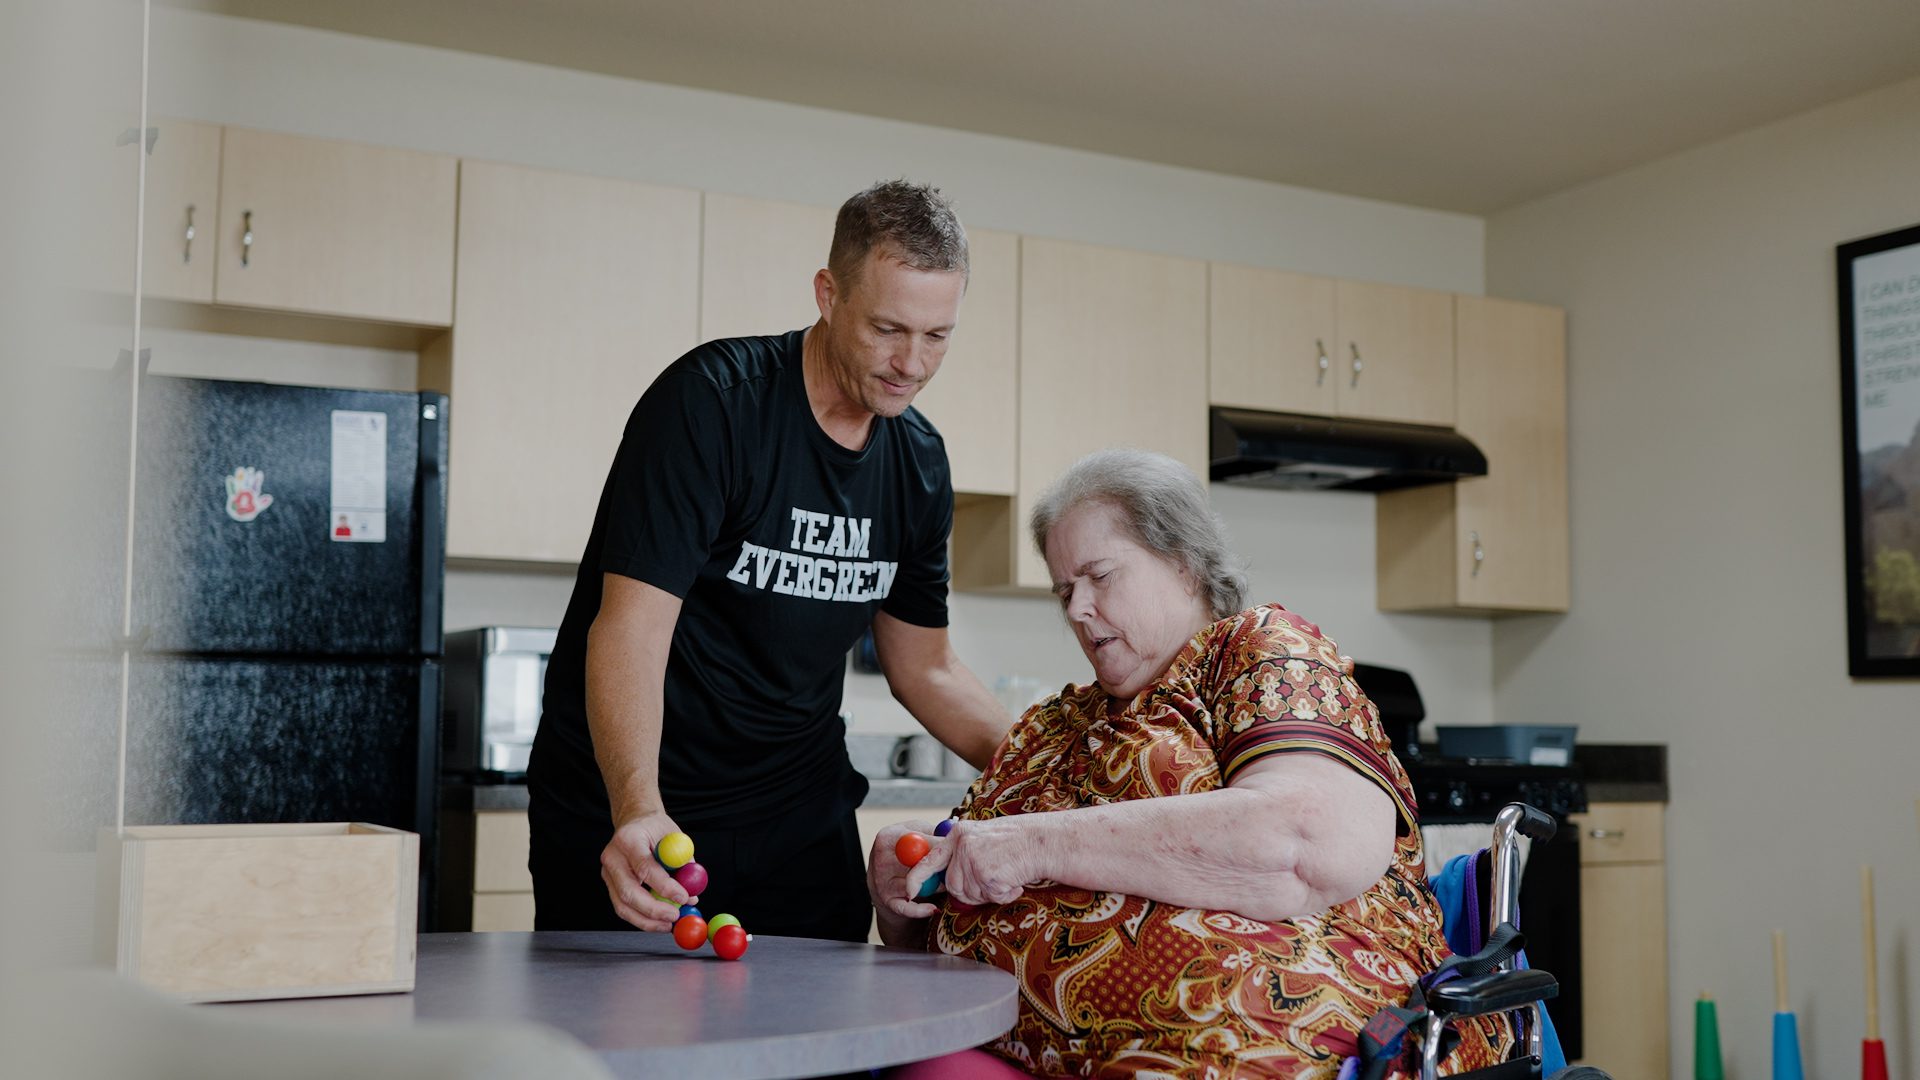
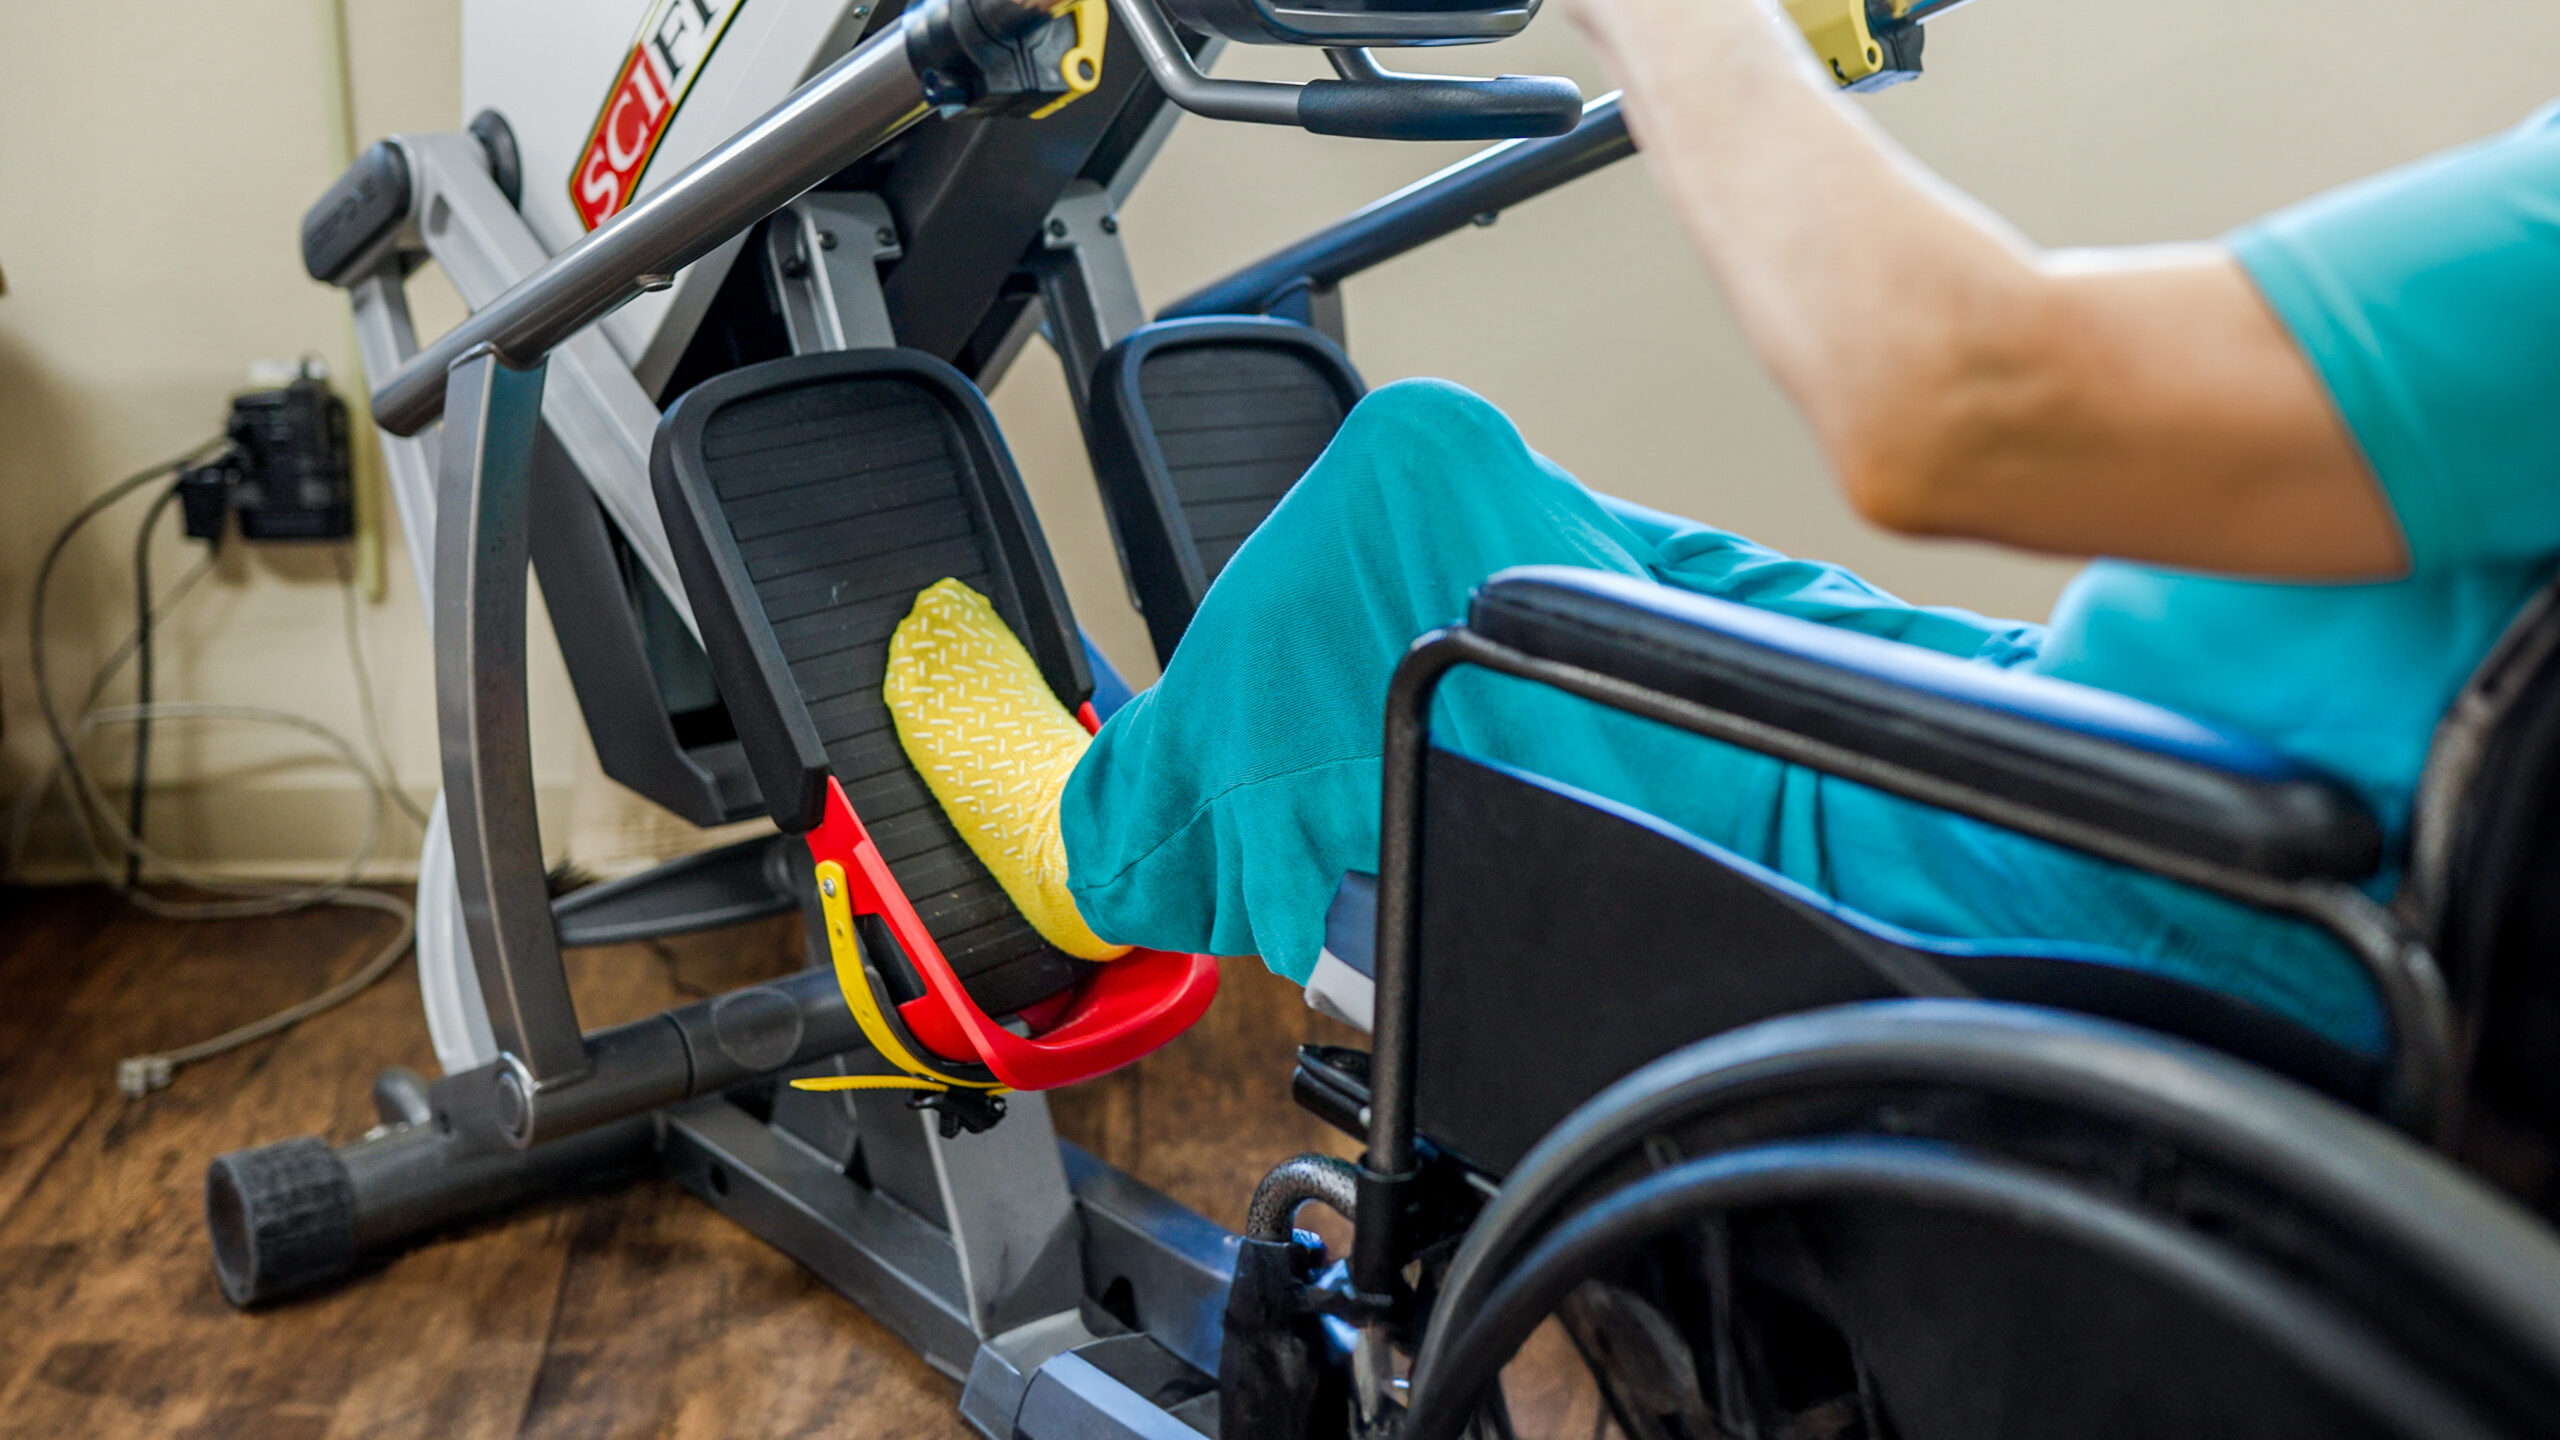
Residents also have access to amenities, including a full-size therapy gym for rehabilitation work and a communal dining space and activity area for socializing. The facility also has an outdoor courtyard and salon services. Daily activities are scheduled to keep seniors entertained and provide more ways to socialize within the community.

The facility has a Walk Score of 34, so the surrounding area is somewhat walkable. Family members nearby can reach some essential services on foot, but most visits require driving.

Quality ratings

Measured by Centers for Medicare & Medicaid Services (CMS)

Overall rating Info The Overall CMS Rating combines results from health inspections, staffing levels and quality measures. Health inspections carry the most weight. Staffing and quality scores can increase or decrease the final rating based on performance compared to state and national standards.
Health Inspection Info Based on the results of the facility's three most recent standard inspections and any complaint investigations. CMS reviews the number, scope, and severity of deficiencies, with more recent findings weighted more heavily.
Staffing Info Measures average nursing staff hours per resident per day, including Registered Nurses (RNs) and total nursing staff. Ratings are adjusted based on the level of care residents require and are compared to state and national benchmarks.
Quality Measures Info Based on clinical and physical health indicators reported to CMS, such as hospital readmissions, falls, pressure ulcers, and improvements in mobility. These measures reflect how well residents' health needs are being managed.

Staffing hours breakdown

Info Daily nursing hours per resident by staff type, reported to CMS. Higher is generally better — compare this facility to state and national averages to see where staffing stands.

Hours per resident per day — compared to state averages

Total nursing care / resident Info Total adjusted nursing hours per resident per day, combining RN, LPN, and aide time. CMS adjusts this for case-mix so facilities can be fairly compared.
4h 37m per day
vs avg

2 of 6 metrics below state avg

Standout metric Weekend Total Nursing is +4% above state avg
Staff typeHours / Day / Residentvs state avg
Registered Nurse (RN) Info RNs hold the highest nursing license and can assess residents, interpret test results, and direct care plans. More RN hours per day often signals stronger clinical oversight and faster response to health changes. 21m per day ▼ 12% State avg: 24m per day · National avg: 41m per day
LPN / LVN Info Licensed Practical Nurses (LPNs) or Licensed Vocational Nurses (LVNs) deliver routine hands-on care — medication administration, wound dressing, and monitoring vital signs. They work under RN supervision and make up a large share of daily bedside care. 59m per day ▲ 3% State avg: 57m per day · National avg: 52m per day
Nurse Aide Info Certified Nurse Aides (CNAs) provide the most direct day-to-day assistance: bathing, dressing, feeding, and mobility. Nurse aide hours are typically the largest staffing category and directly affect residents' quality of life. 2h 48m per day ▲ 3% State avg: 2h 43m per day · National avg: 2h 20m per day
Weekend Total Nursing Info Combined nursing hours (RN + LPN + Nurse Aide) per resident per day on weekends. Staffing often drops on weekends — this figure reveals whether the facility maintains adequate coverage outside of weekday hours. 3h 38m per day ▲ 4% State avg: 3h 29m per day · National avg: 3h 26m per day
Physical Therapist Info Hours per resident per day provided by licensed Physical Therapists (PTs) or PT Assistants. PT services help residents recover mobility after injury or illness and are especially important for post-acute (short-stay) rehabilitation. 1m per day ▼ 68% State avg: 2m per day · National avg: 4m per day
Weekend RN Info Registered nurse hours specifically on weekends. Facilities sometimes reduce RN presence on Saturdays and Sundays — a low weekend RN figure compared to weekday hours can indicate reduced clinical oversight when most administrative staff are absent. 16m per day ■ Avg State avg: 16m per day · National avg: 28m per day

Capacity and availability

Avg. Length of Stay Info Average number of days residents stay at this facility, based on CMS cost report data. Shorter stays often reflect post-acute or rehab care; longer stays reflect long-term care.
232 days
Bed community size
116-bed community Rank #79 / 330Bed count — State benchmarkedThis home is ranked 79th out of 330 homes in Arkansas. Shows this facility's certified or reported bed count compared to other Arkansas facilities. Larger communities may offer more amenities, programs, and on-site services for residents and families.Rankings are based only on facilities in Arkansas that report data for that category. Facilities without available data are excluded from the ranking.Click the rank badge to see the full State ranking.Click here to see the full State ranking.
A larger shared setting that may offer more common spaces and organized community services.
Walk Score
Walk Score: 34 / 100 Rank #203 / 419Walk Score — State benchmarkedThis home is ranked 203rd out of 419 homes in Arkansas. Shows how walkable this facility's neighborhood is compared to the average Walk Score across Arkansas facilities. Higher scores benefit residents, families, and staff.Rankings are based only on facilities in Arkansas that report data for that category. Facilities without available data are excluded from the ranking.Click the rank badge to see the full State ranking.Click here to see the full State ranking.
Somewhat walkable. A few nearby services may be reachable on foot, but most trips require transportation.

About this community

Occupancy

Occupancy rate
84%
Higher than the Arkansas average: 71.3%
Occupied beds
98 / 116
Average occupied beds in Arkansas homes 77 beds

License Details

Facility TypeSkilled Nursing Facility With Dual Certified Beds (medicaid / Medicare)
CountySaline
CMS Certification Number045457

Ownership & Operating Entity

Evergreen Living Center at Stagecoach is legally operated by Salco NC, Inc., and administered by Becky Baker.

Owner NameSalco Nc, Inc
Profit StatusFor-profit

Type Of Units

Medicaid and Medicare
116 units
Total beds
116 units

Therapy & Rehabilitation

2 services
Rehabilitation Services
Respite Care

Staffing & Medical

1 service
24-Hour Staffing

Contact Information

Fax501-213-0553

Amenities & Lifestyle

Communal Dining Space
Activity Area
Outdoor Courtyard
Therapy Gym
Salon Services
Activities
Specific ProgramsShort-Term Rehab, Additional Services

Contact Evergreen Living Center at Stagecoach

Inspection History

In Arkansas, the Department of Human Services, Office of Long Term Care is authorized to conduct unannounced inspections and issue official quality of care reports for all senior living providers.

Since 2022 · 4 years of data 21 deficiencies

Inspection Scorecard Info This scorecard compares key inspection, deficiency, and complaint metrics at this facility against the Arkansas state average. Metrics rated ≥15% worse than average are highlighted in red; those ≥15% better are highlighted in green.

Since 2022 vs. Arkansas state average
Overall vs. AR average 0 Worse No metrics in this bucket. 2 At Avg Metrics at Arkansas average:
• Total deficiencies (at AR avg)
• Deficiencies per year (at AR avg)
0 Better No metrics in this bucket.
Latest Inspection January 31, 2025 Complaint Investigation

Deficiencies Info Deficiencies are formal regulatory issues recorded during state inspections.

This FacilityAR Averagevs. AR Avg
Total deficiencies Info Formal regulatory issues recorded by inspectors across all inspection types. 2121 This facility has total deficiencies in line with the Arkansas average (21 vs. AR avg 21).— At avg
Deficiencies per year Info Average deficiencies per year since 2022. 5.35.3 This facility has deficiencies per year in line with the Arkansas average (5.3 vs. AR avg 5.3).— At avg

Inspection Reports Summary Info An editor-reviewed summary of the themes and findings across this facility's recent inspection reports.

  • January 31, 2025 complaint investigation found staff failed to follow a two-person mechanical lift plan, causing a resident’s femur fracture; CNA acted alone due to short staffing and was suspended.
  • January 31, 2025 routine inspection cited two deficiencies for incomplete hospice care planning and failure to post daily nurse staffing information clearly. [−] January 12, 2024 routine survey identified 10 deficiencies including poor infection control, unsafe food handling, unsecured hazardous areas, and incomplete mental health care plans.

Health Inspection History

Inspections since 2022
Total health inspections 5

State average N/A


Last Health inspection on Jan 2025

Total health citations
24

State average N/A

Citations per inspection
4.8

State average N/A


Health citations are formal notices following inspections when they fail to comply with safety and care standards.

20 of 24 citations resulted from standard inspections; and 4 of 24 resulted from complaint investigations.

Breakdown of citation severity (last 4 years)
Critical health citations
0
In line with State average

State average: N/A


Serious health citations
0
In line with State average

State average: N/A

0 critical citations State average: N/A

0 serious citations State average: N/A

24 moderate citations State average: N/A

0 minor citations State average: N/A
Citations history (last 4 years)
Nursing Services moderate citation Jan 31, 2025
Corrected

Quality of Care moderate citation Jan 31, 2025
Corrected

Care Planning moderate citation Jan 31, 2025
Corrected

Infection Control moderate citation Jan 12, 2024
Corrected

Staffing Data

Reporting period: October 1 – December 31, 2025 (Q4 2025). Source: CMS Payroll-Based Journal report.

Total staff 138
Employees 116
Contractors 22
Staff to resident ratio 1.39 : 1
0% compared with State average

State average ratio: 0 : 0

Avg staff/day 56
Average shift 7.7 hours
0% compared with State average

State average: 0 hours

Total staff hours (quarter) 39,782

Nursing staff breakdown

Q4 2025 · Oct 1 – Dec 31 More info This data comes from the CMS Payroll-Based Journal report covering October 1 – December 31, 2025.
Registered Nurse

Manages medical care and health needs.

RN Staff Info All 6 RN Staff are full-time employees. No contractors work on this role. 6
Average shift length Info Average shift length. Calculated as total hours divided by days worked and average staff per day. 9.2 hours
Licensed Practical Nurse

Assists with medical care and medications.

LPN Staff Info All 17 LPN Staff are full-time employees. No contractors work on this role. 17
Average shift length Info Average shift length. Calculated as total hours divided by days worked and average staff per day. 9.7 hours
Certified Nursing Assistant

Helps with daily care and mobility.

CNA Staff Info All 78 CNA Staff are full-time employees. No contractors work on this role. 78
Average shift length Info Average shift length. Calculated as total hours divided by days worked and average staff per day. 7.5 hours

Contractor staffing

Q4 2025 · Oct 1 – Dec 31 More info This data comes from the CMS Payroll-Based Journal report covering October 1 – December 31, 2025.

Total hours from contractors

4.1%

1,645 contractor hours this quarter

Speech Language Pathologist: 5 Clinical Nurse Specialist: 4 Qualified Social Worker: 4 Respiratory Therapy Technician: 3 Physical Therapy Aide: 3 Physical Therapy Assistant: 3

Staff by category

Q4 2025 · Oct 1 – Dec 31 More info This data comes from the CMS Payroll-Based Journal report covering October 1 – December 31, 2025.
Certified Nursing Assistant7807823,73792100%7.5
Licensed Practical Nurse170176,87092100%9.7
RN Director of Nursing4041,8457076%8.2
Clinical Nurse Specialist4481,3438087%7
Registered Nurse6061,2988188%9.2
Medication Aide/Technician2021,07192100%7.7
Other Dietary Services Staff1015546267%8.9
Speech Language Pathologist0555256975%7
Administrator1015046368%8
Nurse Practitioner1014886166%8
Physical Therapy Aide0334836065%7.4
Dental Services Staff1014726065%7.9
Qualified Social Worker0442316368%3.7
Physical Therapy Assistant0331575560%2.7
Nurse Aide in Training1011101718%6.4
Respiratory Therapy Technician033945661%1.6
78 Certified Nursing Assistant
% of Days 100%
17 Licensed Practical Nurse
% of Days 100%
4 RN Director of Nursing
% of Days 76%
8 Clinical Nurse Specialist
% of Days 87%
6 Registered Nurse
% of Days 88%
2 Medication Aide/Technician
% of Days 100%
1 Other Dietary Services Staff
% of Days 67%
5 Speech Language Pathologist
% of Days 75%
1 Administrator
% of Days 68%
1 Nurse Practitioner
% of Days 66%
3 Physical Therapy Aide
% of Days 65%
1 Dental Services Staff
% of Days 65%
4 Qualified Social Worker
% of Days 68%
3 Physical Therapy Assistant
% of Days 60%
1 Nurse Aide in Training
% of Days 18%
3 Respiratory Therapy Technician
% of Days 61%

Penalties and fines

Federal penalties imposed by CMS for regulatory violations, including civil money penalties (fines) and denials of payment for new Medicare/Medicaid admissions.

Source: CMS Penalties Database

No penalties in the past 3 years

No civil money penalties or payment denials were reported in the last 3 years.

Quality of care over time

These measures show how residents usually do over time at this home, based on health outcomes and preventive care.

High-risk clinical events score Info A composite score based on pressure ulcers, falls with injury, weight loss, walking ability decline, and activities of daily living decline. 8.8
14% worse than State average

State average: 7.7

Functional decline score Info A composite score based on activities of daily living decline, walking ability decline, and incontinence. 16.7
25% worse than State average

State average: 13.3

Long-stay resident measures
Above average State avg: 4.2 Info CMS star rating based on long-stay quality measure performance. 5 stars = significantly above average, 1 star = significantly below average.
Need for Help with Daily Activities Increased Info Percent of long-stay residents whose need for help with daily activities has increased 13.4%
16% worse than State average

State average: 11.5%

Walking Ability Worsened Info Percent of long-stay residents whose ability to move independently worsened 18.0%
35% worse than State average

State average: 13.4%

Low Risk Residents with Bowel/Bladder Incontinence Info Percent of low risk long-stay residents who lose control of their bowels or bladder 18.6%
23% worse than State average

State average: 15.1%

Falls with Major Injury Info Percent of long-stay residents experiencing one or more falls with major injury 3.6%
8% better than State average

State average: 3.9%

High Risk Residents with Pressure Ulcers Info Percent of long-stay high risk residents with pressure ulcers 3.1%
34% better than State average

State average: 4.7%

Urinary Tract Infection Info Percent of long-stay residents with a urinary tract infection 2.4%
89% worse than State average

State average: 1.3%

Lost Too Much Weight Info Percent of long-stay residents who lose too much weight 5.7%
14% worse than State average

State average: 5.0%

Depressive Symptoms Info Percent of long-stay residents who have depressive symptoms 0.0%
100% better than State average

State average: 1.5%

Antipsychotic Use Info Percent of long-stay residents who received an antipsychotic medication 3.1%
70% better than State average

State average: 10.5%

Pneumococcal Vaccine Info Percent of long-stay residents assessed and appropriately given the pneumococcal vaccine 98.2%
In line with State average

State average: 94.4%

Influenza Vaccine Info Percent of long-stay residents assessed and appropriately given the seasonal influenza vaccine 97.9%
In line with State average

State average: 96.2%

Hospitalizations per 1,000 days Info Number of hospitalizations per 1,000 long-stay resident days. 2.49
26% worse than State average

State average: 1.97

ED visits per 1,000 days Info Number of outpatient emergency department visits per 1,000 long-stay resident days. 2.31
6% worse than State average

State average: 2.18

Short-stay resident measures
Above average State avg: 2.7 Info CMS star rating based on short-stay quality measure performance. 5 stars = much above average, 1 star = much below average.
Pneumococcal Vaccine Info Percent of short-stay residents assessed and appropriately given the pneumococcal vaccine 77.9%
In line with State average

State average: 80.9%

Antipsychotic medication increase Info Percent of short-stay residents who newly received an antipsychotic medication 0.0%
100% better than State average

State average: 1.5%

Influenza Vaccine Info Percent of short-stay residents assessed and appropriately given the seasonal influenza vaccine 79.6%
In line with State average

State average: 77.7%

Re-hospitalized after SNF stay Info Percentage of short-stay residents who were re-hospitalized after their nursing home admission. 33.6%
33% worse than State average

State average: 25.2%

Emergency department visits Info Percentage of short-stay residents who had an outpatient emergency department visit. 12.3%
11% better than State average

State average: 13.8%

Falls with major injury Info Percentage of SNF residents who experience falls with major injury during their stay. 1.6%
106% worse than State average

State average: 0.8%

Ability to care for self at discharge Info Percentage of residents at or above expected ability to care for themselves at discharge. 56.1%
In line with State average

State average: 53.7%

Successful return to home or community Info Rate of successful return to home or community from a skilled nursing facility. 43.8%
13% worse than State average

State average: 50.6%

Breakdown by payment type

Medicare

30% of new residents, usually for short-term rehab.

Typical stay 1 - 2 months

Private pay

65% of new residents, often for short stays.

Typical stay 2 - 3 months

Medicaid

5% of new residents, often for long-term daily care.

Typical stay 9 years

Facility Characteristics

Source: CMS Long-Term Care Facility Characteristics (Data as of Jan 2026)

Total residents 99
Medicare
5
5.1% of residents
Medicaid
52
52.5% of residents
Private pay or other
42
42.4% of residents
Programs & Services
Residents Group

Residents meet regularly to discuss policies, care quality, and activities

Active Resident Council

Organized group of residents that meets regularly to discuss facility policies, quality of life, and activities.

Finances and operations

Based on CMS SNF Cost Report for fiscal year ending in 12/2023.

For-profit
Corporation
Net patient revenue Info Net patient revenue — what the home actually collects for resident care, after contractual allowances, bad debt and discounts are subtracted from its gross charges (CMS cost report, Worksheet G-3). It covers resident care only; money the home earns from other sources is shown separately as "Other income."
$10.4M
Net patient income Info Net patient income: net patient revenue minus the home's total operating expenses. A positive figure means it earns more from resident care than it spends to deliver it; a negative figure means the opposite. It excludes non-operating "other income."
$820.4K
For-profit Corporation
Net patient revenue Info Net patient revenue — what the home actually collects for resident care, after contractual allowances, bad debt and discounts are subtracted from its gross charges (CMS cost report, Worksheet G-3). It covers resident care only; money the home earns from other sources is shown separately as "Other income."
$10.4M
Net patient income Info Net patient income: net patient revenue minus the home's total operating expenses. A positive figure means it earns more from resident care than it spends to deliver it; a negative figure means the opposite. It excludes non-operating "other income."
$820.4K
Other income Info Money the home earns outside of resident care — such as investments, grants, rentals and other non-operating sources (CMS cost report, Worksheet G-3). It is tracked separately from net patient revenue: it is not part of that figure, and it is not included in net patient income.
$9.8K
Payroll costs Info Staff salaries plus wage-related costs — benefits such as payroll taxes, health insurance and retirement — from the home's own accounting records (CMS cost report, Worksheet A). Contract or agency labor is counted separately, under other operating costs.
$4.4M 42.3% of net patient revenue Info Payroll as a share of revenue: staff salaries and wage-related benefits divided by net patient revenue. A higher figure means more of each revenue dollar goes to staff pay.
Other operating costs Info Everything it costs to run the home apart from payroll — food, utilities, supplies, maintenance, contract labor and administration. Calculated as total operating expense minus payroll (staff salaries and wage-related benefits).
$5.2M
Total costs Info The home's total operating expense for the year — all the costs of running it, salaries included (CMS cost report, Worksheet G-3).
$9.6M

Who this home usually serves

TYPE OF STAY

Primarily short stays

Residents typically stay for brief periods, with frequent admissions and discharges throughout the year.

Most new residents arrive under private pay (65% of admissions), and a typical private pay stay runs around 2 - 3 months.

Admissions
145 total

Coverage residents most often arrive under.

Medicare 30%
Private pay 65%
Medicaid 5%
Discharges
141 total

Coverage residents most often leave under.

Medicare 28%
Private pay 62%
Medicaid 10%

Places of interest near Evergreen Living Center at Stagecoach

Address 1.5 miles from city center Info Estimated distance in miles from Bryant's city center to Evergreen Living Center at Stagecoach's address, calculated via Google Maps.

Calculate Travel Distance to Evergreen Living Center at Stagecoach

Add your location

Address

Compare Nursing Homes around the area

The information below is reported by the Arkansas Department of Human Services, Office of Long Term Care.

Indian Rock Village
NH
Fairfield Bay -55 - 11 Studio / 1 Bed / 2 Bed
Bear Creek Healthcare LLC
NH
De Queen -131 - 35 -
Heartland Rehabilitation and Care Center
NH
RC
SNF
Benton -119 A+ 0 -
Evergreen Living Center at Stagecoach
NH
MC
RC
SNF
Bryant -116 - 34 -
Barnes Healthcare
NH
MC
Lonoke -141 A+ 38 Private / Shared Rooms

Frequently Asked Questions about Evergreen Living Center at Stagecoach

Who is the owner of Evergreen Living Center at Stagecoach?

Evergreen Living Center at Stagecoach is legally operated by Salco NC, Inc., and administered by Becky Baker.

Is Evergreen Living Center at Stagecoach in a walkable area?

Evergreen Living Center at Stagecoach has a walk score of 34. Somewhat walkable. A few nearby services may be reachable on foot, but most trips require transportation.

What is the occupancy rate at Evergreen Living Center at Stagecoach?

Evergreen Living Center at Stagecoach's occupancy is 84%.

Does Evergreen Living Center at Stagecoach operate as a for-profit or non-profit?

Evergreen Living Center at Stagecoach is registered as a for-profit in AR.

Who is the administrator of Evergreen Living Center at Stagecoach?

Becky Baker is the administrator of Evergreen Living Center at Stagecoach.

How many beds does Evergreen Living Center at Stagecoach have?

Evergreen Living Center at Stagecoach has 116 beds.

Are there photos of Evergreen Living Center at Stagecoach?

Yes — there are 19 photos of Evergreen Living Center at Stagecoach in the photo gallery on this page.

Guides for Better Senior Living

Care Cost Calculator: See Prices in Your Area

Nursing Home Data Explorer

Don’t Wait Too Long: 7 Red Flag Signs Your Parent Needs Assisted Living Now

The True Cost of Assisted Living in 2025 – And How Families Are Paying For It

Understanding Senior Living Costs: Pricing Models, Discounts & Financial Assistance