Bethel Home Inc
Nursing Home, Independent Living & Respite Care · Montezuma, KS
CMS overall rating Info CMS (the Centers for Medicare & Medicaid Services) is the federal agency that rates nursing home quality. Its Overall Rating runs from 1 to 5 stars, combining health inspections, staffing, and quality measures, with inspections weighted most heavily.

Bethel Home Inc

Nursing Home, Independent Living & Respite Care · Montezuma, KS
CMS overall rating Info CMS (the Centers for Medicare & Medicaid Services) is the federal agency that rates nursing home quality. Its Overall Rating runs from 1 to 5 stars, combining health inspections, staffing, and quality measures, with inspections weighted most heavily.
Calculator: See prices in your area
Bethel Home Inc accepts Medicare, Medicaid, and private pay.

Overview of Bethel Home INC

Bethel Home INC. is a church-owned Medicare nursing home located in Montezuma, Kansas. It provides skilled nursing, long-term care, and independent living services in a caring community. The facility emphasizes respect, individuality, and a Christian-based environment for its residents.

Quality ratings

Measured by Centers for Medicare & Medicaid Services (CMS)

Overall rating Info The Overall CMS Rating combines results from health inspections, staffing levels and quality measures. Health inspections carry the most weight. Staffing and quality scores can increase or decrease the final rating based on performance compared to state and national standards.
Health Inspection Info Based on the results of the facility's three most recent standard inspections and any complaint investigations. CMS reviews the number, scope, and severity of deficiencies, with more recent findings weighted more heavily.
Staffing Info Measures average nursing staff hours per resident per day, including Registered Nurses (RNs) and total nursing staff. Ratings are adjusted based on the level of care residents require and are compared to state and national benchmarks.
Quality Measures Info Based on clinical and physical health indicators reported to CMS, such as hospital readmissions, falls, pressure ulcers, and improvements in mobility. These measures reflect how well residents' health needs are being managed.

Staffing hours breakdown

Info Daily nursing hours per resident by staff type, reported to CMS. Higher is generally better — compare this facility to state and national averages to see where staffing stands.

Hours per resident per day — compared to state averages

Total nursing care / resident Info Total adjusted nursing hours per resident per day, combining RN, LPN, and aide time. CMS adjusts this for case-mix so facilities can be fairly compared.
5h 33m per day
vs avg

3 of 6 metrics below state avg

Standout metric Nurse Aide is +19% above state avg
Staff typeHours / Day / Residentvs state avg
Registered Nurse (RN) Info RNs hold the highest nursing license and can assess residents, interpret test results, and direct care plans. More RN hours per day often signals stronger clinical oversight and faster response to health changes. 31m per day ▼ 29% State avg: 43m per day · National avg: 41m per day
LPN / LVN Info Licensed Practical Nurses (LPNs) or Licensed Vocational Nurses (LVNs) deliver routine hands-on care — medication administration, wound dressing, and monitoring vital signs. They work under RN supervision and make up a large share of daily bedside care. 41m per day ■ Avg State avg: 40m per day · National avg: 52m per day
Nurse Aide Info Certified Nurse Aides (CNAs) provide the most direct day-to-day assistance: bathing, dressing, feeding, and mobility. Nurse aide hours are typically the largest staffing category and directly affect residents' quality of life. 3h 12m per day ▲ 19% State avg: 2h 41m per day · National avg: 2h 20m per day
Weekend Total Nursing Info Combined nursing hours (RN + LPN + Nurse Aide) per resident per day on weekends. Staffing often drops on weekends — this figure reveals whether the facility maintains adequate coverage outside of weekday hours. 3h 52m per day ▲ 8% State avg: 3h 35m per day · National avg: 3h 26m per day
Physical Therapist Info Hours per resident per day provided by licensed Physical Therapists (PTs) or PT Assistants. PT services help residents recover mobility after injury or illness and are especially important for post-acute (short-stay) rehabilitation. 1m per day ▼ 65% State avg: 2m per day · National avg: 4m per day
Weekend RN Info Registered nurse hours specifically on weekends. Facilities sometimes reduce RN presence on Saturdays and Sundays — a low weekend RN figure compared to weekday hours can indicate reduced clinical oversight when most administrative staff are absent. 13m per day ▼ 57% State avg: 30m per day · National avg: 28m per day

Capacity and availability

Avg. Length of Stay
819 days
Bed community size
56-bed community Rank #117 / 224Bed count — State benchmarkedThis home is ranked 117th out of 224 homes in Kansas. Shows this facility's certified or reported bed count compared to other Kansas facilities. Larger communities may offer more amenities, programs, and on-site services for residents and families.Rankings are based only on facilities in Kansas that report data for that category. Facilities without available data are excluded from the ranking.Click the rank badge to see the full State ranking.Click here to see the full State ranking.
A moderately sized community that may balance personal attention with shared amenities and social activities.
Walk Score
Walk Score: 30 / 100 Rank #260 / 363Walk Score — State benchmarkedThis home is ranked 260th out of 363 homes in Kansas. Shows how walkable this facility's neighborhood is compared to the average Walk Score across Kansas facilities. Higher scores benefit residents, families, and staff.Rankings are based only on facilities in Kansas that report data for that category. Facilities without available data are excluded from the ranking.Click the rank badge to see the full State ranking.Click here to see the full State ranking.
Somewhat walkable. A few nearby services may be reachable on foot, but most trips require transportation.

About this community

Occupancy

Occupancy rate
89%
Higher than the Kansas average: 79.5%
Occupied beds
50 / 56
Average occupied beds in Kansas homes 50 beds

License Details

Facility TypeNursing Facility
StatusActive
CountyGray
License Number175528
CMS Certification Number175528

Ownership & Operating Entity

Bethel Home Inc is administered by Brian Koehn.

Owner NameBethel Home

Staffing & Medical

1 service
24-Hour Staffing

Amenities & Lifestyle

24-Hour Coffee Shop
Home Cooked Style Meals
Gospel Singing
Gospel Service On Sunday Mornings
Religious Services

Contact Bethel Home Inc

Inspection History

In Kansas, the Department for Aging and Disability Services, Survey and Certification Commission performs the unannounced inspections required for facility licensing and federal certification.

Since 2012 · 14 years of data 82 deficiencies

Inspection Scorecard Info This scorecard compares key inspection, deficiency, and complaint metrics at this facility against the Kansas state average. Metrics rated ≥15% worse than average are highlighted in red; those ≥15% better are highlighted in green.

Since 2012 vs. Kansas state average
Overall vs. KS average 0 Worse No metrics in this bucket. 2 Better Metrics better than Kansas average:
• Total deficiencies (18% below)
• Deficiencies per year (17% below)
Latest Inspection February 6, 2025

Deficiencies Info Deficiencies are formal regulatory issues recorded during state inspections.

This FacilityKS Averagevs. KS Avg
Total deficiencies Info Formal regulatory issues recorded by inspectors across all inspection types. 82100 This facility has 18% fewer total deficiencies than a typical Kansas assisted living residence (82 vs. KS avg 100).↓ 18% better
Deficiencies per year Info Average deficiencies per year since 2012. 5.97.1 This facility has 17% fewer deficiencies per year than a typical Kansas assisted living residence (5.9 vs. KS avg 7.1).↓ 17% better

Inspection Reports Summary Info An editor-reviewed summary of the themes and findings across this facility's recent inspection reports.

  • The most recent inspection on March 31, 2025, found the facility in compliance with all regulations and no new deficiencies. Earlier inspections showed a pattern of deficiencies related mainly to care planning, wound and pressure ulcer management, accident hazard prevention, psychotropic medication monitoring, and infection control. A notable substantiated complaint investigation in August 2023 cited a failure to secure facility vehicles, which led to a resident elopement incident; the facility responded with staff education and safety measures. Prior reports did not list fines, immediate jeopardy findings, or license actions in the available records. The facility has demonstrated improvement over time by correcting all cited deficiencies from previous inspections.

Health Inspection History

Inspections since 2021
Total health inspections 4

State average N/A


Last Health inspection on Jan 2025

Total health citations
15

State average N/A

Citations per inspection
3.75

State average N/A


Health citations are formal notices following inspections when they fail to comply with safety and care standards.

14 of 15 citations resulted from standard inspections; and 1 of 15 resulted from complaint investigations.

Breakdown of citation severity (last 5 years)
Critical health citations
0
In line with State average

State average: N/A


Serious health citations
1
In line with State average

State average: N/A

0 critical citations State average: N/A

1 serious citation State average: N/A

14 moderate citations State average: N/A

0 minor citations State average: N/A
Citations history (last 5 years)
Infection Control moderate citation Jan 16, 2025
Corrected

Infection Control moderate citation Jan 16, 2025
Corrected

Pharmacy moderate citation Jan 16, 2025
Corrected

Quality of Care moderate citation Jan 16, 2025
Corrected

Staffing Data

Reporting period: October 1 – December 31, 2025 (Q4 2025). Source: CMS Payroll-Based Journal report.

Total staff 134
Employees 107
Contractors 27
Staff to resident ratio 2.68 : 1
0% compared with State average

State average ratio: 0 : 0

Avg staff/day 40
Average shift 7.4 hours
0% compared with State average

State average: 0 hours

Total staff hours (quarter) 27,409

Nursing staff breakdown

Q4 2025 · Oct 1 – Dec 31 More info This data comes from the CMS Payroll-Based Journal report covering October 1 – December 31, 2025.
Registered Nurse

Manages medical care and health needs.

RN Staff Info 9 total: 7 full-time employees and 2 contractors. 9
Average shift length Info Average shift length. Calculated as total hours divided by days worked and average staff per day. 8.8 hours
Licensed Practical Nurse

Assists with medical care and medications.

LPN Staff Info 9 total: 8 full-time employees and 1 contractor. 9
Average shift length Info Average shift length. Calculated as total hours divided by days worked and average staff per day. 8.5 hours
Certified Nursing Assistant

Helps with daily care and mobility.

CNA Staff Info 72 total: 67 full-time employees and 5 contractors. 72
Average shift length Info Average shift length. Calculated as total hours divided by days worked and average staff per day. 7.3 hours

Contractor staffing

Q4 2025 · Oct 1 – Dec 31 More info This data comes from the CMS Payroll-Based Journal report covering October 1 – December 31, 2025.

Total hours from contractors

5.3%

1,463 contractor hours this quarter

Certified Nursing Assistant: 5 Speech Language Pathologist: 5 Physical Therapy Aide: 3 Respiratory Therapy Technician: 3 Physical Therapy Assistant: 3 Registered Nurse: 2 Occupational Therapy Aide: 1 Licensed Practical Nurse: 1 Mental Health Service Worker: 1 Occupational Therapy Assistant: 1 Medical Director: 1 Qualified Social Worker: 1

Staff by category

Q4 2025 · Oct 1 – Dec 31 More info This data comes from the CMS Payroll-Based Journal report covering October 1 – December 31, 2025.
Certified Nursing Assistant6757213,15892100%7.3
Medication Aide/Technician110113,14192100%8
Licensed Practical Nurse8193,07492100%8.5
Registered Nurse7292,0988997%8.8
Therapeutic Recreation Specialist3031,0977379%7.9
Dental Services Staff2029347177%7.7
Other Dietary Services Staff5059166672%7.7
Occupational Therapy Aide1126787683%8.6
Administrator1015126470%8
Nurse Practitioner1015126470%8
RN Director of Nursing1013944953%8
Speech Language Pathologist0553806773%5.5
Physical Therapy Aide0333706267%6
Respiratory Therapy Technician033593437%1.5
Physical Therapy Assistant033332527%1.3
Occupational Therapy Assistant0112133%7
Medical Director0111622%8
Mental Health Service Worker0111267%2
Qualified Social Worker011433%1.4
72 Certified Nursing Assistant
% of Days 100%
11 Medication Aide/Technician
% of Days 100%
9 Licensed Practical Nurse
% of Days 100%
9 Registered Nurse
% of Days 97%
3 Therapeutic Recreation Specialist
% of Days 79%
2 Dental Services Staff
% of Days 77%
5 Other Dietary Services Staff
% of Days 72%
2 Occupational Therapy Aide
% of Days 83%
1 Administrator
% of Days 70%
1 Nurse Practitioner
% of Days 70%
1 RN Director of Nursing
% of Days 53%
5 Speech Language Pathologist
% of Days 73%
3 Physical Therapy Aide
% of Days 67%
3 Respiratory Therapy Technician
% of Days 37%
3 Physical Therapy Assistant
% of Days 27%
1 Occupational Therapy Assistant
% of Days 3%
1 Medical Director
% of Days 2%
1 Mental Health Service Worker
% of Days 7%
1 Qualified Social Worker
% of Days 3%

Penalties and fines

Federal penalties imposed by CMS for regulatory violations, including civil money penalties (fines) and denials of payment for new Medicare/Medicaid admissions.

Source: CMS Penalties Database

No penalties in the past 3 years

No civil money penalties or payment denials were reported in the last 3 years.

Quality of care over time

These measures show how residents usually do over time at this home, based on health outcomes and preventive care.

High-risk clinical events score Info A composite score based on pressure ulcers, falls with injury, weight loss, walking ability decline, and activities of daily living decline. 7.2
32% better than State average

State average: 10.5

Functional decline score Info A composite score based on activities of daily living decline, walking ability decline, and incontinence. 12.6
39% better than State average

State average: 20.7

Long-stay resident measures
Significantly above average State avg: 3.0 Info CMS star rating based on long-stay quality measure performance. 5 stars = significantly above average, 1 star = significantly below average.
Need for Help with Daily Activities Increased Info Percent of long-stay residents whose need for help with daily activities has increased 17.2%
9% better than State average

State average: 19.0%

Walking Ability Worsened Info Percent of long-stay residents whose ability to move independently worsened 9.0%
54% better than State average

State average: 19.4%

Low Risk Residents with Bowel/Bladder Incontinence Info Percent of low risk long-stay residents who lose control of their bowels or bladder 11.5%
52% better than State average

State average: 23.8%

Falls with Major Injury Info Percent of long-stay residents experiencing one or more falls with major injury 2.4%
46% better than State average

State average: 4.4%

High Risk Residents with Pressure Ulcers Info Percent of long-stay high risk residents with pressure ulcers 6.2%
33% worse than State average

State average: 4.6%

Urinary Tract Infection Info Percent of long-stay residents with a urinary tract infection 1.5%
53% better than State average

State average: 3.1%

Lost Too Much Weight Info Percent of long-stay residents who lose too much weight 1.0%
81% better than State average

State average: 5.1%

Depressive Symptoms Info Percent of long-stay residents who have depressive symptoms 0.0%
100% better than State average

State average: 5.2%

Antipsychotic Use Info Percent of long-stay residents who received an antipsychotic medication 10.5%
38% better than State average

State average: 16.9%

Pneumococcal Vaccine Info Percent of long-stay residents assessed and appropriately given the pneumococcal vaccine 99.5%
8% better than State average

State average: 91.9%

Influenza Vaccine Info Percent of long-stay residents assessed and appropriately given the seasonal influenza vaccine 94.6%
In line with State average

State average: 95.5%

Hospitalizations per 1,000 days Info Number of hospitalizations per 1,000 long-stay resident days. 1.08
41% better than State average

State average: 1.84

ED visits per 1,000 days Info Number of outpatient emergency department visits per 1,000 long-stay resident days. 1.79
17% better than State average

State average: 2.16

Short-stay resident measures
Pneumococcal Vaccine Info Percent of short-stay residents assessed and appropriately given the pneumococcal vaccine 81.8%
8% better than State average

State average: 75.6%

Breakdown by payment type

Medicare

12% of new residents, usually for short-term rehab.

Typical stay 4 - 5 months

Private pay

69% of new residents, often for short stays.

Typical stay 1 years

Medicaid

19% of new residents, often for long-term daily care.

Typical stay 6 - 7 years

Facility Characteristics

Source: CMS Long-Term Care Facility Characteristics (Data as of Jan 2026)

Total residents 50
Medicare
1
2% of residents
Medicaid
31
62% of residents
Private pay or other
18
36% of residents
Programs & Services
Residents Group

Residents meet regularly to discuss policies, care quality, and activities

Nurse Aide Training

State-approved Nurse Aide Training and Competency Evaluation Program on-site

CCRC

Part of a Continuing Care Retirement Community offering multiple care levels

Active Resident Council

Organized group of residents that meets regularly to discuss facility policies, quality of life, and activities.

Finances and operations

Based on CMS SNF Cost Report for fiscal year ending in 12/2023.

Nonprofit
Church Related
Net patient revenue Info Net patient revenue — what the home actually collects for resident care, after contractual allowances, bad debt and discounts are subtracted from its gross charges (CMS cost report, Worksheet G-3). It covers resident care only; money the home earns from other sources is shown separately as "Other income."
$5.9M
Net patient income Info Net patient income: net patient revenue minus the home's total operating expenses. A positive figure means it earns more from resident care than it spends to deliver it; a negative figure means the opposite. It excludes non-operating "other income."
-$618.5K
Nonprofit Church Related
Net patient revenue Info Net patient revenue — what the home actually collects for resident care, after contractual allowances, bad debt and discounts are subtracted from its gross charges (CMS cost report, Worksheet G-3). It covers resident care only; money the home earns from other sources is shown separately as "Other income."
$5.9M
Net patient income Info Net patient income: net patient revenue minus the home's total operating expenses. A positive figure means it earns more from resident care than it spends to deliver it; a negative figure means the opposite. It excludes non-operating "other income."
-$618.5K
Other income Info Money the home earns outside of resident care — such as investments, grants, rentals and other non-operating sources (CMS cost report, Worksheet G-3). It is tracked separately from net patient revenue: it is not part of that figure, and it is not included in net patient income.
$970.5K
Payroll costs Info Staff salaries plus wage-related costs — benefits such as payroll taxes, health insurance and retirement — from the home's own accounting records (CMS cost report, Worksheet A). Contract or agency labor is counted separately, under other operating costs.
$4.0M 68.9% of net patient revenue Info Payroll as a share of revenue: staff salaries and wage-related benefits divided by net patient revenue. A higher figure means more of each revenue dollar goes to staff pay.
Other operating costs Info Everything it costs to run the home apart from payroll — food, utilities, supplies, maintenance, contract labor and administration. Calculated as total operating expense minus payroll (staff salaries and wage-related benefits).
$2.4M
Total costs Info The home's total operating expense for the year — all the costs of running it, salaries included (CMS cost report, Worksheet G-3).
$6.5M

Who this home usually serves

TYPE OF STAY

Primarily long-term care, limited rehab

Most residents stay long-term, while a smaller portion are admitted for short-term rehab.

Most new residents arrive under private pay (69% of admissions), and a typical private pay stay runs around 1 years.

Admissions
26 total

Coverage residents most often arrive under.

Medicare 12%
Private pay 69%
Medicaid 19%
Discharges
24 total

Coverage residents most often leave under.

Medicare 25%
Private pay 33%
Medicaid 42%

Places of interest near Bethel Home Inc

Address 0.0 miles from city center Info Estimated distance in miles from Montezuma's city center to Bethel Home Inc's address, calculated via Google Maps.

Calculate Travel Distance to Bethel Home Inc

Add your location

Address

Compare Nursing Homes around the area

The information below is reported by the Kansas Department for Aging and Disability Services.

Bethel Home Inc
NH
IL
RC
Montezuma -56 - 30 -
Brookdale Rosehill
NH
AL
Shawnee -92 A+ 54 Studio / 1 Bed
Meadowlark Hills Retirement Community
NH
HC
IL
NC
Manhattan (Meadowlark Road) -134 - 28 1 Bed / 2 Bed / 3 Bed
Ascension Living Via Christi Village McLean
NH
AL
IL
MC
Wichita (Indian Hills) -95 - 47 Studio / 1 Bed
Ascension Living Via Christi Village Manhattan
NH
AL
IL
Manhattan (Willow Grove Road) -129 - 10 Studio / 1 Bed / 2 Bed

Frequently Asked Questions about Bethel Home Inc

Is Bethel Home Inc in a walkable area?

Bethel Home Inc has a walk score of 30. Somewhat walkable. A few nearby services may be reachable on foot, but most trips require transportation.

What is the license number of Bethel Home Inc?

According to KS state health department records, Bethel Home Inc's license number is 175528.

What is the occupancy rate at Bethel Home Inc?

Bethel Home Inc's occupancy is 89%.

Does Bethel Home Inc operate as a for-profit or non-profit?

Bethel Home Inc is registered as a non-profit in KS.

Who is the administrator of Bethel Home Inc?

Brian Koehn is the administrator of Bethel Home Inc.

How many beds does Bethel Home Inc have?

Bethel Home Inc has 56 beds.

Are there photos of Bethel Home Inc?

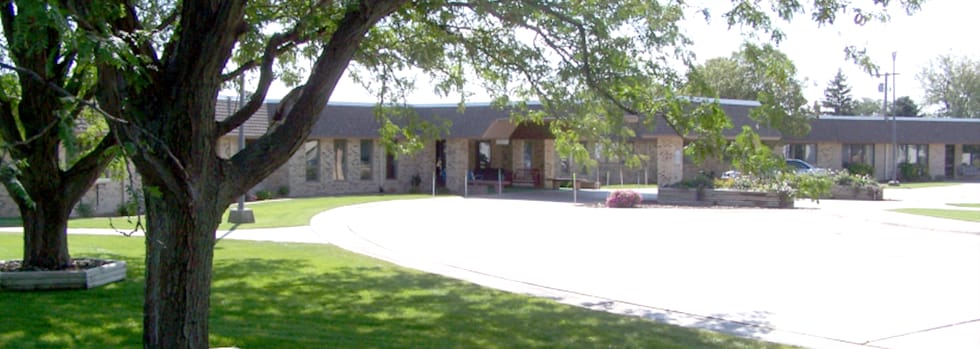
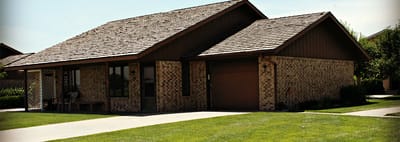
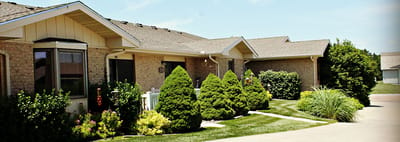
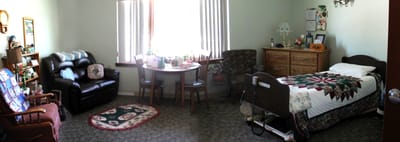
Yes — there are 4 photos of Bethel Home Inc in the photo gallery on this page.

Guides for Better Senior Living

Care Cost Calculator: See Prices in Your Area

Nursing Home Data Explorer

Don’t Wait Too Long: 7 Red Flag Signs Your Parent Needs Assisted Living Now

The True Cost of Assisted Living in 2025 – And How Families Are Paying For It

Understanding Senior Living Costs: Pricing Models, Discounts & Financial Assistance