Pleasant View Home
Nursing Home · Kansas, KS
CMS overall rating Info The Overall CMS Rating is scored from 1 to 5 stars and combines results from health inspections, staffing levels, and quality measures. Health inspections carry the most weight. Staffing and quality scores can increase or decrease the final rating based on performance compared to state and national standards.

Pleasant View Home

Nursing Home · Kansas, KS
CMS overall rating Info The Overall CMS Rating is scored from 1 to 5 stars and combines results from health inspections, staffing levels, and quality measures. Health inspections carry the most weight. Staffing and quality scores can increase or decrease the final rating based on performance compared to state and national standards.
Calculator: See prices in your area
Pleasant View Home accepts Medicare, Medicaid, and private pay.

Overview of Pleasant View Home

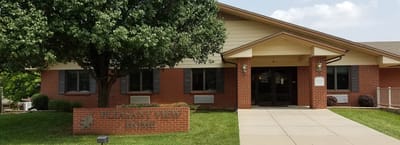
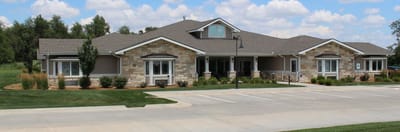
Pleasant View Home is a 122-bed nonprofit nursing facility at 108 N. Walnut in Inman, Kansas. Managed by the Reno County Nursing Home Society, the community provides a full care continuum for McPherson County residents, including long-term skilled nursing, memory care, and short-term rehabilitation.

As a skilled nursing facility (SNF), the community provides 24-hour clinical nursing care and rehabilitation services under the federal Medicare and Medicaid framework. The facility currently carries a 2-out-of-5-star overall CMS rating. While its health inspection and staffing scores trend above state averages, the lower overall rating is primarily influenced by quality measures, such as hospital readmissions and clinical outcomes, which have historically trended below state benchmarks. Notably, based on current focused health filings, the facility maintains a citations-per-inspection rate of zero.

The staffing model is a significant metric for the facility, providing 6 hours and 33 minutes of total nursing care per resident per day, ranking it among the top 10 in Kansas. Direct care is anchored by high Licensed Practical Nurse (LPN) coverage at 59 minutes daily and nurse aides providing 3 hours and 38 minutes of daily care, both figures exceeding state averages by more than 30%. While Registered Nurse (RN) coverage matches state benchmarks on weekends, physical therapy hours average 1 minute per day, which trends below the state norm. The clinical team coordinates a broad range of services, including home health, adult day care, and outpatient rehabilitation.

The campus is divided into distinct residential wings, including specialized memory care neighborhoods and independent living estates. Residents live in private or semi-private suites equipped with 24-hour emergency call systems and wheelchair-accessible bathrooms. All-inclusive services cover three nutritional meals daily, housekeeping, personal laundry, and maintenance-free living. Social life is supported by an activity center, a library, and outdoor communal gardens, with scheduled transportation available for medical appointments and community shopping trips.

Those seeking a nonprofit community with exceptionally high direct-care staffing levels and a wide service continuum may find this environment appropriate. Individuals evaluating the facility should contact the administration directly to discuss current bed availability and request details on recent quality improvement initiatives before making a final placement decision.

Quality ratings

Measured by Centers for Medicare & Medicaid Services (CMS)

Overall rating Info The Overall CMS Rating combines results from health inspections, staffing levels and quality measures. Health inspections carry the most weight. Staffing and quality scores can increase or decrease the final rating based on performance compared to state and national standards.
▼ 27.8% Below KS avg. ▼ 27.8% Below KS avg.Click the badge to see the full State ranking.Click here to see the full State ranking.
Health Inspection Info Based on the results of the facility's three most recent standard inspections and any complaint investigations. CMS reviews the number, scope, and severity of deficiencies, with more recent findings weighted more heavily.
▲ 12.8% Above KS avg. ▲ 12.8% Above KS avg.Click the badge to see the full State ranking.Click here to see the full State ranking.
Staffing Info Measures average nursing staff hours per resident per day, including Registered Nurses (RNs) and total nursing staff. Ratings are adjusted based on the level of care residents require and are compared to state and national benchmarks.
▲ 10.8% Above KS avg. ▲ 10.8% Above KS avg.Click the badge to see the full State ranking.Click here to see the full State ranking.
Quality Measures Info Based on clinical and physical health indicators reported to CMS, such as hospital readmissions, falls, pressure ulcers, and improvements in mobility. These measures reflect how well residents' health needs are being managed.
▼ 68.8% Below KS avg. ▼ 68.8% Below KS avg.Click the badge to see the full State ranking.Click here to see the full State ranking.

Staffing hours breakdown

Info Daily nursing hours per resident by staff type, reported to CMS. Higher is generally better — compare this facility to state and national averages to see where staffing stands.

Hours per resident per day — compared to Kansas state averages

Total nursing care / resident Info This home is ranked 7th out of 141 homes in Kansas. Total adjusted nursing hours per resident per day, combining RN, LPN, and aide time. CMS adjusts this for case-mix so facilities can be fairly compared.
6h 33m per day
Rank #7 / 141Nurse hours — State benchmarkedThis home is ranked 7th out of 141 homes in Kansas. Shows adjusted nurse hours per resident per day benchmarked to the Kansas average, with a ranking across 141 Kansas SNFs. More hours mean more direct care. The national average is about 3.5 hrs; below 3.0 is a red flag.Click the rank badge to see the full State ranking.Click here to see the full State ranking.
This facility Kansas avg (4h 43m per day)
vs Kansas avg
+39%

1 of 6 metrics below state avg

Standout metric LPN / LVN is +47% above state avg
Staff typeHours / Day / Residentvs state avg
Registered Nurse (RN) Info RNs hold the highest nursing license and can assess residents, interpret test results, and direct care plans. More RN hours per day often signals stronger clinical oversight and faster response to health changes. 46m per day ▲ 7% State avg: 43m per day · National avg: 41m per day
LPN / LVN Info Licensed Practical Nurses (LPNs) or Licensed Vocational Nurses (LVNs) deliver routine hands-on care — medication administration, wound dressing, and monitoring vital signs. They work under RN supervision and make up a large share of daily bedside care. 59m per day ▲ 47% State avg: 40m per day · National avg: 52m per day
Nurse Aide Info Certified Nurse Aides (CNAs) provide the most direct day-to-day assistance: bathing, dressing, feeding, and mobility. Nurse aide hours are typically the largest staffing category and directly affect residents' quality of life. 3h 38m per day ▲ 35% State avg: 2h 41m per day · National avg: 2h 20m per day
Weekend Total Nursing Info Combined nursing hours (RN + LPN + Nurse Aide) per resident per day on weekends. Staffing often drops on weekends — this figure reveals whether the facility maintains adequate coverage outside of weekday hours. 4h 46m per day ▲ 33% State avg: 3h 35m per day · National avg: 3h 26m per day
Physical Therapist Info Hours per resident per day provided by licensed Physical Therapists (PTs) or PT Assistants. PT services help residents recover mobility after injury or illness and are especially important for post-acute (short-stay) rehabilitation. 1m per day ▼ 50% State avg: 2m per day · National avg: 4m per day
Weekend RN Info Registered nurse hours specifically on weekends. Facilities sometimes reduce RN presence on Saturdays and Sundays — a low weekend RN figure compared to weekday hours can indicate reduced clinical oversight when most administrative staff are absent. 30m per day ■ Avg State avg: 30m per day · National avg: 28m per day

Capacity and availability

Avg. Length of Stay
179 days
Bed community size
122-bed community Rank #22 / 224Bed count — State benchmarkedThis home is ranked 22nd out of 224 homes in Kansas. Shows this facility's certified or reported bed count compared to other Kansas SNFs. Larger communities may offer more amenities, programs, and on-site services for residents and families.Click the rank badge to see the full State ranking.Click here to see the full State ranking.
A larger shared setting that may offer more common spaces and organized community services.
Walk Score
Walk Score: 31 / 100 Rank #257 / 363Walk Score — State benchmarkedThis home is ranked 257th out of 363 homes in Kansas. Shows how walkable this facility's neighborhood is compared to the average Walk Score across Kansas SNFs. Higher scores benefit residents, families, and staff.Click the rank badge to see the full State ranking.Click here to see the full State ranking.
Somewhat walkable. A few nearby services may be reachable on foot, but most trips require transportation.

About this community

Occupancy

Occupancy rate
91%
Rank #61 / 217Occupancy rate — State benchmarkedThis home is ranked 61st out of 217 homes in Kansas. Shows this facility's occupancy rate versus the Kansas average, with its Statewide rank out of 217. Higher occupancy signals strong local demand and financial stability.Click the rank badge to see the full State ranking.Click here to see the full State ranking.
Higher than the Kansas average: 79.5%
Occupied beds
111 / 122
Average occupied beds in Kansas homes 50 beds

License Details

Facility TypeNursing Facility
StatusActive
CountyMcpherson
License Number175406
CMS Certification Number175406

Ownership & Operating Entity

Pleasant View Home is administrated by Michelle Neufeld.

Owner NameReno County

Therapy & Rehabilitation

3 services
Rehabilitation Services
Respite Care
Short-Term Rehab

Additional Services

4 services
Long Term Nursing Care
Home Health
Short Term Rehab And Recovery
Adult Day Care Services

Amenities & Lifestyle

Specific ProgramsOutpatient Rehab, Pleasant View Estates, East View Villa (income based), Home Plus

Contact Pleasant View Home

Inspection History

In Kansas, the Department for Aging and Disability Services, Survey and Certification Commission performs the unannounced inspections required for facility licensing and federal certification.

Since 2012 · 14 years of data 26 deficiencies

Inspection Scorecard Info This scorecard compares key inspection, citation, and complaint metrics at this facility against the Kansas state average. Metrics rated ≥15% worse than average are highlighted in red; those ≥15% better are highlighted in green.

Since 2012 vs. Kansas state average
Overall vs. KS average 0 Worse No metrics in this bucket. 2 Better Metrics better than Kansas average:
• Total deficiencies (74% below)
• Deficiencies per year (73% below)
Latest Inspection April 23, 2025

Deficiencies Info Deficiencies are formal regulatory issues recorded during state inspections.

This FacilityKS Averagevs. KS Avg
Total deficiencies Info Formal regulatory issues recorded by inspectors across all inspection types. 26100 This facility has 74% fewer total deficiencies than a typical Kansas nursing home (26 vs. KS avg 100).↓ 74% better
Deficiencies per year Info Average deficiencies per year since 2012. 1.97.1 This facility has 73% fewer deficiencies per year than a typical Kansas nursing home (1.9 vs. KS avg 7.1).↓ 73% better

Inspection Reports Summary Info An editor-reviewed summary of the themes and findings across this facility's recent inspection reports.

The most recent inspection on February 17, 2016, found no deficiencies, confirming that previously identified issues had been corrected. Earlier inspections showed some deficiencies mostly related to resident dignity, specifically the failure to cover urinary catheter bags, as well as issues with comprehensive assessments, care planning, medication administration, and infection control. A substantiated complaint in January 2016 involved the uncovered urinary catheter bag, which was addressed through policy changes and staff education. No fines, immediate jeopardy findings, or license actions were listed in the available reports. The facility’s record shows improvement over time, with the most recent follow-up confirming correction of prior deficiencies.

Read the full inspection reports for this facility, including detailed findings and corrective actions.

Show Inspection Reports

Health Inspection History

Inspections since 2021
Total health inspections 4

Kansas average 4.5


Last Health inspection on Apr 2025

Total health citations
22 Rank #61 / 143Health citations — State benchmarkedThis home is ranked 61st out of 143 homes in Kansas. Shows this facility's total health deficiency citations benchmarked to the Kansas State average, with a ranking across all 143 KS SNFs. Lower citation counts earn a better rank.Click the rank badge to see the full State ranking.Click here to see the full State ranking.

Kansas average 26.9

Citations per inspection
5.5 Rank #61 / 143Citations per inspection — State benchmarkedThis home is ranked 61st out of 143 homes in Kansas. Shows average deficiency citations per CMS inspection for this facility versus the Kansas mean across 143 SNFs with citation data. Lower is better.Click the rank badge to see the full State ranking.Click here to see the full State ranking.

Kansas average 6.07


Health citations are formal notices following inspections when they fail to comply with safety and care standards.

19 of 22 citations resulted from standard inspections; and 3 of 22 resulted from complaint investigations.

Breakdown of citation severity (last 5 years)
Critical health citations
0
100% better than Kansas average

Kansas average: 0.9


Serious health citations
1
11% worse than Kansas average

Kansas average: 0.9

0 critical citations Kansas average: 0.9

1 serious citation Kansas average: 0.9

21 moderate citations Kansas average: 24.6

0 minor citations Kansas average: 0.5
Citations history (last 5 years)
Abuse/Neglect moderate citation Apr 08, 2025
Corrected

Abuse/Neglect moderate citation Apr 08, 2025
Corrected

Abuse/Neglect moderate citation Apr 08, 2025
Corrected

Administration moderate citation Oct 09, 2024
Corrected

Staffing Data

Reporting period: October 1 – December 31, 2025 (Q4 2025). Source: CMS Payroll-Based Journal report.

Total staff 206
Employees 127
Contractors 79
Staff to resident ratio 2.54:1
13% better than Kansas average
Kansas average ratio: 2.24:1 Kansas average ratio: 2.24:1See full Kansas ranking
Avg staff/day 62
Average shift 7.1 hours
8% worse than Kansas average
Kansas average: 7.7 hours Kansas average shift: 7.7 hoursSee full Kansas ranking
Total staff hours (quarter) 40,580

Nursing staff breakdown

Q4 2025 · Oct 1 – Dec 31 More info This data comes from the CMS Payroll-Based Journal report covering October 1 – December 31, 2025.
Registered Nurse

Manages medical care and health needs.

RN Staff 15
Average shift length Info Average shift length. Calculated as total hours divided by days worked and average staff per day. 7.5 hours

This role is partially covered by contractors.

Licensed Practical Nurse

Assists with medical care and medications.

LPN Staff 35
Average shift length Info Average shift length. Calculated as total hours divided by days worked and average staff per day. 7.4 hours

This role is partially covered by contractors.

Certified Nursing Assistant

Helps with daily care and mobility.

CNA Staff 118
Average shift length Info Average shift length. Calculated as total hours divided by days worked and average staff per day. 7.3 hours

This role is partially covered by contractors.

Contractor staffing

Q4 2025 · Oct 1 – Dec 31 More info This data comes from the CMS Payroll-Based Journal report covering October 1 – December 31, 2025.

Total hours from contractors

9.9%

4,011 contractor hours this quarter

Certified Nursing Assistant: 32 Licensed Practical Nurse: 10 Medication Aide/Technician: 9 Registered Nurse: 8 Respiratory Therapy Technician: 5 Physical Therapy Assistant: 5 Speech Language Pathologist: 4 Qualified Social Worker: 2 Physical Therapy Aide: 1 Medical Director: 1 Occupational Therapy Assistant: 1 Occupational Therapy Aide: 1

Staff by category

Q4 2025 · Oct 1 – Dec 31 More info This data comes from the CMS Payroll-Based Journal report covering October 1 – December 31, 2025.
Certified Nursing Assistant863211823,50592100%7.3
Licensed Practical Nurse2510357,76092100%7.4
Registered Nurse78153,13292100%7.5
Other Dietary Services Staff4041,7027885%7.3
Medication Aide/Technician0999947379%8.9
Speech Language Pathologist0448377076%4.9
Mental Health Service Worker2025416368%7.4
Clinical Nurse Specialist1014787076%6.8
Nurse Practitioner1014656267%7.5
Administrator1014055459%7.5
Physical Therapy Aide0113256166%5.3
Physical Therapy Assistant0551894852%3.7
Respiratory Therapy Technician0551264751%2.2
Qualified Social Worker022722729%2.7
Occupational Therapy Assistant0112244%5.4
Occupational Therapy Aide0111878%2.6
Medical Director011111112%1
118 Certified Nursing Assistant
% of Days 100%
35 Licensed Practical Nurse
% of Days 100%
15 Registered Nurse
% of Days 100%
4 Other Dietary Services Staff
% of Days 85%
9 Medication Aide/Technician
% of Days 79%
4 Speech Language Pathologist
% of Days 76%
2 Mental Health Service Worker
% of Days 68%
1 Clinical Nurse Specialist
% of Days 76%
1 Nurse Practitioner
% of Days 67%
1 Administrator
% of Days 59%
1 Physical Therapy Aide
% of Days 66%
5 Physical Therapy Assistant
% of Days 52%
5 Respiratory Therapy Technician
% of Days 51%
2 Qualified Social Worker
% of Days 29%
1 Occupational Therapy Assistant
% of Days 4%
1 Occupational Therapy Aide
% of Days 8%
1 Medical Director
% of Days 12%

Penalties and fines

Federal penalties imposed by CMS for regulatory violations, including civil money penalties (fines) and denials of payment for new Medicare/Medicaid admissions.

Source: CMS Penalties Database

No penalties in the past 3 years

No civil money penalties or payment denials were reported in the last 3 years.

Quality of care over time

These measures show how residents usually do over time at this home, based on health outcomes and preventive care.

High-risk clinical events score Info A composite score based on pressure ulcers, falls with injury, weight loss, walking ability decline, and activities of daily living decline. 13.3
27% worse than Kansas average

Kansas average: 10.5

Functional decline score Info A composite score based on activities of daily living decline, walking ability decline, and incontinence. 25.1
21% worse than Kansas average

Kansas average: 20.7

Long-stay resident measures
Below average Kansas avg: 3.0 Info CMS star rating based on long-stay quality measure performance. 5 stars = significantly above average, 1 star = significantly below average.
Need for Help with Daily Activities Increased Info Percent of long-stay residents whose need for help with daily activities has increased 29.2%
53% worse than Kansas average

Kansas average: 19.0%

Walking Ability Worsened Info Percent of long-stay residents whose ability to move independently worsened 20.8%
7% worse than Kansas average

Kansas average: 19.4%

Low Risk Residents with Bowel/Bladder Incontinence Info Percent of low risk long-stay residents who lose control of their bowels or bladder 25.3%
7% worse than Kansas average

Kansas average: 23.8%

Falls with Major Injury Info Percent of long-stay residents experiencing one or more falls with major injury 6.4%
46% worse than Kansas average

Kansas average: 4.4%

High Risk Residents with Pressure Ulcers Info Percent of long-stay high risk residents with pressure ulcers 3.2%
32% better than Kansas average

Kansas average: 4.6%

Urinary Tract Infection Info Percent of long-stay residents with a urinary tract infection 4.4%
39% worse than Kansas average

Kansas average: 3.1%

Lost Too Much Weight Info Percent of long-stay residents who lose too much weight 6.9%
36% worse than Kansas average

Kansas average: 5.1%

Depressive Symptoms Info Percent of long-stay residents who have depressive symptoms 5.3%
In line with Kansas average

Kansas average: 5.2%

Antipsychotic Use Info Percent of long-stay residents who received an antipsychotic medication 10.6%
38% better than Kansas average

Kansas average: 16.9%

Pneumococcal Vaccine Info Percent of long-stay residents assessed and appropriately given the pneumococcal vaccine 83.9%
9% worse than Kansas average

Kansas average: 91.9%

Influenza Vaccine Info Percent of long-stay residents assessed and appropriately given the seasonal influenza vaccine 98.7%
In line with Kansas average

Kansas average: 95.5%

Hospitalizations per 1,000 days Info Number of hospitalizations per 1,000 long-stay resident days. 2.35
28% worse than Kansas average

Kansas average: 1.84

ED visits per 1,000 days Info Number of outpatient emergency department visits per 1,000 long-stay resident days. 2.26
5% worse than Kansas average

Kansas average: 2.16

Short-stay resident measures
Significantly below average Kansas avg: 2.6 Info CMS star rating based on short-stay quality measure performance. 5 stars = much above average, 1 star = much below average.
Pneumococcal Vaccine Info Percent of short-stay residents assessed and appropriately given the pneumococcal vaccine 79.4%
5% better than Kansas average

Kansas average: 75.6%

Antipsychotic medication increase Info Percent of short-stay residents who newly received an antipsychotic medication 4.9%
124% worse than Kansas average

Kansas average: 2.2%

Influenza Vaccine Info Percent of short-stay residents assessed and appropriately given the seasonal influenza vaccine 90.9%
24% better than Kansas average

Kansas average: 73.5%

Re-hospitalized after SNF stay Info Percentage of short-stay residents who were re-hospitalized after their nursing home admission. 25.7%
12% worse than Kansas average

Kansas average: 23.0%

Emergency department visits Info Percentage of short-stay residents who had an outpatient emergency department visit. 19.5%
67% worse than Kansas average

Kansas average: 11.7%

Falls with major injury Info Percentage of SNF residents who experience falls with major injury during their stay. 2.4%
213% worse than Kansas average

Kansas average: 0.8%

Ability to care for self at discharge Info Percentage of residents at or above expected ability to care for themselves at discharge. 52.6%
In line with Kansas average

Kansas average: 53.7%

Successful return to home or community Info Rate of successful return to home or community from a skilled nursing facility. 48.4%
In line with Kansas average

Kansas average: 50.6%

Breakdown by payment type

Medicare

31% of new residents, usually for short-term rehab.

Typical stay 1 - 2 months

Private pay

36% of new residents, often for short stays.

Typical stay 1 years

Medicaid

33% of new residents, often for long-term daily care.

Typical stay 8 - 9 months

Facility Characteristics

Source: CMS Long-Term Care Facility Characteristics (Data as of Jan 2026)

Total residents 81
Medicare
9
11.1% of residents
Medicaid
36
44.4% of residents
Private pay or other
36
44.4% of residents
Programs & Services
Residents Group

Residents meet regularly to discuss policies, care quality, and activities

CCRC

Part of a Continuing Care Retirement Community offering multiple care levels

Active Resident Council

Organized group of residents that meets regularly to discuss facility policies, quality of life, and activities.

Finances and operations

Voluntary non-profit community
Home revenue
$11.7M
Operating deficit
-$801.1K
Voluntary non-profit community
Home revenue
$11.7M Rank #36 / 144Revenue — State benchmarkedThis home is ranked 36th out of 144 homes in Kansas. Shows this facility's annual revenue compared to the Kansas SNF average. Higher revenue generally means more resources for staffing and capital — read alongside Payroll %.Click the rank badge to see the full State ranking.Click here to see the full State ranking.
Operating deficit
-$801.1K
Payroll costs Info The portion of the home's budget spent on staff, including nurses, caregivers, and other employees who support care and operations. Rank #12 / 144Payroll — State benchmarkedThis home is ranked 12th out of 144 homes in Kansas. Shows total annual staff payroll benchmarked to the Kansas average. Higher payroll investment relative to peers often signals better staffing and less reliance on cheaper contract labor.Click the rank badge to see the full State ranking.Click here to see the full State ranking.
$8.8M
75.1% of revenue Rank #5 / 144Payroll % — State benchmarkedThis home is ranked 5th out of 144 homes in Kansas. Shows payroll as a percentage of revenue versus the Kansas average. Well-run Kansas SNFs typically land around 57–67% — the top third Statewide. Below 25% may signal understaffing or heavy agency use — read with Staffing ratings.Click the rank badge to see the full State ranking.Click here to see the full State ranking.
Other operating costs Info All remaining costs needed to run the home, such as food, utilities, building maintenance, supplies and administrative expenses.
$3.7M
Total costs $12.5M

Who this home usually serves

TYPE OF STAY

Mix of rehab and long-term care

This home supports both short-term rehab and long-term care, with residents staying for a wide range of durations.

Places of interest near Pleasant View Home

Address 0.0 miles from city center Info Estimated distance in miles from Inman's city center to Pleasant View Home's address, calculated via Google Maps.

Calculate Travel Distance to Pleasant View Home

Add your location

Address

Financial Assistance for
Nursing Home in Kansas

Pleasant View Home is located in INMAN, Kansas.
Here are the financial assistance programs available to residents in Kansas.

Get Financial aid guidance

Frail Elderly Waiver

Kansas Medicaid FE Waiver

Age 65+
General Kansas resident, Medicaid-eligible, nursing home- level care need.
Income Limits (2025) ~$2,829/month 300% FBR, individual
Asset Limits $2,000 (individual), $3,000 (couple).
KS

Requires care level assessment.

Benefits
Personal care (5-7 hours/day) Respite (240 hours/year) Adult day care (~$60/day) Home aides

Senior Care Act

Kansas SCA

Age 60+
General Kansas resident, at risk of nursing home.
Income Limits ~$1,800/month individual, varies
Asset Limits $2,000 individual
KS

Limited funding; waitlists common.

Benefits
In-home care (3-5 hours/week) Respite (up to 10 days/year) Homemaker services

Medicare Savings Program (MSP)

Kansas Medicare Savings Program

Age 65+ or disabled
General Kansas resident, Medicare Part A/B.
Income Limits (2025) ~$2,510/month (QMB), ~$3,380/month (SLMB), ~$3,598/month (QI)—individual.
Asset Limits $9,430 (individual), $14,130 (couple).
KS

Three tiers; no waitlist.

Benefits
Covers Part B premiums ($174.70/month) Deductibles ($240/year) Copays (~20%)

National Family Caregiver Support Program (NFCSP) Respite

Kansas NFCSP Respite Care

Age
General Caregivers of 60+ needing care or 55+ caregivers of others; Kansas resident; functional needs (2+ ADLs).
Income Limits (2025) Prioritizes ~$24,980/year (individual); no strict cap.
Asset Limits Not assessed; need-based.
KS

11 AAAs; prioritizes low-income, rural caregivers.

Benefits
Respite (4-6 hours/week or 5 days/year) Adult day care ($60/day) Caregiver training

VA Aid and Attendance (A&A) and Housebound Benefits

Kansas VA Aid and Attendance/Housebound

Age 65+ or disabled veteran/spouse
General Kansas resident, wartime service, need for ADL help (A&A) or homebound.
Income Limits (2025) Net income < ~$1,984/month (veteran with dependent, A&A); pension offsets income.
Asset Limits ~$155,356 net worth limit
KS

High veteran demand in rural/urban areas.

Benefits
Cash (~$1,433-$2,642/month veteran, ~$951-$1,318 spouse) for care costs (e.g., in-home, assisted living)

Compare Nursing Home around Kansas

5 facilities compared · CMS & PO Dept. of Health data

Filter by care type
Lexington Park Assisted Living
NH

Nursing Home Licensed facility providing 24/7 skilled nursing care for residents with complex, ongoing medical needs. Staffed by RNs, LPNs, and CNAs. Inspected and star-rated annually by CMS. Accepts Medicare (short-term rehab) and Medicaid (long-term care).

AL

Assisted Living A licensed, long-term care setting for seniors or individuals with disabilities who need help with daily activities — like bathing, dressing, and medication management — but not 24-hour skilled nursing. Offers housing, meals, and around-the-clock support while aiming to maximize resident independence.

IL

Independent Living Lifestyle-focused communities for older adults offering dining, activities, and transportation with minimal personal care. Best for active, independent seniors who want community without medical support.

Topeka (West Southwest 2)60 83.9% +6%4.49 -50%-3%$082.7-79A+ 60 Floyd Eaton$10.9M$4.3M39.7%175154
Lakeview Village
NH

Nursing Home Licensed facility providing 24/7 skilled nursing care for residents with complex, ongoing medical needs. Staffed by RNs, LPNs, and CNAs. Inspected and star-rated annually by CMS. Accepts Medicare (short-term rehab) and Medicaid (long-term care).

AL

Assisted Living A licensed, long-term care setting for seniors or individuals with disabilities who need help with daily activities — like bathing, dressing, and medication management — but not 24-hour skilled nursing. Offers housing, meals, and around-the-clock support while aiming to maximize resident independence.

HC

Home Care Professional care delivered in the person's own home — from companionship and errands to skilled nursing and therapy. Allows seniors to age in place. Medicare covers skilled home health when medically necessary.

IL

Independent Living Lifestyle-focused communities for older adults offering dining, activities, and transportation with minimal personal care. Best for active, independent seniors who want community without medical support.

Lenexa184 105.3% +32%7.23 -23%+56%$13.4k184.52112A+ 54 Lakeview Village, Inc.$66.9M$29.7M44.5%175242
Garden Terrace at Overland Park
NH

Nursing Home Licensed facility providing 24/7 skilled nursing care for residents with complex, ongoing medical needs. Staffed by RNs, LPNs, and CNAs. Inspected and star-rated annually by CMS. Accepts Medicare (short-term rehab) and Medicaid (long-term care).

AL

Assisted Living A licensed, long-term care setting for seniors or individuals with disabilities who need help with daily activities — like bathing, dressing, and medication management — but not 24-hour skilled nursing. Offers housing, meals, and around-the-clock support while aiming to maximize resident independence.

Overland Park163 86.5% +9%4.41 -19%-5%$44.7k456.42141- 59 Debra Biehl$22.9M$12.0M52.3%175158
Pleasant View Home
NH

Nursing Home Licensed facility providing 24/7 skilled nursing care for residents with complex, ongoing medical needs. Staffed by RNs, LPNs, and CNAs. Inspected and star-rated annually by CMS. Accepts Medicare (short-term rehab) and Medicaid (long-term care).

AL

Assisted Living A licensed, long-term care setting for seniors or individuals with disabilities who need help with daily activities — like bathing, dressing, and medication management — but not 24-hour skilled nursing. Offers housing, meals, and around-the-clock support while aiming to maximize resident independence.

Inman122 91.0% +14%6.55 -28%+41%$0225.51111- 31 Brad Franz$11.7M$8.8M75.1%175406
Colonial Village Overland Park
NH

Nursing Home Licensed facility providing 24/7 skilled nursing care for residents with complex, ongoing medical needs. Staffed by RNs, LPNs, and CNAs. Inspected and star-rated annually by CMS. Accepts Medicare (short-term rehab) and Medicaid (long-term care).

AL

Assisted Living A licensed, long-term care setting for seniors or individuals with disabilities who need help with daily activities — like bathing, dressing, and medication management — but not 24-hour skilled nursing. Offers housing, meals, and around-the-clock support while aiming to maximize resident independence.

IL

Independent Living Lifestyle-focused communities for older adults offering dining, activities, and transportation with minimal personal care. Best for active, independent seniors who want community without medical support.

MC

Memory Care Secured, specialized care for people living with Alzheimer's or dementia. Staff trained in cognitive impairment, with higher staff-to-resident ratios and an environment designed to reduce confusion and wandering risk.

Overland Park82 84.1% +6%4.73 -36%+2%$4.9k289.3134- 45 Dan Chik$11.6M$4.7M40.7%175560

Frequently Asked Questions about Pleasant View Home

Who is the owner of Pleasant View Home?

The legal owner and operator of Pleasant View Home is Reno County.

Is Pleasant View Home in a walkable area?

Pleasant View Home has a walk score of 31. Somewhat walkable. A few nearby services may be reachable on foot, but most trips require transportation.

What is the license number of Pleasant View Home?

According to KS state health department records, Pleasant View Home's license number is 175406.

What is the occupancy rate at Pleasant View Home?

Pleasant View Home's occupancy is 91%.

Who is the administrator of Pleasant View Home?

Michelle Neufeld is the administrator of Pleasant View Home.

How many beds does Pleasant View Home have?

Pleasant View Home has 122 beds.

Are there photos of Pleasant View Home?

Yes — there are 6 photos of Pleasant View Home in the photo gallery on this page.

Guides for Better Senior Living

Care Cost Calculator: See Prices in Your Area

Nursing Home Data Explorer

Don’t Wait Too Long: 7 Red Flag Signs Your Parent Needs Assisted Living Now

The True Cost of Assisted Living in 2025 – And How Families Are Paying For It

Understanding Senior Living Costs: Pricing Models, Discounts & Financial Assistance

Explore Open Rooms
1 Contact details
2 What type of senior care service are you looking for?
3 What budget do you have in mind for senior care?
4 How soon do you need to find care?
5 Additional details

Thank you for your interest!

Our team will be in touch shortly to help with next steps.