Parkside Homes
Nursing Home, Assisted Living, Independent Living & Skilled Nursing · Hillsboro, KS
CMS overall rating Info CMS (the Centers for Medicare & Medicaid Services) is the federal agency that rates nursing home quality. Its Overall Rating runs from 1 to 5 stars, combining health inspections, staffing, and quality measures, with inspections weighted most heavily.

Parkside Homes

Nursing Home, Assisted Living, Independent Living & Skilled Nursing · Hillsboro, KS
CMS overall rating Info CMS (the Centers for Medicare & Medicaid Services) is the federal agency that rates nursing home quality. Its Overall Rating runs from 1 to 5 stars, combining health inspections, staffing, and quality measures, with inspections weighted most heavily.
Calculator: See prices in your area
Parkside Homes accepts Medicare, Medicaid, and private pay.

Overview of Parkside Homes

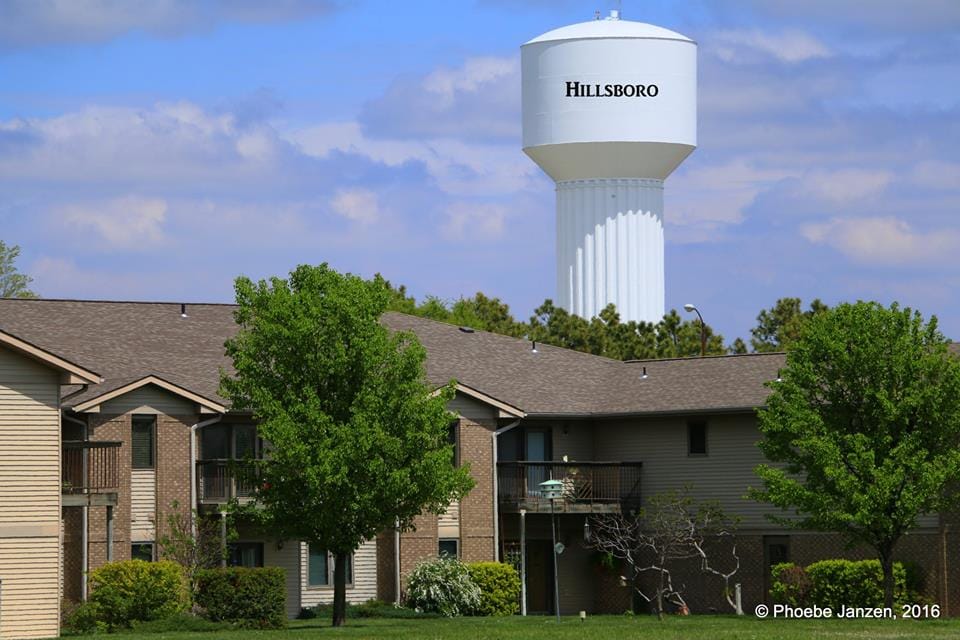
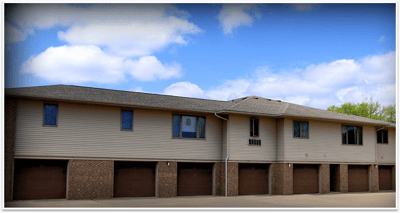
Parkside Homes is a 50-bed skilled nursing and rehabilitation community at 200 Willow Road in Hillsboro, Kansas, operated by municipal entity City of Hillsboro in Marion County. Part of a broader campus with independent and assisted living, the facility takes Medicare, Medicaid, and private pay, averaging a stay of 265 days.

CMS grades the facility 1 star, 63.9 percent below Kansas’ average, driven by a health inspection sub-rating running 62.4 percent below state mean. Staffing and quality measures both run above Kansas’ average. Across 6 inspections since 2021, the facility totaled 37 citations including 3 critical findings, 233 percent above Kansas’ 0.9 average. A $44,000 federal fine and an 8-day payment denial were issued in October 2024, bringing total fines to $73,000 across three penalties in the past three years. Nurse hours reach 5h 19m per resident daily, 13 percent above Kansas’ average, with CNA hours running 40 percent above state figure. At 58 percent occupancy that’s well below Kansas’ 79.5 percent average and ranked 188th out of 217 state facilities, the community has significant availability.

Services are memory care, rehabilitation, and respite care alongside skilled nursing. An active resident council is present.

Parkside Homes caters to skilled nursing and rehabilitation residents in Hillsboro within a municipally operated community in Marion County.

Quality ratings

Measured by Centers for Medicare & Medicaid Services (CMS)

Overall rating Info The Overall CMS Rating combines results from health inspections, staffing levels and quality measures. Health inspections carry the most weight. Staffing and quality scores can increase or decrease the final rating based on performance compared to state and national standards.
Health Inspection Info Based on the results of the facility's three most recent standard inspections and any complaint investigations. CMS reviews the number, scope, and severity of deficiencies, with more recent findings weighted more heavily.
Staffing Info Measures average nursing staff hours per resident per day, including Registered Nurses (RNs) and total nursing staff. Ratings are adjusted based on the level of care residents require and are compared to state and national benchmarks.
Quality Measures Info Based on clinical and physical health indicators reported to CMS, such as hospital readmissions, falls, pressure ulcers, and improvements in mobility. These measures reflect how well residents' health needs are being managed.

Staffing hours breakdown

Info Daily nursing hours per resident by staff type, reported to CMS. Higher is generally better — compare this facility to state and national averages to see where staffing stands.

Hours per resident per day — compared to state averages

Total nursing care / resident Info Total adjusted nursing hours per resident per day, combining RN, LPN, and aide time. CMS adjusts this for case-mix so facilities can be fairly compared.
5h 19m per day
vs avg

3 of 6 metrics below state avg

Standout metric Physical Therapist is +135% above state avg
Staff typeHours / Day / Residentvs state avg
Registered Nurse (RN) Info RNs hold the highest nursing license and can assess residents, interpret test results, and direct care plans. More RN hours per day often signals stronger clinical oversight and faster response to health changes. 35m per day ▼ 19% State avg: 43m per day · National avg: 41m per day
LPN / LVN Info Licensed Practical Nurses (LPNs) or Licensed Vocational Nurses (LVNs) deliver routine hands-on care — medication administration, wound dressing, and monitoring vital signs. They work under RN supervision and make up a large share of daily bedside care. 39m per day ▼ 4% State avg: 40m per day · National avg: 52m per day
Nurse Aide Info Certified Nurse Aides (CNAs) provide the most direct day-to-day assistance: bathing, dressing, feeding, and mobility. Nurse aide hours are typically the largest staffing category and directly affect residents' quality of life. 4h 0m per day ▲ 49% State avg: 2h 41m per day · National avg: 2h 20m per day
Weekend Total Nursing Info Combined nursing hours (RN + LPN + Nurse Aide) per resident per day on weekends. Staffing often drops on weekends — this figure reveals whether the facility maintains adequate coverage outside of weekday hours. 4h 32m per day ▲ 26% State avg: 3h 35m per day · National avg: 3h 26m per day
Physical Therapist Info Hours per resident per day provided by licensed Physical Therapists (PTs) or PT Assistants. PT services help residents recover mobility after injury or illness and are especially important for post-acute (short-stay) rehabilitation. 5m per day ▲ 135% State avg: 2m per day · National avg: 4m per day
Weekend RN Info Registered nurse hours specifically on weekends. Facilities sometimes reduce RN presence on Saturdays and Sundays — a low weekend RN figure compared to weekday hours can indicate reduced clinical oversight when most administrative staff are absent. 21m per day ▼ 30% State avg: 30m per day · National avg: 28m per day

Capacity and availability

Avg. Length of Stay Info Average number of days residents stay at this facility, based on CMS cost report data. Shorter stays often reflect post-acute or rehab care; longer stays reflect long-term care.
265 days
Bed community size
50-bed community Rank #137 / 224Bed count — State benchmarkedThis home is ranked 137th out of 224 homes in Kansas. Shows this facility's certified or reported bed count compared to other Kansas facilities. Larger communities may offer more amenities, programs, and on-site services for residents and families.Rankings are based only on facilities in Kansas that report data for that category. Facilities without available data are excluded from the ranking.Click the rank badge to see the full State ranking.Click here to see the full State ranking.
A moderately sized community that may balance personal attention with shared amenities and social activities.
Walk Score
Walk Score: 65 / 100 Rank #75 / 363Walk Score — State benchmarkedThis home is ranked 75th out of 363 homes in Kansas. Shows how walkable this facility's neighborhood is compared to the average Walk Score across Kansas facilities. Higher scores benefit residents, families, and staff.Rankings are based only on facilities in Kansas that report data for that category. Facilities without available data are excluded from the ranking.Click the rank badge to see the full State ranking.Click here to see the full State ranking.
Moderately walkable. Some errands can be accomplished on foot, with a mix of nearby amenities.

About this community

Occupancy

Occupancy rate
76%
Similar to the Kansas average: 79.5%
Occupied beds
38 / 50
Average occupied beds in Kansas homes 50 beds

License Details

Facility TypeNursing Facility | Assisted Living Facility
StatusActive
CountyMarion
License Number175387
CMS Certification Number175387

Ownership & Operating Entity

Parkside Homes is administered by Stephanie Bryant.

Owner NameCity Of Hillsboro

Therapy & Rehabilitation

2 services
Rehabilitation Services
Short-Term Rehab

Staffing & Medical

1 service
24-Hour Staffing

Additional Policies & Features

Pets Allowed
HousekeepingYes
Utilities IncludedYes

Amenities & Lifestyle

Daily Lunch Meal
Medication Pass
Cable And Phone Service
Water
Trash
Electric
24-Hour Certified Staff
24-Hour Security System
Activities
Use Of Common Space
Use Of Guest Rooms
Routine Maintenance And Grounds-Keeping
Specific ProgramsHealthcare, Rehabilitative Services

Pricing & Financial Information

starting at$450/month

Contact Parkside Homes

Inspection History

In Kansas, the Department for Aging and Disability Services, Survey and Certification Commission performs the unannounced inspections required for facility licensing and federal certification.

Since 2012 · 14 years of data 151 deficiencies

Inspection Scorecard Info This scorecard compares key inspection, deficiency, and complaint metrics at this facility against the Kansas state average. Metrics rated ≥15% worse than average are highlighted in red; those ≥15% better are highlighted in green.

Since 2012 vs. Kansas state average
Overall vs. KS average 2 Worse Metrics worse than Kansas average:
• Total deficiencies (51% above)
• Deficiencies per year (52% above)
0 Better No metrics in this bucket.
Latest Inspection June 23, 2025

Deficiencies Info Deficiencies are formal regulatory issues recorded during state inspections.

This FacilityKS Averagevs. KS Avg
Total deficiencies Info Formal regulatory issues recorded by inspectors across all inspection types. 151100 This facility has 51% more total deficiencies than a typical Kansas assisted living residence (151 vs. KS avg 100).↑ 51% worse
Deficiencies per year Info Average deficiencies per year since 2012. 10.87.1 This facility has 52% more deficiencies per year than a typical Kansas assisted living residence (10.8 vs. KS avg 7.1).↑ 52% worse

Inspection Reports Summary Info An editor-reviewed summary of the themes and findings across this facility's recent inspection reports.

  • The most recent inspection on July 5, 2018, found no deficiencies after a revisit confirmed previous issues had been corrected. Earlier inspections identified recurring deficiencies primarily related to medication management, nursing assessments, care planning, infection control, and safety practices. Several complaint investigations substantiated concerns about delayed or inadequate resident care, including wound treatment, fall management, and monitoring of medications with black box warnings. Enforcement actions included fines and restrictions tied to deficiencies rated at levels indicating actual harm without immediate jeopardy, with some enforcement remedies such as denial of payment for new admissions noted in prior years. The facility’s inspection history shows a pattern of addressing cited deficiencies through plans of correction, with recent reports indicating improvement and compliance with regulatory requirements.

Health Inspection History

Inspections since 2021
Total health inspections 6

State average N/A


Last Health inspection on Mar 2025

Total health citations
37

State average N/A

Citations per inspection
6.17

State average N/A


Health citations are formal notices following inspections when they fail to comply with safety and care standards.

14 of 37 citations resulted from standard inspections; 5 of 37 resulted from complaint investigations; and 18 of 37 came from combined inspections (standard and complaint).

Breakdown of citation severity (last 5 years)
Critical health citations
3
In line with State average

State average: N/A


Serious health citations
1
In line with State average

State average: N/A

3 critical citations State average: N/A

1 serious citation State average: N/A

33 moderate citations State average: N/A

0 minor citations State average: N/A
Citations history (last 5 years)
Pharmacy moderate citation Mar 17, 2025
Corrected

Infection Control moderate citation Oct 08, 2024
Corrected

Infection Control moderate citation Oct 08, 2024
Corrected

Infection Control moderate citation Oct 08, 2024
Corrected

Staffing Data

Reporting period: October 1 – December 31, 2025 (Q4 2025). Source: CMS Payroll-Based Journal report.

Total staff 99
Employees 44
Contractors 55
Staff to resident ratio 2.91 : 1
0% compared with State average

State average ratio: 0 : 0

Avg staff/day 25
Average shift 7.9 hours
0% compared with State average

State average: 0 hours

Total staff hours (quarter) 18,106

Nursing staff breakdown

Q4 2025 · Oct 1 – Dec 31 More info This data comes from the CMS Payroll-Based Journal report covering October 1 – December 31, 2025.
Registered Nurse

Manages medical care and health needs.

RN Staff Info 8 total: 3 full-time employees and 5 contractors. 8
Average shift length Info Average shift length. Calculated as total hours divided by days worked and average staff per day. 8.4 hours
Licensed Practical Nurse

Assists with medical care and medications.

LPN Staff Info 10 total: 4 full-time employees and 6 contractors. 10
Average shift length Info Average shift length. Calculated as total hours divided by days worked and average staff per day. 9.8 hours
Certified Nursing Assistant

Helps with daily care and mobility.

CNA Staff Info 40 total: 19 full-time employees and 21 contractors. 40
Average shift length Info Average shift length. Calculated as total hours divided by days worked and average staff per day. 8.3 hours

Contractor staffing

Q4 2025 · Oct 1 – Dec 31 More info This data comes from the CMS Payroll-Based Journal report covering October 1 – December 31, 2025.

Total hours from contractors

11.6%

2,098 contractor hours this quarter

Certified Nursing Assistant: 21 Medication Aide/Technician: 13 Licensed Practical Nurse: 6 Registered Nurse: 5 Speech Language Pathologist: 2 Qualified Social Worker: 2 Occupational Therapy Assistant: 1 Medical Director: 1 Physical Therapy Assistant: 1 Respiratory Therapy Technician: 1 Other Physician: 1 Occupational Therapy Aide: 1

Staff by category

Q4 2025 · Oct 1 – Dec 31 More info This data comes from the CMS Payroll-Based Journal report covering October 1 – December 31, 2025.
Certified Nursing Assistant1921406,34792100%8.3
Medication Aide/Technician1113245,75492100%8.9
Licensed Practical Nurse46101,9459199%9.8
Registered Nurse3587927582%8.4
Clinical Nurse Specialist2024816267%7.1
Administrator1014806368%7.6
Nurse Practitioner1014806065%8
Dental Services Staff1014746065%7.9
Dietitian1014536571%7
Physical Therapy Assistant0113257986%4.1
Respiratory Therapy Technician0112376368%3.8
Qualified Social Worker0221464448%3.2
Speech Language Pathologist0221403235%4.4
Medical Director011161617%1
Occupational Therapy Assistant0111133%3.7
Occupational Therapy Aide0111133%3.6
Nurse Aide in Training101733%2.2
Other Physician01171314%0.5
40 Certified Nursing Assistant
% of Days 100%
24 Medication Aide/Technician
% of Days 100%
10 Licensed Practical Nurse
% of Days 99%
8 Registered Nurse
% of Days 82%
2 Clinical Nurse Specialist
% of Days 67%
1 Administrator
% of Days 68%
1 Nurse Practitioner
% of Days 65%
1 Dental Services Staff
% of Days 65%
1 Dietitian
% of Days 71%
1 Physical Therapy Assistant
% of Days 86%
1 Respiratory Therapy Technician
% of Days 68%
2 Qualified Social Worker
% of Days 48%
2 Speech Language Pathologist
% of Days 35%
1 Medical Director
% of Days 17%
1 Occupational Therapy Assistant
% of Days 3%
1 Occupational Therapy Aide
% of Days 3%
1 Nurse Aide in Training
% of Days 3%
1 Other Physician
% of Days 14%

Penalties and fines

Includes penalties issued in 2024

Federal penalties imposed by CMS for regulatory violations, including civil money penalties (fines) and denials of payment for new Medicare/Medicaid admissions.

Source: CMS Penalties Database (Data as of Jan 2026)

Total fines amount $73K
66% higher than State average

State average: $44K

Number of fines 3
24% more fines than State average

State average: 2.4

Payment Denials Info Serious action where Medicare and/or Medicaid temporarily stops payments for new residents until issues are fixed. 1
200% more payment denials than State average

State average: 0.3

Fines amount comparison
This facility $73K
State average $44K
Penalty History

Penalties are imposed by CMS for violations of federal nursing home regulations.

3 penalties in the past 3 years

Multiple penalties were reported in the last 3 years.

Civil Money Penalty Info Fines imposed for noncompliance, which can be assessed per day or per instance of violation. Oct 8, 2024
$44K
Payment Denial Info Serious action where Medicare and/or Medicaid temporarily stops payments for new residents until issues are fixed. Oct 8, 2024
8 days
Civil Money Penalty Info Fines imposed for noncompliance, which can be assessed per day or per instance of violation. Apr 9, 2024
$13K

Last updated: Jan 2026

Quality of care over time

These measures show how residents usually do over time at this home, based on health outcomes and preventive care.

High-risk clinical events score Info A composite score based on pressure ulcers, falls with injury, weight loss, walking ability decline, and activities of daily living decline. 12.8
22% worse than State average

State average: 10.5

Functional decline score Info A composite score based on activities of daily living decline, walking ability decline, and incontinence. 26.4
27% worse than State average

State average: 20.7

Long-stay resident measures
Below average State avg: 3.0 Info CMS star rating based on long-stay quality measure performance. 5 stars = significantly above average, 1 star = significantly below average.
Need for Help with Daily Activities Increased Info Percent of long-stay residents whose need for help with daily activities has increased 25.0%
31% worse than State average

State average: 19.0%

Walking Ability Worsened Info Percent of long-stay residents whose ability to move independently worsened 29.2%
51% worse than State average

State average: 19.4%

Low Risk Residents with Bowel/Bladder Incontinence Info Percent of low risk long-stay residents who lose control of their bowels or bladder 24.9%
5% worse than State average

State average: 23.8%

Falls with Major Injury Info Percent of long-stay residents experiencing one or more falls with major injury 2.9%
34% better than State average

State average: 4.4%

High Risk Residents with Pressure Ulcers Info Percent of long-stay high risk residents with pressure ulcers 2.6%
45% better than State average

State average: 4.6%

Urinary Tract Infection Info Percent of long-stay residents with a urinary tract infection 0.8%
76% better than State average

State average: 3.1%

Lost Too Much Weight Info Percent of long-stay residents who lose too much weight 4.2%
18% better than State average

State average: 5.1%

Depressive Symptoms Info Percent of long-stay residents who have depressive symptoms 3.0%
42% better than State average

State average: 5.2%

Antipsychotic Use Info Percent of long-stay residents who received an antipsychotic medication 16.8%
In line with State average

State average: 16.9%

Pneumococcal Vaccine Info Percent of long-stay residents assessed and appropriately given the pneumococcal vaccine 96.4%
5% better than State average

State average: 91.9%

Influenza Vaccine Info Percent of long-stay residents assessed and appropriately given the seasonal influenza vaccine 92.1%
In line with State average

State average: 95.5%

Hospitalizations per 1,000 days Info Number of hospitalizations per 1,000 long-stay resident days. 1.38
25% better than State average

State average: 1.84

ED visits per 1,000 days Info Number of outpatient emergency department visits per 1,000 long-stay resident days. 3.38
56% worse than State average

State average: 2.16

Short-stay resident measures
Pneumococcal Vaccine Info Percent of short-stay residents assessed and appropriately given the pneumococcal vaccine 65.6%
13% worse than State average

State average: 75.6%

Antipsychotic medication increase Info Percent of short-stay residents who newly received an antipsychotic medication 0.0%
100% better than State average

State average: 2.2%

Falls with major injury Info Percentage of SNF residents who experience falls with major injury during their stay. 0.0%
100% better than State average

State average: 0.8%

Successful return to home or community Info Rate of successful return to home or community from a skilled nursing facility. 44.6%
12% worse than State average

State average: 50.6%

Breakdown by payment type

Medicare

87% of new residents, usually for short-term rehab.

Typical stay 1 - 2 months

Private pay

12% of new residents, often for short stays.

Typical stay 2 - 3 years

Medicaid

2% of new residents, often for long-term daily care.

Typical stay 17 years

Facility Characteristics

Source: CMS Long-Term Care Facility Characteristics (Data as of Jan 2026)

Total residents 34
Medicare
2
5.9% of residents
Medicaid
19
55.9% of residents
Private pay or other
13
38.2% of residents
Programs & Services
Residents Group

Residents meet regularly to discuss policies, care quality, and activities

Active Resident Council

Organized group of residents that meets regularly to discuss facility policies, quality of life, and activities.

Finances and operations

Based on CMS SNF Cost Report for fiscal year ending in 09/2023.

Nonprofit
Other Nonprofit
Net patient revenue Info Net patient revenue — what the home actually collects for resident care, after contractual allowances, bad debt and discounts are subtracted from its gross charges (CMS cost report, Worksheet G-3). It covers resident care only; money the home earns from other sources is shown separately as "Other income."
$4.3M
Net patient income Info Net patient income: net patient revenue minus the home's total operating expenses. A positive figure means it earns more from resident care than it spends to deliver it; a negative figure means the opposite. It excludes non-operating "other income."
-$1.4M
Nonprofit Other Nonprofit
Net patient revenue Info Net patient revenue — what the home actually collects for resident care, after contractual allowances, bad debt and discounts are subtracted from its gross charges (CMS cost report, Worksheet G-3). It covers resident care only; money the home earns from other sources is shown separately as "Other income."
$4.3M
Net patient income Info Net patient income: net patient revenue minus the home's total operating expenses. A positive figure means it earns more from resident care than it spends to deliver it; a negative figure means the opposite. It excludes non-operating "other income."
-$1.4M
Other income Info Money the home earns outside of resident care — such as investments, grants, rentals and other non-operating sources (CMS cost report, Worksheet G-3). It is tracked separately from net patient revenue: it is not part of that figure, and it is not included in net patient income.
$1.3M
Payroll costs Info Staff salaries plus wage-related costs — benefits such as payroll taxes, health insurance and retirement — from the home's own accounting records (CMS cost report, Worksheet A). Contract or agency labor is counted separately, under other operating costs.
$3.0M 70.5% of net patient revenue Info Payroll as a share of revenue: staff salaries and wage-related benefits divided by net patient revenue. A higher figure means more of each revenue dollar goes to staff pay.
Other operating costs Info Everything it costs to run the home apart from payroll — food, utilities, supplies, maintenance, contract labor and administration. Calculated as total operating expense minus payroll (staff salaries and wage-related benefits).
$2.7M
Total costs Info The home's total operating expense for the year — all the costs of running it, salaries included (CMS cost report, Worksheet G-3).
$5.7M

Who this home usually serves

TYPE OF STAY

Mostly short-term rehab stays

Most residents typically stay for a few weeks or months before returning home or moving on.

Most new residents arrive under Medicare (87% of admissions), and a typical Medicare stay runs around 1 - 2 months.

Admissions
52 total

Coverage residents most often arrive under.

Medicare 87%
Private pay 12%
Medicaid 2%
Discharges
53 total

Coverage residents most often leave under.

Medicare 47%
Private pay 38%
Medicaid 15%

Places of interest near Parkside Homes

Address 0.0 miles from city center Info Estimated distance in miles from Hillsboro's city center to Parkside Homes's address, calculated via Google Maps.

Calculate Travel Distance to Parkside Homes

Add your location

Address

Compare Nursing Homes around the area

The information below is reported by the Kansas Department for Aging and Disability Services.

Ascension Living Via Christi Village McLean
NH
AL
IL
MC
SNF
Wichita (Indian Hills) -95 - 47 Studio / 1 Bed
Meadowlark Hills Retirement Community
NH
HC
IL
SNF
Manhattan (Meadowlark Road) -134 - 28 1 Bed / 2 Bed / 3 Bed
Brookdale Rosehill
NH
AL
SNF
Shawnee -92 A+ 54 Studio / 1 Bed
Parkside Homes
NH
AL
IL
SNF
Hillsboro -50 - 65 -
Homestead of Osawatomie
NH
AL
Osawatomie -40 - 13 Suite

Frequently Asked Questions about Parkside Homes

Who is the owner of Parkside Homes?

Parkside Homes is legally operated by City Of Hillsboro, and administered by Stephanie Bryant.

Is Parkside Homes in a walkable area?

Parkside Homes has a walk score of 65. Moderately walkable. Some errands can be accomplished on foot, with a mix of nearby amenities.

What is the license number of Parkside Homes?

According to KS state health department records, Parkside Homes's license number is 175387.

What is the occupancy rate at Parkside Homes?

Parkside Homes's occupancy is 76%.

Does Parkside Homes operate as a for-profit or non-profit?

Parkside Homes is registered as a non-profit in KS.

Who is the administrator of Parkside Homes?

Stephanie Bryant is the administrator of Parkside Homes.

How many beds does Parkside Homes have?

Parkside Homes has 50 beds.

Guides for Better Senior Living

Care Cost Calculator: See Prices in Your Area

Nursing Home Data Explorer

Don’t Wait Too Long: 7 Red Flag Signs Your Parent Needs Assisted Living Now

The True Cost of Assisted Living in 2025 – And How Families Are Paying For It

Understanding Senior Living Costs: Pricing Models, Discounts & Financial Assistance