The Moorings at Lewes Assisted Living
Nursing Home · Delaware, DE
CMS overall rating Info The Overall CMS Rating is scored from 1 to 5 stars and combines results from health inspections, staffing levels, and quality measures. Health inspections carry the most weight. Staffing and quality scores can increase or decrease the final rating based on performance compared to state and national standards.

The Moorings at Lewes Assisted Living

Nursing Home · Delaware, DE
CMS overall rating Info The Overall CMS Rating is scored from 1 to 5 stars and combines results from health inspections, staffing levels, and quality measures. Health inspections carry the most weight. Staffing and quality scores can increase or decrease the final rating based on performance compared to state and national standards.
Calculator: See prices in your area
The Moorings at Lewes Assisted Living accepts Medicare, Medicaid, and private pay.

Overview of The Moorings at Lewes Assisted Living

The Moorings at Lewes is a full-service continuing care retirement community located in Lewes, Delaware. It offers a vibrant lifestyle with a full continuum of care, including independent living, assisted living, memory care, skilled nursing, and rehabilitation services. Residents enjoy maintenance-free living with access to various amenities and activities.
(302) 644-7982

Quality ratings

Measured by Centers for Medicare & Medicaid Services (CMS)

Overall rating Info The Overall CMS Rating combines results from health inspections, staffing levels and quality measures. Health inspections carry the most weight. Staffing and quality scores can increase or decrease the final rating based on performance compared to state and national standards.
▲ 52.9% Above DE avg. ▲ 52.9% Above DE avg.Click the badge to see the full State ranking.Click here to see the full State ranking.
Health Inspection Info Based on the results of the facility's three most recent standard inspections and any complaint investigations. CMS reviews the number, scope, and severity of deficiencies, with more recent findings weighted more heavily.
▲ 85.9% Above DE avg. ▲ 85.9% Above DE avg.Click the badge to see the full State ranking.Click here to see the full State ranking.
Staffing Info Measures average nursing staff hours per resident per day, including Registered Nurses (RNs) and total nursing staff. Ratings are adjusted based on the level of care residents require and are compared to state and national benchmarks.
▲ 26.3% Above DE avg. ▲ 26.3% Above DE avg.Click the badge to see the full State ranking.Click here to see the full State ranking.
Quality Measures Info Based on clinical and physical health indicators reported to CMS, such as hospital readmissions, falls, pressure ulcers, and improvements in mobility. These measures reflect how well residents' health needs are being managed.
▼ 5.4% Below DE avg. ▼ 5.4% Below DE avg.Click the badge to see the full State ranking.Click here to see the full State ranking.

Staffing hours breakdown

Info Daily nursing hours per resident by staff type, reported to CMS. Higher is generally better — compare this facility to state and national averages to see where staffing stands.

Hours per resident per day — compared to Delaware state averages

Total nursing care / resident Info This home is ranked 20th out of 38 homes in Delaware. Total adjusted nursing hours per resident per day, combining RN, LPN, and aide time. CMS adjusts this for case-mix so facilities can be fairly compared.
4h 10m per day
Rank #20 / 38Nurse hours — State benchmarkedThis home is ranked 20th out of 38 homes in Delaware. Shows adjusted nurse hours per resident per day benchmarked to the Delaware average, with a ranking across 38 Delaware SNFs. More hours mean more direct care. The national average is about 3.5 hrs; below 3.0 is a red flag.Click the rank badge to see the full State ranking.Click here to see the full State ranking.
This facility Delaware avg (4h 43m per day)
vs Delaware avg
-12%

3 of 6 metrics below state avg

Standout metric Weekend RN is +95% above state avg
Staff typeHours / Day / Residentvs state avg
Registered Nurse (RN) Info RNs hold the highest nursing license and can assess residents, interpret test results, and direct care plans. More RN hours per day often signals stronger clinical oversight and faster response to health changes. 1h 38m per day ▲ 58% State avg: 1h 2m per day · National avg: 41m per day
LPN / LVN Info Licensed Practical Nurses (LPNs) or Licensed Vocational Nurses (LVNs) deliver routine hands-on care — medication administration, wound dressing, and monitoring vital signs. They work under RN supervision and make up a large share of daily bedside care. 40m per day ▼ 34% State avg: 1h 1m per day · National avg: 52m per day
Nurse Aide Info Certified Nurse Aides (CNAs) provide the most direct day-to-day assistance: bathing, dressing, feeding, and mobility. Nurse aide hours are typically the largest staffing category and directly affect residents' quality of life. 2h 15m per day ▼ 9% State avg: 2h 28m per day · National avg: 2h 20m per day
Weekend Total Nursing Info Combined nursing hours (RN + LPN + Nurse Aide) per resident per day on weekends. Staffing often drops on weekends — this figure reveals whether the facility maintains adequate coverage outside of weekday hours. 3h 55m per day ▼ 3% State avg: 4h 2m per day · National avg: 3h 26m per day
Physical Therapist Info Hours per resident per day provided by licensed Physical Therapists (PTs) or PT Assistants. PT services help residents recover mobility after injury or illness and are especially important for post-acute (short-stay) rehabilitation. 14m per day ▲ 56% State avg: 9m per day · National avg: 4m per day
Weekend RN Info Registered nurse hours specifically on weekends. Facilities sometimes reduce RN presence on Saturdays and Sundays — a low weekend RN figure compared to weekday hours can indicate reduced clinical oversight when most administrative staff are absent. 1h 24m per day ▲ 95% State avg: 43m per day · National avg: 28m per day

Capacity and availability

This home usually has availability

Occupancy lower than 85% suggests more openings may be available.

Higher occupancy than the Delaware average: 80.7%
Occupancy rate 83.5% Rank #26 / 44Occupancy rate — State benchmarkedThis home is ranked 26th out of 44 homes in Delaware. Shows this facility's occupancy rate versus the Delaware average, with its Statewide rank out of 44. Higher occupancy signals strong local demand and financial stability.Click the rank badge to see the full State ranking.Click here to see the full State ranking.
Avg. Length of Stay 86 days
Occupancy rate
83.5% Rank #26 / 44Occupancy rate — State benchmarkedThis home is ranked 26th out of 44 homes in Delaware. Shows this facility's occupancy rate versus the Delaware average, with its Statewide rank out of 44. Higher occupancy signals strong local demand and financial stability.Click the rank badge to see the full State ranking.Click here to see the full State ranking.
Avg. Length of Stay
86 days
Bed community size
45-bed community Rank #65 / 72Bed count — State benchmarkedThis home is ranked 65th out of 72 homes in Delaware. Shows this facility's certified or reported bed count compared to other Delaware SNFs. Larger communities may offer more amenities, programs, and on-site services for residents and families.Click the rank badge to see the full State ranking.Click here to see the full State ranking.
A moderately sized community that may balance personal attention with shared amenities and social activities.
Walk Score
Walk Score: 65 / 100 Rank #21 / 111Walk Score — State benchmarkedThis home is ranked 21st out of 111 homes in Delaware. Shows how walkable this facility's neighborhood is compared to the average Walk Score across Delaware SNFs. Higher scores benefit residents, families, and staff.Click the rank badge to see the full State ranking.Click here to see the full State ranking.
Moderately walkable. Some errands can be accomplished on foot, with a mix of nearby amenities.

About this community

License Details

Facility TypeAssisted Living
StatusActive
IssuanceOctober 1, 2025
ExpirationSeptember 30, 2026
License Number2137
CMS Certification Number085053

Ownership & Operating Entity

The Moorings at Lewes Assisted Living is administrated by Annette V Moore.

Staffing

Key information about the people who lead and staff this community.

Leadership

Director of NursingLori DiBiase Warrington

Therapy & Rehabilitation

1 service
Rehabilitation Services

Contact Information

Contact The Moorings at Lewes Assisted Living

Inspection History

In Delaware, the Department of Health and Social Services, Division of Health Care Quality is responsible for the oversight, unannounced inspection, and licensing of all long-term care settings.

Read the full inspection reports for this facility, including detailed findings and corrective actions.

Show Inspection Reports

Health Inspection History

Inspections since 2022
Total health inspections 2

Delaware average 4.4


Last Health inspection on Jan 2024
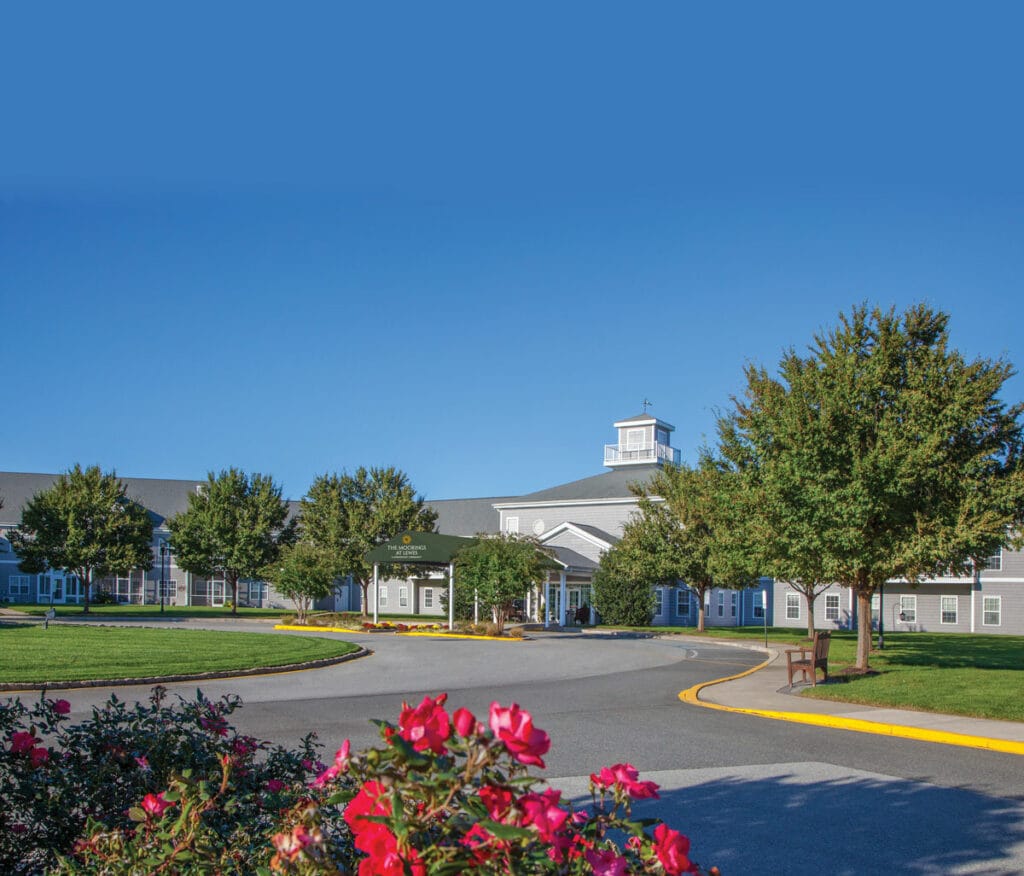
Total health citations
4 Rank #1 / 39Health citations — State benchmarkedThis home is ranked 1st out of 39 homes in Delaware. Shows this facility's total health deficiency citations benchmarked to the Delaware State average, with a ranking across all 39 DE SNFs. Lower citation counts earn a better rank.Click the rank badge to see the full State ranking.Click here to see the full State ranking.

Delaware average 38.9

Citations per inspection
2 Rank #1 / 39Citations per inspection — State benchmarkedThis home is ranked 1st out of 39 homes in Delaware. Shows average deficiency citations per CMS inspection for this facility versus the Delaware mean across 39 SNFs with citation data. Lower is better.Click the rank badge to see the full State ranking.Click here to see the full State ranking.

Delaware average 8.72


Health citations are formal notices following inspections when they fail to comply with safety and care standards.

All 4 citations resulted from standard inspections.

Breakdown of citation severity (last 4 years)
Critical Health citations
0
100% better than Delaware average

Delaware average: 0.9


Serious Health citations
0
100% better than Delaware average

Delaware average: 1.2

0 critical citations Delaware average: 0.9

0 serious citations Delaware average: 1.2

4 moderate citations Delaware average: 35.7

0 minor citations Delaware average: 1
Citations history (last 4 years)
Nutrition moderate citation Jan 22, 2024
Corrected

Pharmacy moderate citation Jan 22, 2024
Corrected

Quality of Care moderate citation Dec 22, 2022
Corrected

Resident Rights moderate citation Dec 22, 2022
Corrected

Staffing Data

Reporting period: October 1 – December 31, 2025 (Q4 2025). Source: CMS Payroll-Based Journal report.

Total staff 89
Employees 77
Contractors 12
Staff to resident ratio 2.62:1
61% better than Delaware average
Delaware average ratio: 1.63:1 Delaware average ratio: 1.63:1See full Delaware ranking
Avg staff/day 27
Average shift 7.8 hours
0% compared with Delaware average
Delaware average: 7.6 hours Delaware average shift: 7.6 hoursSee full Delaware ranking
Total staff hours (quarter) 19,408

Nursing staff breakdown

Q4 2025 · Oct 1 – Dec 31 More info This data comes from the CMS Payroll-Based Journal report covering October 1 – December 31, 2025.
Registered Nurse

Manages medical care and health needs.

RN Staff 13
Average shift length Info Average shift length. Calculated as total hours divided by days worked and average staff per day. 11.7 hours

No contractors work on this role.

Licensed Practical Nurse

Assists with medical care and medications.

LPN Staff 7
Average shift length Info Average shift length. Calculated as total hours divided by days worked and average staff per day. 9.8 hours

This role is partially covered by contractors.

Certified Nursing Assistant

Helps with daily care and mobility.

CNA Staff 38
Average shift length Info Average shift length. Calculated as total hours divided by days worked and average staff per day. 9.3 hours

This role is partially covered by contractors.

Contractor staffing

Q4 2025 · Oct 1 – Dec 31 More info This data comes from the CMS Payroll-Based Journal report covering October 1 – December 31, 2025.

Total hours from contractors

9.5%

1,835 contractor hours this quarter

Certified Nursing Assistant: 5 Licensed Practical Nurse: 2 Feeding Assistant: 2 Occupational Therapy Aide: 1 Medical Director: 1 Occupational Therapy Assistant: 1

Staff by category

Q4 2025 · Oct 1 – Dec 31 More info This data comes from the CMS Payroll-Based Journal report covering October 1 – December 31, 2025.
Certified Nursing Assistant335387,19292100%9.3
Registered Nurse130134,20592100%11.7
Licensed Practical Nurse5271,91492100%9.8
Other Dietary Services Staff5051,55792100%6.5
Respiratory Therapy Technician5057357278%4.6
Administrator1015126470%8
Nurse Practitioner1014806065%8
Clinical Nurse Specialist1014725964%8
Dietitian1014645863%8
Occupational Therapy Aide0114245358%8
Speech Language Pathologist5053837278%3.8
Physical Therapy Aide4042816773%2.3
Mental Health Service Worker1012803538%8
Physical Therapy Assistant1012685155%5.3
Medical Director0111488390%1.8
Qualified Social Worker101682628%2.6
Feeding Assistant0222022%5
Occupational Therapy Assistant011633%2
38 Certified Nursing Assistant
% of Days 100%
13 Registered Nurse
% of Days 100%
7 Licensed Practical Nurse
% of Days 100%
5 Other Dietary Services Staff
% of Days 100%
5 Respiratory Therapy Technician
% of Days 78%
1 Administrator
% of Days 70%
1 Nurse Practitioner
% of Days 65%
1 Clinical Nurse Specialist
% of Days 64%
1 Dietitian
% of Days 63%
1 Occupational Therapy Aide
% of Days 58%
5 Speech Language Pathologist
% of Days 78%
4 Physical Therapy Aide
% of Days 73%
1 Mental Health Service Worker
% of Days 38%
1 Physical Therapy Assistant
% of Days 55%
1 Medical Director
% of Days 90%
1 Qualified Social Worker
% of Days 28%
2 Feeding Assistant
% of Days 2%
1 Occupational Therapy Assistant
% of Days 3%

Penalties and fines

Federal penalties imposed by CMS for regulatory violations, including civil money penalties (fines) and denials of payment for new Medicare/Medicaid admissions.

Source: CMS Penalties Database

No penalties in the past 3 years

No civil money penalties or payment denials were reported in the last 3 years.

Quality of care over time

These measures show how residents usually do over time at this home, based on health outcomes and preventive care.

High-risk clinical events score Info A composite score based on pressure ulcers, falls with injury, weight loss, walking ability decline, and activities of daily living decline. 9.6
In line with Delaware average

Delaware average: 9.6

Functional decline score Info A composite score based on activities of daily living decline, walking ability decline, and incontinence. 19.5
In line with Delaware average

Delaware average: 19.0

Long-stay resident measures
Significantly above average Delaware avg: 3.8 Info CMS star rating based on long-stay quality measure performance. 5 stars = significantly above average, 1 star = significantly below average.
Need for Help with Daily Activities Increased Info Percent of long-stay residents whose need for help with daily activities has increased 13.7%
11% better than Delaware average

Delaware average: 15.4%

Walking Ability Worsened Info Percent of long-stay residents whose ability to move independently worsened 24.3%
22% worse than Delaware average

Delaware average: 19.8%

Low Risk Residents with Bowel/Bladder Incontinence Info Percent of low risk long-stay residents who lose control of their bowels or bladder 20.5%
7% better than Delaware average

Delaware average: 22.1%

Falls with Major Injury Info Percent of long-stay residents experiencing one or more falls with major injury 0.0%
100% better than Delaware average

Delaware average: 3.0%

High Risk Residents with Pressure Ulcers Info Percent of long-stay high risk residents with pressure ulcers 3.7%
17% better than Delaware average

Delaware average: 4.4%

Urinary Tract Infection Info Percent of long-stay residents with a urinary tract infection 4.6%
113% worse than Delaware average

Delaware average: 2.1%

Lost Too Much Weight Info Percent of long-stay residents who lose too much weight 6.1%
6% worse than Delaware average

Delaware average: 5.8%

Depressive Symptoms Info Percent of long-stay residents who have depressive symptoms 5.8%
In line with Delaware average

Delaware average: 6.0%

Antipsychotic Use Info Percent of long-stay residents who received an antipsychotic medication 9.9%
10% better than Delaware average

Delaware average: 11.0%

Pneumococcal Vaccine Info Percent of long-stay residents assessed and appropriately given the pneumococcal vaccine 100.0%
5% better than Delaware average

Delaware average: 95.3%

Influenza Vaccine Info Percent of long-stay residents assessed and appropriately given the seasonal influenza vaccine 100.0%
In line with Delaware average

Delaware average: 97.4%

Hospitalizations per 1,000 days Info Number of hospitalizations per 1,000 long-stay resident days. 0.66
64% better than Delaware average

Delaware average: 1.83

ED visits per 1,000 days Info Number of outpatient emergency department visits per 1,000 long-stay resident days. 0.63
54% better than Delaware average

Delaware average: 1.37

Short-stay resident measures
Above average Delaware avg: 3.4 Info CMS star rating based on short-stay quality measure performance. 5 stars = much above average, 1 star = much below average.
Pneumococcal Vaccine Info Percent of short-stay residents assessed and appropriately given the pneumococcal vaccine 96.1%
17% better than Delaware average

Delaware average: 82.1%

Antipsychotic medication increase Info Percent of short-stay residents who newly received an antipsychotic medication 1.9%
111% worse than Delaware average

Delaware average: 0.9%

Influenza Vaccine Info Percent of short-stay residents assessed and appropriately given the seasonal influenza vaccine 98.7%
19% better than Delaware average

Delaware average: 83.1%

Re-hospitalized after SNF stay Info Percentage of short-stay residents who were re-hospitalized after their nursing home admission. 26.6%
24% worse than Delaware average

Delaware average: 21.5%

Emergency department visits Info Percentage of short-stay residents who had an outpatient emergency department visit. 8.0%
29% better than Delaware average

Delaware average: 11.2%

Falls with major injury Info Percentage of SNF residents who experience falls with major injury during their stay. 0.8%
5% worse than Delaware average

Delaware average: 0.8%

Ability to care for self at discharge Info Percentage of residents at or above expected ability to care for themselves at discharge. 36.8%
31% worse than Delaware average

Delaware average: 53.7%

Successful return to home or community Info Rate of successful return to home or community from a skilled nursing facility. 67.4%
33% better than Delaware average

Delaware average: 50.6%

Breakdown by payment type

Medicare

67% of new residents, usually for short-term rehab.

Typical stay 27 days

Private pay

32% of new residents, often for short stays.

Typical stay 1 - 2 years

Medicaid

1% of new residents, often for long-term daily care.

Typical stay 3 - 4 years

Facility Characteristics

Source: CMS Long-Term Care Facility Characteristics (Data as of Jan 2026)

Total residents 34
Private pay or other
34
100% of residents
Programs & Services
Residents Group

Residents meet regularly to discuss policies, care quality, and activities

CCRC

Part of a Continuing Care Retirement Community offering multiple care levels

Active Resident Council

Organized group of residents that meets regularly to discuss facility policies, quality of life, and activities.

Finances and operations

Voluntary non-profit community
Home revenue
$19.6M
Surplus of revenue
$1.8M
Voluntary non-profit community
Home revenue
$19.6M Rank #19 / 35Revenue — State benchmarkedThis home is ranked 19th out of 35 homes in Delaware. Shows this facility's annual revenue compared to the Delaware SNF average. Higher revenue generally means more resources for staffing and capital — read alongside Payroll %.Click the rank badge to see the full State ranking.Click here to see the full State ranking.
Surplus of revenue
$1.8M
Payroll costs Info The portion of the home's budget spent on staff, including nurses, caregivers, and other employees who support care and operations. Rank #34 / 35Payroll — State benchmarkedThis home is ranked 34th out of 35 homes in Delaware. Shows total annual staff payroll benchmarked to the Delaware average. Higher payroll investment relative to peers often signals better staffing and less reliance on cheaper contract labor.Click the rank badge to see the full State ranking.Click here to see the full State ranking.
$6.9M
35.2% of revenue Rank #28 / 35Payroll % — State benchmarkedThis home is ranked 28th out of 35 homes in Delaware. Shows payroll as a percentage of revenue versus the Delaware average. Well-run Delaware SNFs typically land around 52–60% — the top third Statewide. Below 25% may signal understaffing or heavy agency use — read with Staffing ratings.Click the rank badge to see the full State ranking.Click here to see the full State ranking.
Other operating costs Info All remaining costs needed to run the home, such as food, utilities, building maintenance, supplies and administrative expenses.
$10.8M
Total costs $17.7M

Who this home usually serves

TYPE OF STAY

Mostly short-term rehab stays

Most residents typically stay for a few weeks or months before returning home or moving on.

Places of interest near The Moorings at Lewes Assisted Living

Address 0.0 miles from city center Info Estimated distance in miles from Lewes's city center to The Moorings at Lewes Assisted Living's address, calculated via Google Maps.

Calculate Travel Distance to The Moorings at Lewes Assisted Living

Add your location

Address

Financial Assistance for
Nursing Home in Delaware

The Moorings at Lewes Assisted Living is located in Lewes, Delaware.
Here are the financial assistance programs available to residents in Delaware.

Get Financial aid guidance

Elderly and Disabled Waiver

Delaware Medicaid E&D Waiver

Age 65+ or disabled
General Delaware resident, Medicaid- eligible, nursing home-level care need.
Income Limits (2025) ~$2,829/month 300% FBR, individual
Asset Limits $2,000 (individual), $3,000 (couple).
DE

Small state, faster processing in some areas.

Benefits
Personal care (5-7 hours/day) Respite (240 hours/year) Adult day care (~$60/day) Home modifications

Delaware Caregiver Support Program

DE Caregiver Support (NFCSP)

Age Caregiver of someone 60+
General Delaware resident.
Income Limits No strict limit; prioritizes low-income.
Asset Limits Not applicable.
DE

Limited slots; rural focus.

Benefits
In-home respite (4-6 hours/day) Adult day care (~$60/day) Short-term facility care (up to 5 days)

Program of All-Inclusive Care for the Elderly (PACE)

Delaware Medicaid PACE

Age 55+
General Delaware resident, nursing home-level care need, safe with PACE support.
Income Limits (2025) ~$2,829/month 300% FBR
Asset Limits $2,000 (individual), $3,000 (couple).
DE

Limited to specific areas (e.g., New Castle County); few providers.

Benefits
Personal care (5-7 hours/day) Medical care Meals Transportation Therapy

Medicare Savings Program (MSP)

Delaware Medicare Savings Program

Age 65+ or disabled
General Delaware resident, enrolled in Medicare Part A/B.
Income Limits (2025) ~$2,510/month (QMB), ~$3,380/month (SLMB), ~$3,598/month (QI)—individual, adjusted annually.
Asset Limits $9,430 (individual), $14,130 (couple).
DE

Three tiers; broader limits than some states.

Benefits
Covers Medicare Part B premiums ($174.70/month) Deductibles ($240/year) Copays (~20% of services)

Compare Nursing Home around Delaware

The information below is reported by the Delaware Department of Health and Social Services, Division of Health Care Quality.

4 facilities compared · CMS & DE Dept. of Health data

Filter by care type
The Moorings at Lewes Assisted Living
NH

Nursing Home Licensed facility providing 24/7 skilled nursing care for residents with complex, ongoing medical needs. Staffed by RNs, LPNs, and CNAs. Inspected and star-rated annually by CMS. Accepts Medicare (short-term rehab) and Medicaid (long-term care).

AL

Assisted Living A licensed, long-term care setting for seniors or individuals with disabilities who need help with daily activities — like bathing, dressing, and medication management — but not 24-hour skilled nursing. Offers housing, meals, and around-the-clock support while aiming to maximize resident independence.

Lewes (Lewes Historic District)45 83.5% +3%4.16 +16%-11%$042.0-34 65 Springpoint Senior Living Inc$19.6M$6.9M35.2%85053
Westminster Village Assisted Living
NH

Nursing Home Licensed facility providing 24/7 skilled nursing care for residents with complex, ongoing medical needs. Staffed by RNs, LPNs, and CNAs. Inspected and star-rated annually by CMS. Accepts Medicare (short-term rehab) and Medicaid (long-term care).

AL

Assisted Living A licensed, long-term care setting for seniors or individuals with disabilities who need help with daily activities — like bathing, dressing, and medication management — but not 24-hour skilled nursing. Offers housing, meals, and around-the-clock support while aiming to maximize resident independence.

IL

Independent Living Lifestyle-focused communities for older adults offering dining, activities, and transportation with minimal personal care. Best for active, independent seniors who want community without medical support.

MC

Memory Care Secured, specialized care for people living with Alzheimer's or dementia. Staff trained in cognitive impairment, with higher staff-to-resident ratios and an environment designed to reduce confusion and wandering risk.

Dover (The Hamlet)99 85.2% +6%4.33 +37%-7%$15.6k285.6365 35 Phi$23.2M$8.7M37.6%85032
Meadowcrest at Middletown
NH

Nursing Home Licensed facility providing 24/7 skilled nursing care for residents with complex, ongoing medical needs. Staffed by RNs, LPNs, and CNAs. Inspected and star-rated annually by CMS. Accepts Medicare (short-term rehab) and Medicaid (long-term care).

AL

Assisted Living A licensed, long-term care setting for seniors or individuals with disabilities who need help with daily activities — like bathing, dressing, and medication management — but not 24-hour skilled nursing. Offers housing, meals, and around-the-clock support while aiming to maximize resident independence.

IL

Independent Living Lifestyle-focused communities for older adults offering dining, activities, and transportation with minimal personal care. Best for active, independent seniors who want community without medical support.

MC

Memory Care Secured, specialized care for people living with Alzheimer's or dementia. Staff trained in cognitive impairment, with higher staff-to-resident ratios and an environment designed to reduce confusion and wandering risk.

Middletown90 92.6% +15%4.01 -31%-14%$61.5k4110.34112 10 -$23.3M$8.4M36.2%85050
Kutz Senior Living Campus
NH

Nursing Home Licensed facility providing 24/7 skilled nursing care for residents with complex, ongoing medical needs. Staffed by RNs, LPNs, and CNAs. Inspected and star-rated annually by CMS. Accepts Medicare (short-term rehab) and Medicaid (long-term care).

AL

Assisted Living A licensed, long-term care setting for seniors or individuals with disabilities who need help with daily activities — like bathing, dressing, and medication management — but not 24-hour skilled nursing. Offers housing, meals, and around-the-clock support while aiming to maximize resident independence.

MC

Memory Care Secured, specialized care for people living with Alzheimer's or dementia. Staff trained in cognitive impairment, with higher staff-to-resident ratios and an environment designed to reduce confusion and wandering risk.

Wilmington90 82.7% +2%5.21 -83%+12%$168.0k5914.8474 41 David Bacher$16.5M$8.6M52.1%85043

Frequently Asked Questions about The Moorings at Lewes Assisted Living

What neighborhood is The Moorings at Lewes Assisted Living in?

The Moorings at Lewes Assisted Living is in the Lewes Historic District neighborhood of Lewes.

Who is the Director of Nursing at The Moorings at Lewes Assisted Living?

Lori DiBiase Warrington is the Director of Nursing at The Moorings at Lewes Assisted Living.

Is The Moorings at Lewes Assisted Living in a walkable area?

The Moorings at Lewes Assisted Living has a walk score of 65. Moderately walkable. Some errands can be accomplished on foot, with a mix of nearby amenities.

What is the license number of The Moorings at Lewes Assisted Living?

According to DE state health department records, The Moorings at Lewes Assisted Living's license number is 2137.

When does The Moorings at Lewes Assisted Living's license expire?

According to DE state health department records, The Moorings at Lewes Assisted Living's license expires on September 30, 2026.

What is the best email address for The Moorings at Lewes Assisted Living?

The team at The Moorings at Lewes Assisted Living can be reached at [email protected].

Who is the administrator of The Moorings at Lewes Assisted Living?

Annette V Moore is the administrator of The Moorings at Lewes Assisted Living.

Guides for Better Senior Living

Care Cost Calculator: See Prices in Your Area

Nursing Home Data Explorer

Don’t Wait Too Long: 7 Red Flag Signs Your Parent Needs Assisted Living Now

The True Cost of Assisted Living in 2025 – And How Families Are Paying For It

Understanding Senior Living Costs: Pricing Models, Discounts & Financial Assistance

Explore Open Rooms
1 Contact details
2 What type of senior care service are you looking for?
3 What budget do you have in mind for senior care?
4 How soon do you need to find care?
5 Additional details

Thank you for your interest!

Our team will be in touch shortly to help with next steps.