

Total health inspections
4
South Carolina average 3.9
Last Health inspection on Jul 2025

We arrange tours, appointments, and even moving support so you don’t have to
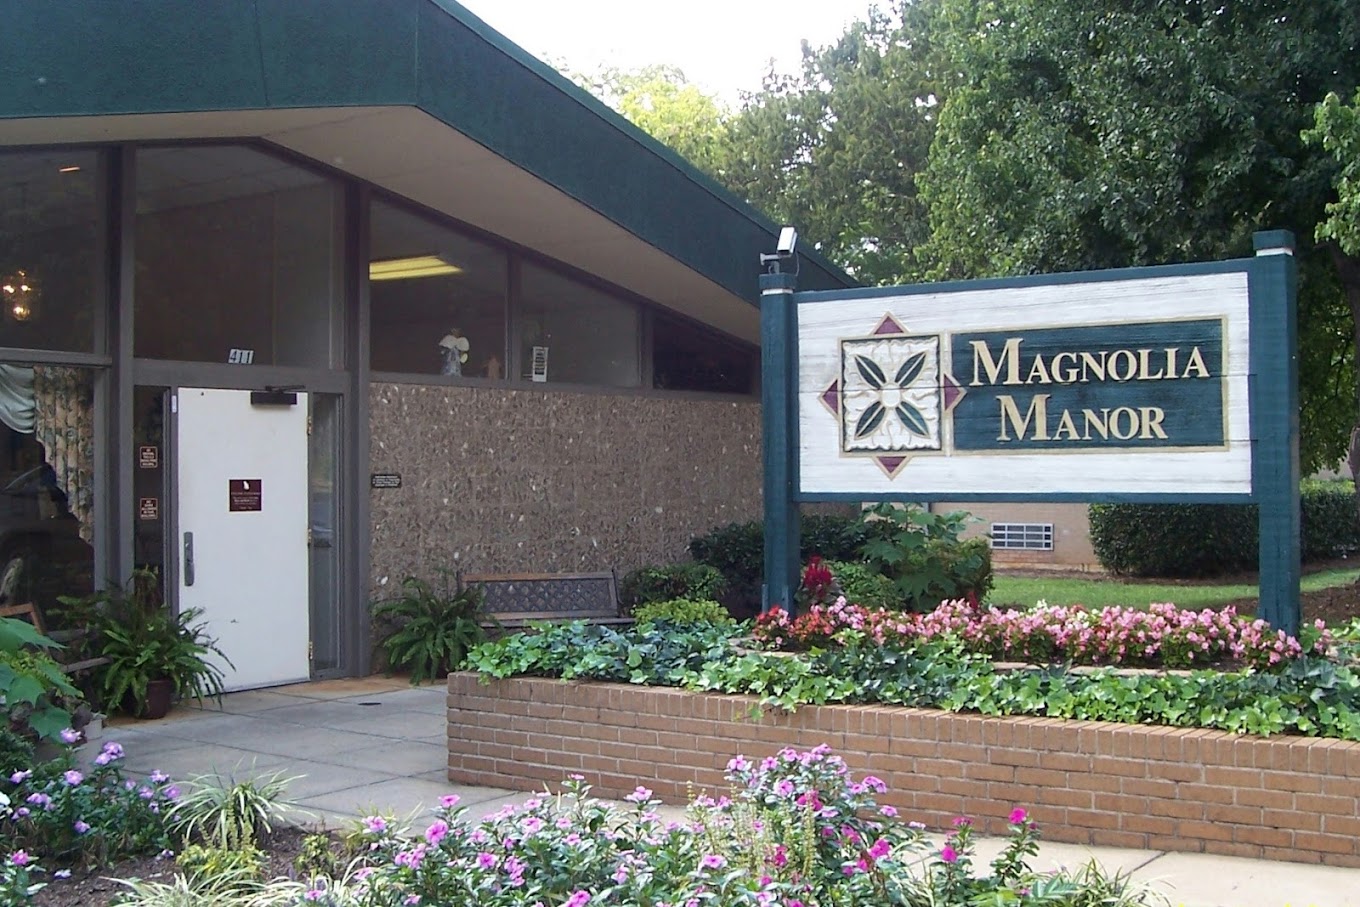
Set in the area of Greenville, SC, Magnolia Manor of Greenville is a trusted senior care provider, offering comprehensive health care services, including rehabilitation, skilled nursing, long-term care, short-term care, and more. Residents here are guaranteed to receive the care and support they need with the help of a highly reliable care team, available to offer an extensive array of services designed to make residents’ recovery process easier. Comfortable accommodations are offered to provide residents with a relaxing healing environment that allows residents to focus on their well-being and enrichment.
The community deeply connects with its residents to fully understand and relate to their pain points and provide them with the appropriate support that effectively addresses their needs and preferences. Residents here are also empowered to maintain a full-connected lifestyle with an array of engaging activities to keep them happy and motivated. Here, residents are provided with an environment where they can thrive and feel rejuvenated during their recovery period.
| Staff type | Hours / Day / Resident | vs state avg |
|---|---|---|
|
Registered Nurse (RN)
| 42m per day | ▲ 11% State avg: 38m per day · National avg: 41m per day |
|
LPN / LVN
| 39m per day | ▼ 37% State avg: 1h 1m per day · National avg: 52m per day |
|
Nurse Aide
| 1h 54m per day | ▼ 15% State avg: 2h 13m per day · National avg: 2h 21m per day |
|
Weekend Total Nursing
| 2h 43m per day | ▼ 18% State avg: 3h 20m per day · National avg: 3h 26m per day |
|
Physical Therapist
| 1m per day | ▼ 75% State avg: 5m per day · National avg: 4m per day |
|
Weekend RN
| 22m per day | ▼ 10% State avg: 24m per day · National avg: 29m per day |
Magnolia Manor of Greenville is legally operated by Thi Of South Carolina At Greenville Llc, and administrated by Tonya Bryant.
Key information about the people who lead and staff this community.
In South Carolina, the Department of Public Health, Bureau of Healthcare Quality conducts unannounced inspections to ensure care providers meet all health and safety codes.
Deficiencies
| This Facility | SC Average | vs. SC Avg |
|---|---|---|---|
|
Total deficiencies
| 21 | 12 | This facility has 75% more total deficiencies than a typical South Carolina nursing home (21 vs. SC avg 12).↑ 75% worse |
|
Deficiencies per year
| 5.3 | 3 | This facility has 77% more deficiencies per year than a typical South Carolina nursing home (5.3 vs. SC avg 3).↑ 77% worse |
South Carolina average 3.9
Last Health inspection on Jul 2025
South Carolina average 13.7
South Carolina average 3.44
Health citations are formal notices following inspections when they fail to comply with safety and care standards.
5 of 11 citations resulted from standard inspections; 1 of 11 resulted from complaint investigations; and 5 of 11 came from combined inspections (standard and complaint).
South Carolina average: 1
South Carolina average: 0.3
Reporting period: October 1 – December 31, 2025 (Q4 2025). Source: CMS Payroll-Based Journal report.
Manages medical care and health needs.
Assists with medical care and medications.
Helps with daily care and mobility.
Total hours from contractors
6,124 contractor hours this quarter
| Certified Nursing Assistant | 43 | 60 | 103 | 16,196 | 92 | 100% | 7.6 |
| Licensed Practical Nurse | 13 | 35 | 48 | 5,455 | 92 | 100% | 8.7 |
| Registered Nurse | 14 | 0 | 14 | 3,814 | 92 | 100% | 8.7 |
| Clinical Nurse Specialist | 5 | 1 | 6 | 1,767 | 65 | 71% | 8 |
| Speech Language Pathologist | 0 | 3 | 3 | 545 | 64 | 70% | 6.5 |
| Mental Health Service Worker | 1 | 0 | 1 | 536 | 72 | 78% | 7.4 |
| Physical Therapy Aide | 0 | 3 | 3 | 519 | 65 | 71% | 6.4 |
| Administrator | 1 | 0 | 1 | 504 | 63 | 68% | 8 |
| Nurse Practitioner | 1 | 0 | 1 | 424 | 53 | 58% | 8 |
| Dietitian | 1 | 0 | 1 | 408 | 59 | 64% | 6.9 |
| Dental Services Staff | 1 | 0 | 1 | 375 | 58 | 63% | 6.5 |
| Other Dietary Services Staff | 4 | 0 | 4 | 272 | 45 | 49% | 5.9 |
| Qualified Social Worker | 0 | 2 | 2 | 194 | 41 | 45% | 4.7 |
| Physical Therapy Assistant | 0 | 4 | 4 | 189 | 70 | 76% | 2.6 |
| Respiratory Therapy Technician | 0 | 2 | 2 | 175 | 61 | 66% | 2.4 |
| RN Director of Nursing | 1 | 0 | 1 | 56 | 6 | 7% | 9.4 |
| Occupational Therapy Aide | 0 | 1 | 1 | 47 | 3 | 3% | 15.5 |
| Medical Director | 0 | 1 | 1 | 42 | 3 | 3% | 14 |
| Qualified Activities Professional | 0 | 1 | 1 | 2 | 1 | 1% | 2 |
Includes penalties issued in 2024
Federal penalties imposed by CMS for regulatory violations, including civil money penalties (fines) and denials of payment for new Medicare/Medicaid admissions.
Source: CMS Penalties Database (Data as of Jan 2026)
South Carolina average: $34K
South Carolina average: 2.4
South Carolina average: 0.1
Penalties are imposed by CMS for violations of federal nursing home regulations.
1 penalty in the past 3 years
Jun 21, 2024 · $4K
Last updated: Jan 2026
These measures show how residents usually do over time at this home, based on health outcomes and preventive care.
South Carolina average: 8.7
South Carolina average: 15.5
South Carolina average: 13.1%
South Carolina average: 16.2%
South Carolina average: 17.0%
South Carolina average: 3.0%
South Carolina average: 6.1%
South Carolina average: 1.6%
South Carolina average: 6.2%
South Carolina average: 2.8%
South Carolina average: 14.5%
South Carolina average: 90.5%
South Carolina average: 90.6%
South Carolina average: 2.03
South Carolina average: 1.91
South Carolina average: 79.5%
South Carolina average: 1.7%
South Carolina average: 78.0%
South Carolina average: 0.8%
South Carolina average: 50.6%
Quality measures are calculated from Minimum Data Set (MDS) assessments. For most measures, lower percentages indicate better care quality.
24% of new residents, usually for short-term rehab.
62% of new residents, often for short stays.
14% of new residents, often for long-term daily care.
Source: CMS Long-Term Care Facility Characteristics (Data as of Jan 2026)
Residents meet regularly to discuss policies, care quality, and activities
State-approved Nurse Aide Training and Competency Evaluation Program on-site
Organized group of residents that meets regularly to discuss facility policies, quality of life, and activities.
Data sourced from CMS Long-Term Care Facility Characteristics quarterly report. Payer mix reflects the current resident census by primary payment source.
Historical financial and operational data for Magnolia Manor of Greenville based on CMS SNF Cost Reports.
Building Type: Single-story
Residents typically stay for brief periods, with frequent admissions and discharges throughout the year.
![]() 1.8 miles from city center
1.8 miles from city center
![]() Estimated distance in miles from Greenville's city center to Magnolia Manor of Greenville's address, calculated via Google Maps.
— 1.32 miles to nearest hospital (Prisma Health Marshall I. Pickens Hospital)
Estimated distance in miles from Greenville's city center to Magnolia Manor of Greenville's address, calculated via Google Maps.
— 1.32 miles to nearest hospital (Prisma Health Marshall I. Pickens Hospital)
Add your location
Magnolia Manor of Greenville is located in Greenville, South Carolina.
Here are the financial assistance programs available to residents in South Carolina.
The information below is reported by the South Carolina Department of Public Health, Bureau of Healthcare Quality.
| Rolling Green Village Assisted Living Facility |
NH Nursing Home Licensed facility providing 24/7 skilled nursing care for residents with complex, ongoing medical needs. Staffed by RNs, LPNs, and CNAs. Inspected and star-rated annually by CMS. Accepts Medicare (short-term rehab) and Medicaid (long-term care).
AL Assisted Living A licensed, long-term care setting for seniors or individuals with disabilities who need help with daily activities — like bathing, dressing, and medication management — but not 24-hour skilled nursing. Offers housing, meals, and around-the-clock support while aiming to maximize resident independence. | Greenville | 52
Facility
52
SC AVG
90
Rank
#242 / 309 | - | - | 7.49
Facility
7.49
SC AVG
4.00
Rank
#2 / 112 | +18% | +87% | $0
Facility
$0
SC AVG
$34.8k
Rank
#76 / 114 | 5
Facility
5
SC AVG
13.7
Rank
#11 / 113 | 1.7
Facility
1.7
SC AVG
3.4
Rank
#10 / 113 | 2 | 18 | A+ | - | Rolling Green Village | $25.2M
Facility
$25.2M
SC AVG
$13.0M
Rank
#11 / 116 | $12.2M
Facility
$12.2M
SC AVG
$5.4M
Rank
#8 / 116 | 48.2%
Facility
48.2%
SC AVG
44%
Rank
#57 / 116 | 425160 | ||||
| Linville Court at The Cascades Verdae |
NH Nursing Home Licensed facility providing 24/7 skilled nursing care for residents with complex, ongoing medical needs. Staffed by RNs, LPNs, and CNAs. Inspected and star-rated annually by CMS. Accepts Medicare (short-term rehab) and Medicaid (long-term care).
AL Assisted Living A licensed, long-term care setting for seniors or individuals with disabilities who need help with daily activities — like bathing, dressing, and medication management — but not 24-hour skilled nursing. Offers housing, meals, and around-the-clock support while aiming to maximize resident independence.
MC Memory Care Secured, specialized care for people living with Alzheimer's or dementia. Staff trained in cognitive impairment, with higher staff-to-resident ratios and an environment designed to reduce confusion and wandering risk. | Greenville (Cascades Verdae) | 44
Facility
44
SC AVG
90
Rank
#272 / 309 |
85.2%
Facility
85.2%
SC AVG
82.1%
Rank
#66 / 122 | +4% | 6.16
Facility
6.16
SC AVG
4.00
Rank
#5 / 112 | +3% | +54% | $0
Facility
$0
SC AVG
$34.8k
Rank
#52 / 114 | 6
Facility
6
SC AVG
13.7
Rank
#17 / 113 | 2.0
Facility
2.0
SC AVG
3.4
Rank
#13 / 113 | 1 | 41 | - |
8
Facility
8
SC AVG
32
Rank
#198 / 232 | Banyan Greenville LLC | $34.0M
Facility
$34.0M
SC AVG
$13.0M
Rank
#7 / 116 | $8.2M
Facility
$8.2M
SC AVG
$5.4M
Rank
#35 / 116 | 24.3%
Facility
24.3%
SC AVG
44%
Rank
#116 / 116 | 425392 | ||||
| Magnolia Manor of Greenville |
NH Nursing Home Licensed facility providing 24/7 skilled nursing care for residents with complex, ongoing medical needs. Staffed by RNs, LPNs, and CNAs. Inspected and star-rated annually by CMS. Accepts Medicare (short-term rehab) and Medicaid (long-term care).
AL Assisted Living A licensed, long-term care setting for seniors or individuals with disabilities who need help with daily activities — like bathing, dressing, and medication management — but not 24-hour skilled nursing. Offers housing, meals, and around-the-clock support while aiming to maximize resident independence.
IL Independent Living Lifestyle-focused communities for older adults offering dining, activities, and transportation with minimal personal care. Best for active, independent seniors who want community without medical support.
MC Memory Care Secured, specialized care for people living with Alzheimer's or dementia. Staff trained in cognitive impairment, with higher staff-to-resident ratios and an environment designed to reduce confusion and wandering risk. | Greenville (Green Avenue) | 99
Facility
99
SC AVG
90
Rank
#118 / 309 | - | - | 3.35
Facility
3.35
SC AVG
4.00
Rank
#82 / 112 | -24% | -16% | $4.3k
Facility
$4.3k
SC AVG
$34.8k
Rank
#44 / 114 | 11
Facility
11
SC AVG
13.7
Rank
#52 / 113 | 2.8
Facility
2.8
SC AVG
3.4
Rank
#42 / 113 | - | 93 | - |
66
Facility
66
SC AVG
32
Rank
#8 / 232 | Tonya Bryant | $10.2M
Facility
$10.2M
SC AVG
$13.0M
Rank
#86 / 116 | $5.1M
Facility
$5.1M
SC AVG
$5.4M
Rank
#83 / 116 | 49.5%
Facility
49.5%
SC AVG
44%
Rank
#50 / 116 | 425090 | ||||
| The Gables on Pelham |
NH Nursing Home Licensed facility providing 24/7 skilled nursing care for residents with complex, ongoing medical needs. Staffed by RNs, LPNs, and CNAs. Inspected and star-rated annually by CMS. Accepts Medicare (short-term rehab) and Medicaid (long-term care).
AL Assisted Living A licensed, long-term care setting for seniors or individuals with disabilities who need help with daily activities — like bathing, dressing, and medication management — but not 24-hour skilled nursing. Offers housing, meals, and around-the-clock support while aiming to maximize resident independence.
MC Memory Care Secured, specialized care for people living with Alzheimer's or dementia. Staff trained in cognitive impairment, with higher staff-to-resident ratios and an environment designed to reduce confusion and wandering risk. | Greenville (Pelham Road) | 119
Facility
119
SC AVG
90
Rank
#73 / 309 | - | - | 3.88
Facility
3.88
SC AVG
4.00
Rank
#51 / 112 | -85% | -3% | $11.2k
Facility
$11.2k
SC AVG
$34.8k
Rank
#68 / 114 | 10
Facility
10
SC AVG
13.7
Rank
#43 / 113 | 3.3
Facility
3.3
SC AVG
3.4
Rank
#59 / 113 | 2 | 32 | - |
14
Facility
14
SC AVG
32
Rank
#178 / 232 | Fsl Senior Living Ventures, LLC | $8.3M
Facility
$8.3M
SC AVG
$13.0M
Rank
#97 / 116 | $5.0M
Facility
$5.0M
SC AVG
$5.4M
Rank
#84 / 116 | 60.1%
Facility
60.1%
SC AVG
44%
Rank
#24 / 116 | 425373 | ||||
| The Legacy at Southpointe Drive |
NH Nursing Home Licensed facility providing 24/7 skilled nursing care for residents with complex, ongoing medical needs. Staffed by RNs, LPNs, and CNAs. Inspected and star-rated annually by CMS. Accepts Medicare (short-term rehab) and Medicaid (long-term care).
AL Assisted Living A licensed, long-term care setting for seniors or individuals with disabilities who need help with daily activities — like bathing, dressing, and medication management — but not 24-hour skilled nursing. Offers housing, meals, and around-the-clock support while aiming to maximize resident independence.
HC Home Care Professional care delivered in the person's own home — from companionship and errands to skilled nursing and therapy. Allows seniors to age in place. Medicare covers skilled home health when medically necessary.
IL Independent Living Lifestyle-focused communities for older adults offering dining, activities, and transportation with minimal personal care. Best for active, independent seniors who want community without medical support.
MC Memory Care Secured, specialized care for people living with Alzheimer's or dementia. Staff trained in cognitive impairment, with higher staff-to-resident ratios and an environment designed to reduce confusion and wandering risk. | Greenville (Mauldin) | 110
Facility
110
SC AVG
90
Rank
#90 / 309 | - | - | 3.33
Facility
3.33
SC AVG
4.00
Rank
#92 / 112 | -17% | -17% | $25.6k
Facility
$25.6k
SC AVG
$34.8k
Rank
#89 / 114 | 25
Facility
25
SC AVG
13.7
Rank
#101 / 113 | 4.2
Facility
4.2
SC AVG
3.4
Rank
#84 / 113 | 2 | 111 | - |
55
Facility
55
SC AVG
32
Rank
#29 / 232 | Kirk Broome | $15.1M
Facility
$15.1M
SC AVG
$13.0M
Rank
#52 / 116 | $6.3M
Facility
$6.3M
SC AVG
$5.4M
Rank
#62 / 116 | 41.9%
Facility
41.9%
SC AVG
44%
Rank
#86 / 116 | 425361 |
Magnolia Manor of Greenville is in the Green Avenue neighborhood of Greenville.
The legal owner and operator of Magnolia Manor of Greenville is Thi Of South Carolina At Greenville Llc.
Magnolia Manor of Greenville has a walk score of 66. Moderately walkable. Some errands can be accomplished on foot, with a mix of nearby amenities.
According to SC state health department records, Magnolia Manor of Greenville's license number is NCF-0860.
According to SC state health department records, Magnolia Manor of Greenville's license expires on August 31, 2026.
The team at Magnolia Manor of Greenville can be reached at [email protected].
Tonya Bryant is the administrator of Magnolia Manor of Greenville.
Care Cost Calculator: See Prices in Your Area
Nursing Home Data Explorer
Don’t Wait Too Long: 7 Red Flag Signs Your Parent Needs Assisted Living Now
The True Cost of Assisted Living in 2025 – And How Families Are Paying For It
Understanding Senior Living Costs: Pricing Models, Discounts & Financial Assistance


Thank you for your interest!
Our team will be in touch shortly to help with next steps.
