Village Shalom Inc
Nursing Home, Assisted Living, Independent Living, Memory Care, Respite Care & Skilled Nursing · Overland Park, KS
CMS overall rating Info CMS (the Centers for Medicare & Medicaid Services) is the federal agency that rates nursing home quality. Its Overall Rating runs from 1 to 5 stars, combining health inspections, staffing, and quality measures, with inspections weighted most heavily.

Village Shalom Inc

Nursing Home, Assisted Living, Independent Living, Memory Care, Respite Care & Skilled Nursing · Overland Park, KS
CMS overall rating Info CMS (the Centers for Medicare & Medicaid Services) is the federal agency that rates nursing home quality. Its Overall Rating runs from 1 to 5 stars, combining health inspections, staffing, and quality measures, with inspections weighted most heavily.
Calculator: See prices in your area
Village Shalom Inc accepts Medicare, Medicaid, and private pay.

Overview of Village Shalom INC

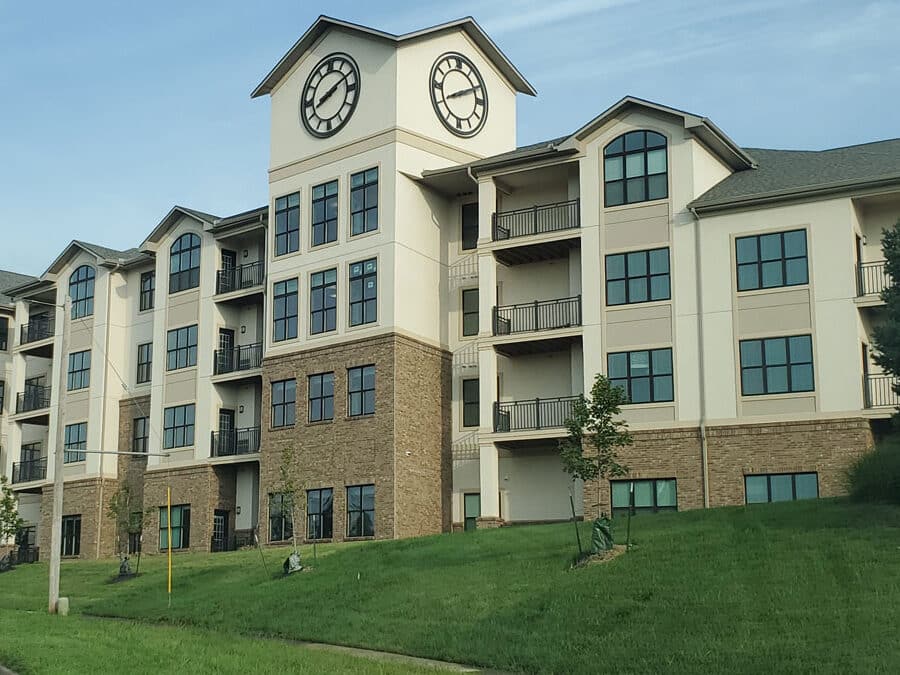
Village Shalom is a voluntary nonprofit senior living campus at 5500 W 123rd Street in Overland Park, Kansas. Operated by Village Shalom, Inc. and administered by Jamie Paredes, the 193-unit campus serves Johnson County as a Life Plan community, providing independent living, assisted living, memory care, and skilled nursing.

The health center functions as a combined Skilled Nursing Facility (SNF) and Nursing Facility (NF), primarily serving short-stay residents with a 64% Medicare admission mix. It holds a 3-out-of-5-star overall CMS rating, which balances high clinical quality and staffing against a health inspection score that has historically trended below state averages. Notably, based on the most recent 2026 focused health filings, the community maintains a citations-per-inspection rate of zero. Occupancy remains strong at approximately 86%, reflecting consistent demand for its campus-scale continuum.Staffing and Clinical ProfileThe staffing model is a primary differentiator, providing 6 hours and 52 minutes of total nursing care per resident per day—the fourth-highest ranking among 130 Kansas skilled nursing facilities. Direct care is anchored by high nurse-to-resident ratios, including 58 minutes of Registered Nurse (RN) coverage and 1 hour and 36 minutes of Licensed Practical Nurse (LPN) coverage daily. Clinical outcomes for long-stay residents are exceptional, with emergency department visit rates 64% better than the Kansas state average. The facility also specializes in intensive short-term rehabilitation, where physical therapy hours are 200% above state norms.

The campus features predominantly private rooms with individual bathrooms, emergency call systems, and complimentary Wi-Fi. All-inclusive services cover three kosher-style meals daily served in a restaurant-style dining room, as well as housekeeping, maintenance-free living, and personal laundry. Residents have access to a rich array of social and wellness resources including: A Spa and Wellness Center featuring an aquatic therapy pool and a state-of-the-art gym is available for functional recovery and fitness. Cultural and social engagement is supported by Rachel’s Café, the Epsten Gallery, a central fireplace lounge, and beautifully landscaped walking paths. For spiritual needs, the community provides diverse services, including Christian, Catholic, and Jewish offerings.

Those seeking a mission-driven, nonprofit community with industry-leading staffing ratios and a high-resource wellness environment may find this campus appropriate. Prospective residents should contact the administrator directly to discuss current bed availability and schedule a tour to assess the 2026 quality performance and neighborhood-style memory care suites firsthand.

Quality ratings

Measured by Centers for Medicare & Medicaid Services (CMS)

Overall rating Info The Overall CMS Rating combines results from health inspections, staffing levels and quality measures. Health inspections carry the most weight. Staffing and quality scores can increase or decrease the final rating based on performance compared to state and national standards.
▲ 38.3% Above KS avg. ▲ 38.3% Above KS avg.KS average: 2.9Click the badge to see the full State ranking.Click here to see the full State ranking.
Health Inspection Info Based on the results of the facility's three most recent standard inspections and any complaint investigations. CMS reviews the number, scope, and severity of deficiencies, with more recent findings weighted more heavily.
▼ 27.6% Below KS avg. ▼ 27.6% Below KS avg.KS average: 2.8Click the badge to see the full State ranking.Click here to see the full State ranking.
Staffing Info Measures average nursing staff hours per resident per day, including Registered Nurses (RNs) and total nursing staff. Ratings are adjusted based on the level of care residents require and are compared to state and national benchmarks.
▲ 44.6% Above KS avg. ▲ 44.6% Above KS avg.KS average: 3.5Click the badge to see the full State ranking.Click here to see the full State ranking.
Quality Measures Info Based on clinical and physical health indicators reported to CMS, such as hospital readmissions, falls, pressure ulcers, and improvements in mobility. These measures reflect how well residents' health needs are being managed.
▲ 61.7% Above KS avg. ▲ 61.7% Above KS avg.KS average: 3.1Click the badge to see the full State ranking.Click here to see the full State ranking.

Staffing hours breakdown

Info Daily nursing hours per resident by staff type, reported to CMS. Higher is generally better — compare this facility to state and national averages to see where staffing stands.

Hours per resident per day — compared to Kansas state averages

Total nursing care / resident Info Total adjusted nursing hours per resident per day, combining RN, LPN, and aide time. CMS adjusts this for case-mix so facilities can be fairly compared.
6h 52m per day
This facility Kansas avg (4h 38m per day)
vs Kansas avg
+48%

0 of 6 metrics below state avg

Standout metric Physical Therapist is +221% above state avg
Staff typeHours / Day / Residentvs state avg
Registered Nurse (RN) Info RNs hold the highest nursing license and can assess residents, interpret test results, and direct care plans. More RN hours per day often signals stronger clinical oversight and faster response to health changes. 54m per day ▲ 26% State avg: 43m per day · National avg: 41m per day
LPN / LVN Info Licensed Practical Nurses (LPNs) or Licensed Vocational Nurses (LVNs) deliver routine hands-on care — medication administration, wound dressing, and monitoring vital signs. They work under RN supervision and make up a large share of daily bedside care. 1h 46m per day ▲ 166% State avg: 40m per day · National avg: 52m per day
Nurse Aide Info Certified Nurse Aides (CNAs) provide the most direct day-to-day assistance: bathing, dressing, feeding, and mobility. Nurse aide hours are typically the largest staffing category and directly affect residents' quality of life. 3h 17m per day ▲ 22% State avg: 2h 41m per day · National avg: 2h 20m per day
Weekend Total Nursing Info Combined nursing hours (RN + LPN + Nurse Aide) per resident per day on weekends. Staffing often drops on weekends — this figure reveals whether the facility maintains adequate coverage outside of weekday hours. 5h 36m per day ▲ 56% State avg: 3h 35m per day · National avg: 3h 26m per day
Physical Therapist Info Hours per resident per day provided by licensed Physical Therapists (PTs) or PT Assistants. PT services help residents recover mobility after injury or illness and are especially important for post-acute (short-stay) rehabilitation. 6m per day ▲ 221% State avg: 2m per day · National avg: 4m per day
Weekend RN Info Registered nurse hours specifically on weekends. Facilities sometimes reduce RN presence on Saturdays and Sundays — a low weekend RN figure compared to weekday hours can indicate reduced clinical oversight when most administrative staff are absent. 52m per day ▲ 72% State avg: 30m per day · National avg: 28m per day

Capacity and availability

Avg. Length of Stay Info Average number of days residents stay at this facility, based on CMS cost report data. Shorter stays often reflect post-acute or rehab care; longer stays reflect long-term care.
111 days
Bed community size
66-bed community Rank #87 / 224Bed count — State benchmarkedThis home is ranked 87th out of 224 homes in Kansas. Shows this facility's certified or reported bed count compared to other Kansas facilities. Larger communities may offer more amenities, programs, and on-site services for residents and families.Rankings are based only on facilities in Kansas that report data for that category. Facilities without available data are excluded from the ranking.Click the rank badge to see the full State ranking.Click here to see the full State ranking.
A moderately sized community that may balance personal attention with shared amenities and social activities.
Walk Score
Walk Score: 22 / 100 Rank #299 / 363Walk Score — State benchmarkedThis home is ranked 299th out of 363 homes in Kansas. Shows how walkable this facility's neighborhood is compared to the average Walk Score across Kansas facilities. Higher scores benefit residents, families, and staff.Rankings are based only on facilities in Kansas that report data for that category. Facilities without available data are excluded from the ranking.Click the rank badge to see the full State ranking.Click here to see the full State ranking.
Car-dependent. Most errands require a car, with limited nearby walkable options.

About this community

Occupancy

Occupancy rate
98%
Higher than the Kansas average: 79.5%
Occupied beds
65 / 66
Average occupied beds in Kansas homes 50 beds

License Details

Facility TypeNursing Facility | Assisted Living Facility | Residential Health Care Facility
StatusActive
CountyJohnson
License Number175441
CMS Certification Number175441

Ownership & Operating Entity

Village Shalom Inc is administered by Jamie Paredes.

Owner NameVillage Shalom, Inc

Therapy & Rehabilitation

2 services
Rehabilitation Services
Respite Care

Additional Services

2 services
Memory Support
Rehab Services

Amenities & Lifestyle

Volunteer Program

Contact Village Shalom Inc

Inspection History

In Kansas, the Department for Aging and Disability Services, Survey and Certification Commission performs the unannounced inspections required for facility licensing and federal certification.

Since 2012 · 14 years of data 163 deficiencies

Inspection Scorecard Info This scorecard compares key inspection, deficiency, and complaint metrics at this facility against the Kansas state average. Metrics rated ≥15% worse than average are highlighted in red; those ≥15% better are highlighted in green.

Since 2012 vs. Kansas state average
Overall vs. KS average 2 Worse Metrics worse than Kansas average:
• Total deficiencies (63% above)
• Deficiencies per year (63% above)
0 Better No metrics in this bucket.
Latest Inspection June 18, 2025

Deficiencies Info Deficiencies are formal regulatory issues recorded during state inspections.

This FacilityKS Averagevs. KS Avg
Total deficiencies Info Formal regulatory issues recorded by inspectors across all inspection types. 163100 This facility has 63% more total deficiencies than a typical Kansas nursing home (163 vs. KS avg 100).↑ 63% worse
Deficiencies per year Info Average deficiencies per year since 2012. 11.67.1 This facility has 63% more deficiencies per year than a typical Kansas nursing home (11.6 vs. KS avg 7.1).↑ 63% worse

Inspection Reports Summary Info An editor-reviewed summary of the themes and findings across this facility's recent inspection reports.

  • The most recent inspection on July 21, 2025, found no deficiencies and confirmed the facility was in compliance with all regulations. Prior inspections showed multiple deficiencies primarily related to resident care, medication administration, infection control, and staff training, with issues such as inadequate supervision during meals, improper medication management, and lapses in hand hygiene. Complaint investigations included substantiated findings of medication administration errors that led to hospitalization for one resident, as well as concerns about resident dignity, fall prevention, and abuse reporting in earlier years. Enforcement actions such as immediate jeopardy findings and payment denials occurred in 2017 related to resident safety and supervision but were followed by corrective plans and subsequent compliance. The facility’s inspection history shows a pattern of addressing cited deficiencies with corrective actions, and the recent clean inspection suggests improvement over time.

Health Inspection History

Inspections since 2022
Total health inspections 4

Kansas average 4.5


Last Health inspection on Jun 2025

Total health citations
32

Kansas average 26.9

Citations per inspection
8

Kansas average 6.07


Health citations are formal notices following inspections when they fail to comply with safety and care standards.

31 of 32 citations resulted from standard inspections; and 1 of 32 resulted from complaint investigations.

Breakdown of citation severity (last 4 years)
Critical health citations
0
100% better than Kansas average

Kansas average: 0.9


Serious health citations
2
122% worse than Kansas average

Kansas average: 0.9

0 critical citations Kansas average: 0.9

2 serious citations Kansas average: 0.9

30 moderate citations Kansas average: 24.6

0 minor citations Kansas average: 0.5
Citations history (last 4 years)
Abuse/Neglect moderate citation Jun 04, 2025
Corrected

Infection Control moderate citation Jun 04, 2025
Corrected

Nursing Services moderate citation Jun 04, 2025
Corrected

Nutrition moderate citation Jun 04, 2025
Corrected

Staffing Data

Reporting period: October 1 – December 31, 2025 (Q4 2025). Source: CMS Payroll-Based Journal report.

Total staff 170
Employees 142
Contractors 28
Staff to resident ratio 2.62 : 1
17% more staff per resident than Kansas average
Kansas average ratio: 2.24 : 1 Kansas average ratio: 2.24 : 1See full Kansas ranking
Avg staff/day 48
Average shift 7.9 hours
0% compared with Kansas average
Kansas average: 7.7 hours Kansas average shift: 7.7 hoursSee full Kansas ranking
Total staff hours (quarter) 35,056

Nursing staff breakdown

Q4 2025 · Oct 1 – Dec 31 More info This data comes from the CMS Payroll-Based Journal report covering October 1 – December 31, 2025.
Registered Nurse

Manages medical care and health needs.

RN Staff Info All 9 RN Staff are full-time employees. No contractors work on this role. 9
Average shift length Info Average shift length. Calculated as total hours divided by days worked and average staff per day. 9.4 hours
Licensed Practical Nurse

Assists with medical care and medications.

LPN Staff Info All 20 LPN Staff are full-time employees. No contractors work on this role. 20
Average shift length Info Average shift length. Calculated as total hours divided by days worked and average staff per day. 9.8 hours
Certified Nursing Assistant

Helps with daily care and mobility.

CNA Staff Info All 82 CNA Staff are full-time employees. No contractors work on this role. 82
Average shift length Info Average shift length. Calculated as total hours divided by days worked and average staff per day. 7.8 hours

Contractor staffing

Q4 2025 · Oct 1 – Dec 31 More info This data comes from the CMS Payroll-Based Journal report covering October 1 – December 31, 2025.

Total hours from contractors

7.2%

2,528 contractor hours this quarter

Physical Therapy Assistant: 7 Respiratory Therapy Technician: 5 Qualified Social Worker: 5 Speech Language Pathologist: 4 Physical Therapy Aide: 4 Occupational Therapy Aide: 2 Medical Director: 1

Staff by category

Q4 2025 · Oct 1 – Dec 31 More info This data comes from the CMS Payroll-Based Journal report covering October 1 – December 31, 2025.
Certified Nursing Assistant8208214,16392100%7.8
Licensed Practical Nurse200208,12292100%9.8
Registered Nurse9093,59392100%9.4
Medication Aide/Technician180182,2979199%10.6
Other Dietary Services Staff3031,1408390%7.8
RN Director of Nursing4047676571%6.4
Physical Therapy Assistant0776247582%4.3
Respiratory Therapy Technician0555377379%3.8
Occupational Therapy Aide0224926368%7.8
Speech Language Pathologist0444796672%3.7
Nurse Practitioner1014736368%7.5
Dental Services Staff1014736368%7.5
Clinical Nurse Specialist1014586166%7.5
Administrator1014195661%7.5
Mental Health Service Worker1014135560%7.5
Qualified Social Worker0553056672%4.5
Dietitian1012142527%8.6
Medical Director011554145%1.3
Physical Therapy Aide044361415%2.4
82 Certified Nursing Assistant
% of Days 100%
20 Licensed Practical Nurse
% of Days 100%
9 Registered Nurse
% of Days 100%
18 Medication Aide/Technician
% of Days 99%
3 Other Dietary Services Staff
% of Days 90%
4 RN Director of Nursing
% of Days 71%
7 Physical Therapy Assistant
% of Days 82%
5 Respiratory Therapy Technician
% of Days 79%
2 Occupational Therapy Aide
% of Days 68%
4 Speech Language Pathologist
% of Days 72%
1 Nurse Practitioner
% of Days 68%
1 Dental Services Staff
% of Days 68%
1 Clinical Nurse Specialist
% of Days 66%
1 Administrator
% of Days 61%
1 Mental Health Service Worker
% of Days 60%
5 Qualified Social Worker
% of Days 72%
1 Dietitian
% of Days 27%
1 Medical Director
% of Days 45%
4 Physical Therapy Aide
% of Days 15%

Penalties and fines

Includes penalties issued in 2023

Federal penalties imposed by CMS for regulatory violations, including civil money penalties (fines) and denials of payment for new Medicare/Medicaid admissions.

Source: CMS Penalties Database (Data as of Jan 2026)

Total fines amount $16K
63% lower than Kansas average

Kansas average: $44K

Number of fines 1
59% fewer fines than Kansas average

Kansas average: 2.4

Payment Denials Info Serious action where Medicare and/or Medicaid temporarily stops payments for new residents until issues are fixed. 1
200% more payment denials than Kansas average

Kansas average: 0.3

Fines amount comparison
This facility $16K
Kansas average $44K
Penalty History

Penalties are imposed by CMS for violations of federal nursing home regulations.

2 penalties in the past 3 years

Multiple penalties were reported in the last 3 years.

Civil Money Penalty Info Fines imposed for noncompliance, which can be assessed per day or per instance of violation. Oct 19, 2023
$16K
Payment Denial Info Serious action where Medicare and/or Medicaid temporarily stops payments for new residents until issues are fixed. Oct 19, 2023
6 days

Last updated: Jan 2026

Quality of care over time

These measures show how residents usually do over time at this home, based on health outcomes and preventive care.

High-risk clinical events score Info A composite score based on pressure ulcers, falls with injury, weight loss, walking ability decline, and activities of daily living decline. 11.3
8% worse than Kansas average

Kansas average: 10.5

Functional decline score Info A composite score based on activities of daily living decline, walking ability decline, and incontinence. 25.0
21% worse than Kansas average

Kansas average: 20.7

Long-stay resident measures
Significantly above average Kansas avg: 3.0 Info CMS star rating based on long-stay quality measure performance. 5 stars = significantly above average, 1 star = significantly below average.
Need for Help with Daily Activities Increased Info Percent of long-stay residents whose need for help with daily activities has increased 23.9%
26% worse than Kansas average

Kansas average: 19.0%

Walking Ability Worsened Info Percent of long-stay residents whose ability to move independently worsened 23.2%
20% worse than Kansas average

Kansas average: 19.4%

Low Risk Residents with Bowel/Bladder Incontinence Info Percent of low risk long-stay residents who lose control of their bowels or bladder 27.9%
17% worse than Kansas average

Kansas average: 23.8%

Falls with Major Injury Info Percent of long-stay residents experiencing one or more falls with major injury 1.8%
59% better than Kansas average

Kansas average: 4.4%

High Risk Residents with Pressure Ulcers Info Percent of long-stay high risk residents with pressure ulcers 3.4%
27% better than Kansas average

Kansas average: 4.6%

Urinary Tract Infection Info Percent of long-stay residents with a urinary tract infection 3.6%
16% worse than Kansas average

Kansas average: 3.1%

Lost Too Much Weight Info Percent of long-stay residents who lose too much weight 4.3%
15% better than Kansas average

Kansas average: 5.1%

Depressive Symptoms Info Percent of long-stay residents who have depressive symptoms 1.0%
81% better than Kansas average

Kansas average: 5.2%

Antipsychotic Use Info Percent of long-stay residents who received an antipsychotic medication 9.0%
47% better than Kansas average

Kansas average: 16.9%

Pneumococcal Vaccine Info Percent of long-stay residents assessed and appropriately given the pneumococcal vaccine 97.8%
6% better than Kansas average

Kansas average: 91.9%

Influenza Vaccine Info Percent of long-stay residents assessed and appropriately given the seasonal influenza vaccine 100.0%
5% better than Kansas average

Kansas average: 95.5%

Hospitalizations per 1,000 days Info Number of hospitalizations per 1,000 long-stay resident days. 1.28
30% better than Kansas average

Kansas average: 1.84

ED visits per 1,000 days Info Number of outpatient emergency department visits per 1,000 long-stay resident days. 0.77
64% better than Kansas average

Kansas average: 2.16

Short-stay resident measures
Significantly above average Kansas avg: 2.6 Info CMS star rating based on short-stay quality measure performance. 5 stars = much above average, 1 star = much below average.
Pneumococcal Vaccine Info Percent of short-stay residents assessed and appropriately given the pneumococcal vaccine 92.4%
22% better than Kansas average

Kansas average: 75.6%

Antipsychotic medication increase Info Percent of short-stay residents who newly received an antipsychotic medication 0.7%
68% better than Kansas average

Kansas average: 2.2%

Influenza Vaccine Info Percent of short-stay residents assessed and appropriately given the seasonal influenza vaccine 91.2%
24% better than Kansas average

Kansas average: 73.5%

Re-hospitalized after SNF stay Info Percentage of short-stay residents who were re-hospitalized after their nursing home admission. 22.9%
In line with Kansas average

Kansas average: 23.0%

Emergency department visits Info Percentage of short-stay residents who had an outpatient emergency department visit. 4.0%
66% better than Kansas average

Kansas average: 11.7%

Falls with major injury Info Percentage of SNF residents who experience falls with major injury during their stay. 0.6%
26% better than Kansas average

Kansas average: 0.8%

Ability to care for self at discharge Info Percentage of residents at or above expected ability to care for themselves at discharge. 61.0%
14% better than Kansas average

Kansas average: 53.7%

Successful return to home or community Info Rate of successful return to home or community from a skilled nursing facility. 47.2%
7% worse than Kansas average

Kansas average: 50.6%

Breakdown by payment type

Medicare

64% of new residents, usually for short-term rehab.

Typical stay 18 days

Private pay

26% of new residents, often for short stays.

Typical stay 7 - 8 months

Medicaid

10% of new residents, often for long-term daily care.

Typical stay 1 years

Facility Characteristics

Source: CMS Long-Term Care Facility Characteristics (Data as of Jan 2026)

Total residents 65
Medicare
13
20% of residents
Medicaid
22
33.8% of residents
Private pay or other
30
46.2% of residents
Programs & Services
Residents Group

Residents meet regularly to discuss policies, care quality, and activities

Family Member Group

Family members meet regularly to discuss policies, care quality, and activities

CCRC

Part of a Continuing Care Retirement Community offering multiple care levels

Active Family Council

Organized group of family members that meets regularly to discuss facility policies, resident care, and activities.

Active Resident Council

Organized group of residents that meets regularly to discuss facility policies, quality of life, and activities.

Finances and operations

Based on CMS SNF Cost Report for fiscal year ending in 12/2023.

Nonprofit
Other Nonprofit
Net patient revenue Info Net patient revenue — what the home actually collects for resident care, after contractual allowances, bad debt and discounts are subtracted from its gross charges (CMS cost report, Worksheet G-3). It covers resident care only; money the home earns from other sources is shown separately as "Other income."
$22.7M
Net patient income Info Net patient income: net patient revenue minus the home's total operating expenses. A positive figure means it earns more from resident care than it spends to deliver it; a negative figure means the opposite. It excludes non-operating "other income."
-$8.9M
Nonprofit Other Nonprofit
Net patient revenue Info Net patient revenue — what the home actually collects for resident care, after contractual allowances, bad debt and discounts are subtracted from its gross charges (CMS cost report, Worksheet G-3). It covers resident care only; money the home earns from other sources is shown separately as "Other income."
$22.7M
Net patient income Info Net patient income: net patient revenue minus the home's total operating expenses. A positive figure means it earns more from resident care than it spends to deliver it; a negative figure means the opposite. It excludes non-operating "other income."
-$8.9M
Other income Info Money the home earns outside of resident care — such as investments, grants, rentals and other non-operating sources (CMS cost report, Worksheet G-3). It is tracked separately from net patient revenue: it is not part of that figure, and it is not included in net patient income.
$2.3M
Payroll costs Info Staff salaries plus wage-related costs — benefits such as payroll taxes, health insurance and retirement — from the home's own accounting records (CMS cost report, Worksheet A). Contract or agency labor is counted separately, under other operating costs.
$10.7M 47% of net patient revenue Info Payroll as a share of revenue: staff salaries and wage-related benefits divided by net patient revenue. A higher figure means more of each revenue dollar goes to staff pay.
Other operating costs Info Everything it costs to run the home apart from payroll — food, utilities, supplies, maintenance, contract labor and administration. Calculated as total operating expense minus payroll (staff salaries and wage-related benefits).
$20.9M
Total costs Info The home's total operating expense for the year — all the costs of running it, salaries included (CMS cost report, Worksheet G-3).
$31.6M

Who this home usually serves

TYPE OF STAY

Mostly short-term rehab stays

Most residents typically stay for a few weeks or months before returning home or moving on.

Most new residents arrive under Medicare (64% of admissions), and a typical Medicare stay runs around 18 days.

Admissions
215 total

Coverage residents most often arrive under.

Medicare 64%
Private pay 26%
Medicaid 10%
Discharges
207 total

Coverage residents most often leave under.

Medicare 55%
Private pay 33%
Medicaid 12%

Places of interest near Village Shalom Inc

Address 5.9 miles from city center Info Estimated distance in miles from Overland Park's city center to Village Shalom Inc's address, calculated via Google Maps.

Calculate Travel Distance to Village Shalom Inc

Add your location

Address

Compare Nursing Homes around Overland Park

The information below is reported by the Kansas Department for Aging and Disability Services.

5 facilities compared · CMS & KS Dept. of Health data

Brookdale Overland Park
NH
AL
MC
SNF
Overland Park
94
Facility 94
KS AVG 69
Rank #44 / 224
87.5% +10%4.53 +65%-2%$7.4k206.7175-
44
Facility 44
KS AVG 46
Rank #207 / 363
Kimberly Ellis$22.0MFiscal year ending 12/2023$10.9MFiscal year ending 12/202349.6%Fiscal year ending 12/2023175517
Tallgrass Creek Senior Living Community
NH
IL
Overland Park (Metcalf Avenue)
116
Facility 116
KS AVG 69
Rank #29 / 224
95.8% +21%5.09 -14%+10%$7.4k174.3138-
75
Facility 75
KS AVG 46
Rank #39 / 363
Adam Dickson$7.6MFiscal year ending 12/2023$19.5MFiscal year ending 12/2023257.3%Fiscal year ending 12/2023175541
Ahc of Overland Park LLC
NH
SNF
Overland Park (South Lakes)
38
Facility 38
KS AVG 69
Rank #204 / 224
100.0% +26%5.02 +13%+8%$13.4k224.4239-
92
Facility 92
KS AVG 46
Rank #1 / 363
Paul Hura$6.4MFiscal year ending 12/2023$4.3MFiscal year ending 12/202366.6%Fiscal year ending 12/2023175542
Village Shalom Inc
NH
AL
IL
MC
RC
SNF
Overland Park (6850)
66
Facility 66
KS AVG 69
Rank #87 / 224
98.5% +24%6.86 -48%+48%$16.2k328.0255-
22
Facility 22
KS AVG 46
Rank #299 / 363
Michael Abrams$22.7MFiscal year ending 12/2023$10.7MFiscal year ending 12/202347%Fiscal year ending 12/2023175441
Stratford Commons Rehabilitation & Health Care
NH
HOS
RC
SNF
Overland Park (Stratford Place)
60
Facility 60
KS AVG 69
Rank #94 / 224
88.3% +11%3.79 0%-18%$24.8k4414.7-48-
47
Facility 47
KS AVG 46
Rank #186 / 363
Joseph Charles Tutera 2013 Family Irrevociable Trust Agreement$7.0MFiscal year ending 12/2023$3.7MFiscal year ending 12/202353%Fiscal year ending 12/2023175549

Financial Assistance for
Nursing Home in Kansas

Village Shalom Inc is located in OVERLAND PARK, Kansas.
Here are the financial assistance programs available to residents in Kansas.

Get Financial aid guidance

Frail Elderly Waiver

Kansas Medicaid FE Waiver

Age 65+
General Kansas resident, Medicaid-eligible, nursing home- level care need.
Income Limits (2025) ~$2,829/month 300% FBR, individual
Asset Limits $2,000 (individual), $3,000 (couple).
KS

Requires care level assessment.

Benefits
Personal care (5-7 hours/day) Respite (240 hours/year) Adult day care (~$60/day) Home aides

Senior Care Act

Kansas SCA

Age 60+
General Kansas resident, at risk of nursing home.
Income Limits ~$1,800/month individual, varies
Asset Limits $2,000 individual
KS

Limited funding; waitlists common.

Benefits
In-home care (3-5 hours/week) Respite (up to 10 days/year) Homemaker services

Medicare Savings Program (MSP)

Kansas Medicare Savings Program

Age 65+ or disabled
General Kansas resident, Medicare Part A/B.
Income Limits (2025) ~$2,510/month (QMB), ~$3,380/month (SLMB), ~$3,598/month (QI)—individual.
Asset Limits $9,430 (individual), $14,130 (couple).
KS

Three tiers; no waitlist.

Benefits
Covers Part B premiums ($174.70/month) Deductibles ($240/year) Copays (~20%)

National Family Caregiver Support Program (NFCSP) Respite

Kansas NFCSP Respite Care

Age
General Caregivers of 60+ needing care or 55+ caregivers of others; Kansas resident; functional needs (2+ ADLs).
Income Limits (2025) Prioritizes ~$24,980/year (individual); no strict cap.
Asset Limits Not assessed; need-based.
KS

11 AAAs; prioritizes low-income, rural caregivers.

Benefits
Respite (4-6 hours/week or 5 days/year) Adult day care ($60/day) Caregiver training

VA Aid and Attendance (A&A) and Housebound Benefits

Kansas VA Aid and Attendance/Housebound

Age 65+ or disabled veteran/spouse
General Kansas resident, wartime service, need for ADL help (A&A) or homebound.
Income Limits (2025) Net income < ~$1,984/month (veteran with dependent, A&A); pension offsets income.
Asset Limits ~$155,356 net worth limit
KS

High veteran demand in rural/urban areas.

Benefits
Cash (~$1,433-$2,642/month veteran, ~$951-$1,318 spouse) for care costs (e.g., in-home, assisted living)

Frequently Asked Questions about Village Shalom Inc

What neighborhood is Village Shalom Inc in?

Village Shalom Inc is in the 6850 neighborhood of OVERLAND PARK.

Is Village Shalom Inc in a walkable area?

Village Shalom Inc has a walk score of 22. Car-dependent. Most errands require a car, with limited nearby walkable options.

What is the license number of Village Shalom Inc?

According to KS state health department records, Village Shalom Inc's license number is 175441.

What is the occupancy rate at Village Shalom Inc?

Village Shalom Inc's occupancy is 98%.

Does Village Shalom Inc operate as a for-profit or non-profit?

Village Shalom Inc is registered as a non-profit in KS.

Who is the administrator of Village Shalom Inc?

Jamie Paredes is the administrator of Village Shalom Inc.

How many beds does Village Shalom Inc have?

Village Shalom Inc has 66 beds.

Guides for Better Senior Living

Care Cost Calculator: See Prices in Your Area

Nursing Home Data Explorer

Don’t Wait Too Long: 7 Red Flag Signs Your Parent Needs Assisted Living Now

The True Cost of Assisted Living in 2025 – And How Families Are Paying For It

Understanding Senior Living Costs: Pricing Models, Discounts & Financial Assistance