Discovery Commons Virginia Beach
Nursing Home, Assisted Living & Memory Care · Virginia Beach, VA
CMS overall rating Info The Overall CMS Rating is scored from 1 to 5 stars and combines results from health inspections, staffing levels, and quality measures. Health inspections carry the most weight. Staffing and quality scores can increase or decrease the final rating based on performance compared to state and national standards.

Discovery Commons Virginia Beach

Nursing Home, Assisted Living & Memory Care · Virginia Beach, VA
CMS overall rating Info The Overall CMS Rating is scored from 1 to 5 stars and combines results from health inspections, staffing levels, and quality measures. Health inspections carry the most weight. Staffing and quality scores can increase or decrease the final rating based on performance compared to state and national standards.
Calculator: See prices in your area
Discovery Commons Virginia Beach accepts Medicare, Medicaid, and private pay.

Overview of Discovery Commons Virginia Beach

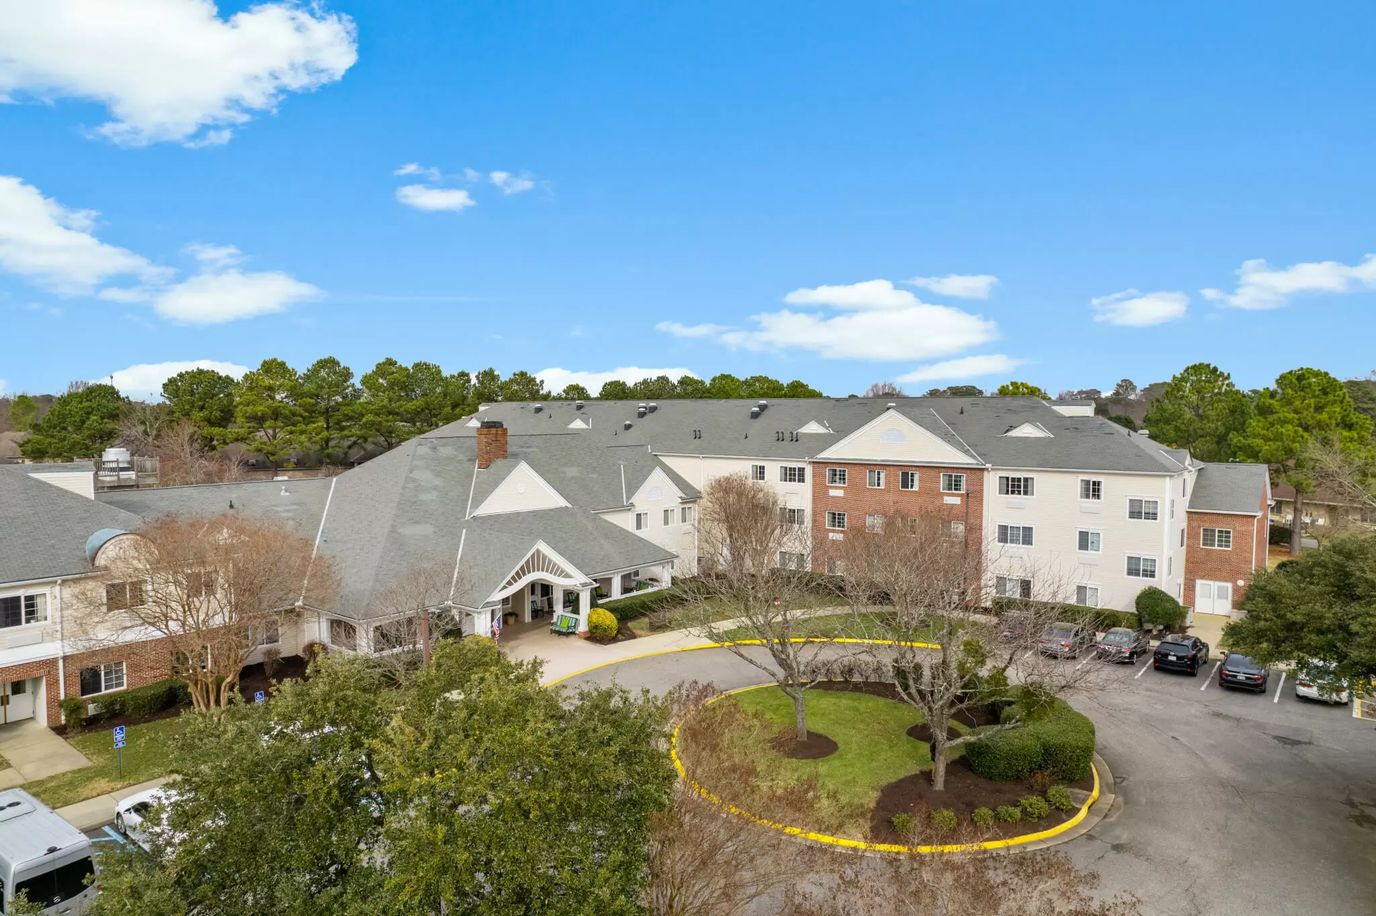
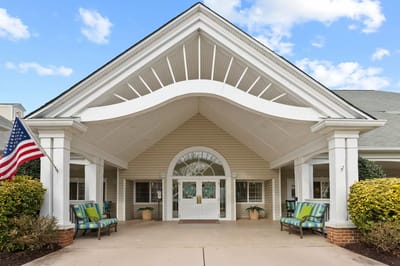
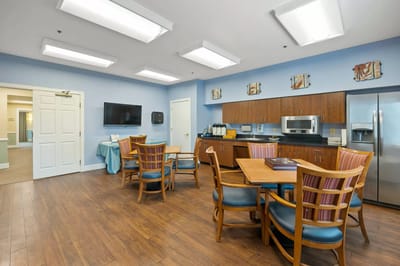
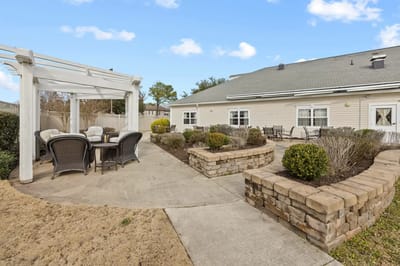
Experience Discovery Commons (Formerly Atria Assisted Living at Virginia Beach), located in the vibrant coastal city of Virginia Beach. This memory care assisted living community offers easy access to a wealth of attractions and activities. Immerse yourself in the rich history, indulge in the local culinary scene, and explore the diverse arts and entertainment options. Virginia Beach boasts an array of shopping venues and iconic locations like the Virginia Museum of Contemporary Art and the iconic Virginia Beach Oceanfront, just minutes away.

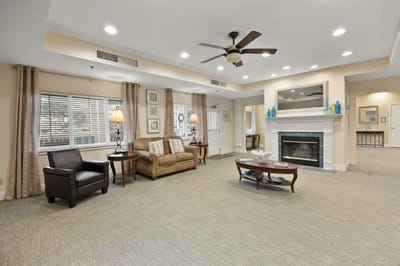
At Discovery Commons, you’ll find top-class amenities, memory care facilities, and a dedicated team of friendly care professionals available 24/7. As the area’s premier choice for value and Assisted Living, residents can enjoy three chef-prepared meals per day and a calendar filled with engaging social events and activities. Their cozy suites offer privacy and home-like comfort. Each suite features low-pile carpeting, a spacious tiled bathroom with a walk-in shower and safety features, and ample storage space. Enjoy the abundant natural light that streams through the large picture windows adorned with premium blinds. With an integrated emergency call system, cable, phone, internet services, and all utilities included, residents can relax knowing they have everything they need.

(757) 496-8001

Quality ratings

Measured by Centers for Medicare & Medicaid Services (CMS)

Overall rating Info The Overall CMS Rating combines results from health inspections, staffing levels and quality measures. Health inspections carry the most weight. Staffing and quality scores can increase or decrease the final rating based on performance compared to state and national standards.
▼ 73.8% Below VA avg. ▼ 73.8% Below VA avg.Click the badge to see the full State ranking.Click here to see the full State ranking.
Health Inspection Info Based on the results of the facility's three most recent standard inspections and any complaint investigations. CMS reviews the number, scope, and severity of deficiencies, with more recent findings weighted more heavily.
▼ 70.1% Below VA avg. ▼ 70.1% Below VA avg.Click the badge to see the full State ranking.Click here to see the full State ranking.
Staffing Info Measures average nursing staff hours per resident per day, including Registered Nurses (RNs) and total nursing staff. Ratings are adjusted based on the level of care residents require and are compared to state and national benchmarks.
▼ 72.3% Below VA avg. ▼ 72.3% Below VA avg.Click the badge to see the full State ranking.Click here to see the full State ranking.
Quality Measures Info Based on clinical and physical health indicators reported to CMS, such as hospital readmissions, falls, pressure ulcers, and improvements in mobility. These measures reflect how well residents' health needs are being managed.
▼ 25.0% Below VA avg. ▼ 25.0% Below VA avg.Click the badge to see the full State ranking.Click here to see the full State ranking.

Staffing hours breakdown

Info Daily nursing hours per resident by staff type, reported to CMS. Higher is generally better — compare this facility to state and national averages to see where staffing stands.

Hours per resident per day — compared to Virginia state averages

Total nursing care / resident Info This home is ranked 60th out of 85 homes in Virginia. Total adjusted nursing hours per resident per day, combining RN, LPN, and aide time. CMS adjusts this for case-mix so facilities can be fairly compared.
3h 20m per day
Rank #60 / 85Nurse hours — State benchmarkedThis home is ranked 60th out of 85 homes in Virginia. Shows adjusted nurse hours per resident per day benchmarked to the Virginia average, with a ranking across 85 Virginia SNFs. More hours mean more direct care. The national average is about 3.5 hrs; below 3.0 is a red flag.Click the rank badge to see the full State ranking.Click here to see the full State ranking.
This facility Virginia avg (4h 47m per day)
vs Virginia avg
-30%
Staff typeHours / Day / Residentvs state avg
Weekend Total Nursing Info Combined nursing hours (RN + LPN + Nurse Aide) per resident per day on weekends. Staffing often drops on weekends — this figure reveals whether the facility maintains adequate coverage outside of weekday hours. 2h 53m per day

Types of Care at Discovery Commons Virginia Beach

Assisted Living Memory Care

Capacity and availability

This home usually has limited availability

Occupancy between 85% and 95% suggests balanced demand.

Higher occupancy than the Virginia average: 85.7%
Occupancy rate 92.2% Rank #30 / 311Occupancy rate — State benchmarkedThis home is ranked 30th out of 311 homes in Virginia. Shows this facility's occupancy rate versus the Virginia average, with its Statewide rank out of 311. Higher occupancy signals strong local demand and financial stability.Click the rank badge to see the full State ranking.Click here to see the full State ranking.
Avg. Length of Stay 79 days
Occupancy rate
92.2% Rank #30 / 311Occupancy rate — State benchmarkedThis home is ranked 30th out of 311 homes in Virginia. Shows this facility's occupancy rate versus the Virginia average, with its Statewide rank out of 311. Higher occupancy signals strong local demand and financial stability.Click the rank badge to see the full State ranking.Click here to see the full State ranking.
Avg. Length of Stay
79 days
Bed community size
153-bed community Rank #42 / 371Bed count — State benchmarkedThis home is ranked 42nd out of 371 homes in Virginia. Shows this facility's certified or reported bed count compared to other Virginia SNFs. Larger communities may offer more amenities, programs, and on-site services for residents and families.Click the rank badge to see the full State ranking.Click here to see the full State ranking.
A large-scale community that may provide a wide range of amenities, services, and structured programs.
Walk Score
Walk Score: 35 / 100 Rank #264 / 449Walk Score — State benchmarkedThis home is ranked 264th out of 449 homes in Virginia. Shows how walkable this facility's neighborhood is compared to the average Walk Score across Virginia SNFs. Higher scores benefit residents, families, and staff.Click the rank badge to see the full State ranking.Click here to see the full State ranking.
Somewhat walkable. A few nearby services may be reachable on foot, but most trips require transportation.

About this community

License Details

Facility TypeAssisted Living Facility
StatusActive
ExpirationNovember 11, 2025
QualificationNon-Ambulatory | Residential and Assisted Living Care | Special Care Unit

Ownership & Operating Entity

Discovery Commons Virginia Beach is administrated by Brooke Bravo.

Contact Discovery Commons Virginia Beach

Inspection History

In Virginia, the Department of Social Services (for assisted living facilities) and the Department of Health (for nursing homes) perform the inspections required to maintain state and federal licensing.

Since 2021 · 5 years of data 3 complaints 11 inspections

Inspection Scorecard Info This scorecard compares key inspection, citation, and complaint metrics at this facility against the Virginia state average. Metrics rated ≥15% worse than average are highlighted in red; those ≥15% better are highlighted in green.

Since 2021 vs. Virginia state average
Overall vs. VA average 0 Worse No metrics in this bucket. 1 At Avg Metrics at Virginia average:
• Inspection violation rate (at VA avg)
4 Better Metrics better than Virginia average:
• Total inspections (21% below)
• Inspections with violations (22% below)
• Total complaints (57% below)
• Complaints per year (57% below)

Inspections Info State inspections evaluate whether the facility meets health and safety standards.

This FacilityVA Averagevs. VA Avg
Total inspections Info Combined count of all routine and focused inspections. Excludes complaint investigations. 1114 This facility has 21% fewer total inspections than a typical Virginia nursing home (11 vs. VA avg 14).↓ 21% better
Inspections with violations Info Inspections that uncovered at least one regulatory violation. 79 This facility has 22% fewer inspections with violations than a typical Virginia nursing home (7 vs. VA avg 9).↓ 22% better
Inspection violation rate Info Percentage of inspections that resulted in at least one violation. 64%64% This facility has inspection violation rate in line with the Virginia average (64 vs. VA avg 64).— At avg

Complaints & Investigations Info Complaints are formal concerns filed by residents, families, or staff. Investigations are on-site follow-ups.

This FacilityVA Averagevs. VA Avg
Total complaints Info Formal expressions of concern made by residents, families, or staff. 37 This facility has 57% fewer total complaints than a typical Virginia nursing home (3 vs. VA avg 7).↓ 57% better
Complaints per year Info Average complaints per year since 2021. 0.61.4 This facility has 57% fewer complaints per year than a typical Virginia nursing home (0.6 vs. VA avg 1.4).↓ 57% better

Read the full inspection reports for this facility, including detailed findings and corrective actions.

Show Inspection Reports

Health Inspection History

Inspections since 2019
Total health inspections 4

Virginia average 4.2


Last Health inspection on Sep 2024

Total health citations
62 Rank #77 / 86Health citations — State benchmarkedThis home is ranked 77th out of 86 homes in Virginia. Shows this facility's total health deficiency citations benchmarked to the Virginia State average, with a ranking across all 86 VA SNFs. Lower citation counts earn a better rank.Click the rank badge to see the full State ranking.Click here to see the full State ranking.

Virginia average 38.4

Citations per inspection
15.5 Rank #77 / 86Citations per inspection — State benchmarkedThis home is ranked 77th out of 86 homes in Virginia. Shows average deficiency citations per CMS inspection for this facility versus the Virginia mean across 86 SNFs with citation data. Lower is better.Click the rank badge to see the full State ranking.Click here to see the full State ranking.

Virginia average 8.93


Health citations are formal notices following inspections when they fail to comply with safety and care standards.

49 of 62 citations resulted from standard inspections; 1 of 62 resulted from complaint investigations; and 12 of 62 came from combined inspections (standard and complaint).

Breakdown of citation severity (last 7 years)
Critical Health citations
0
100% better than Virginia average

Virginia average: 0.4


Serious Health citations
4 Rank #29 / 38Serious citations (G–I) — State benchmarkedThis home is ranked 29th out of 38 homes in Virginia. Shows G–I scope serious health citations for this facility versus other Virginia SNFs. Lower counts rank better.Click the rank badge to see the full State ranking.Click here to see the full State ranking.
300% worse than Virginia average

Virginia average: 1

0 critical citations Virginia average: 0.4

4 serious citations Virginia average: 1

57 moderate citations Virginia average: 36.3

1 minor citation Virginia average: 0.8
Citations history (last 7 years)
Abuse/Neglect moderate citation Sep 18, 2024
Corrected

Abuse/Neglect moderate citation Sep 18, 2024
Corrected

Administration moderate citation Sep 18, 2024
Corrected

Administration moderate citation Sep 18, 2024
Corrected

Staffing Data

Reporting period: October 1 – December 31, 2025 (Q4 2025). Source: CMS Payroll-Based Journal report.

Total staff 120
Employees 78
Contractors 42
Staff to resident ratio 1.46:1
12% worse than Virginia average
Virginia average ratio: 1.67:1 Virginia average ratio: 1.67:1See full Virginia ranking
Avg staff/day 39
Average shift 8.6 hours
8% better than Virginia average
Virginia average: 8 hours Virginia average shift: 8 hoursSee full Virginia ranking
Total staff hours (quarter) 31,035

Nursing staff breakdown

Q4 2025 · Oct 1 – Dec 31 More info This data comes from the CMS Payroll-Based Journal report covering October 1 – December 31, 2025.
Registered Nurse

Manages medical care and health needs.

RN Staff 18
Average shift length Info Average shift length. Calculated as total hours divided by days worked and average staff per day. 8.8 hours

This role is partially covered by contractors.

Licensed Practical Nurse

Assists with medical care and medications.

LPN Staff 22
Average shift length Info Average shift length. Calculated as total hours divided by days worked and average staff per day. 9.9 hours

This role is partially covered by contractors.

Certified Nursing Assistant

Helps with daily care and mobility.

CNA Staff 41
Average shift length Info Average shift length. Calculated as total hours divided by days worked and average staff per day. 9.4 hours

This role is partially covered by contractors.

Contractor staffing

Q4 2025 · Oct 1 – Dec 31 More info This data comes from the CMS Payroll-Based Journal report covering October 1 – December 31, 2025.

Total hours from contractors

13.4%

4,163 contractor hours this quarter

Certified Nursing Assistant: 11 Registered Nurse: 9 Licensed Practical Nurse: 5 Occupational Therapy Assistant: 4 Respiratory Therapy Technician: 3 Physical Therapy Aide: 2 Speech Language Pathologist: 2 Clinical Nurse Specialist: 1 Medical Director: 1 Qualified Social Worker: 1 Physical Therapy Assistant: 1 Occupational Therapy Aide: 1 RN Director of Nursing: 1

Staff by category

Q4 2025 · Oct 1 – Dec 31 More info This data comes from the CMS Payroll-Based Journal report covering October 1 – December 31, 2025.
Certified Nursing Assistant30114112,19392100%9.4
Licensed Practical Nurse175227,67092100%9.9
Registered Nurse99183,09092100%8.8
Nurse Aide in Training9091,7668997%8.8
Clinical Nurse Specialist5161,6646773%7.9
Speech Language Pathologist0228256571%7
Dietitian1015557480%7.5
Dental Services Staff1015006571%7.7
Administrator1014966267%8
Physical Therapy Aide0224916065%7.2
Nurse Practitioner1014325459%8
Physical Therapy Assistant0114006470%6.2
Other Dietary Services Staff3033615054%6.9
Qualified Social Worker0112494549%5.5
Occupational Therapy Aide1122232729%7.9
Respiratory Therapy Technician033592527%2.4
Occupational Therapy Assistant044375054%0.7
Medical Director011256672%0.4
RN Director of Nursing011222%1.2
41 Certified Nursing Assistant
% of Days 100%
22 Licensed Practical Nurse
% of Days 100%
18 Registered Nurse
% of Days 100%
9 Nurse Aide in Training
% of Days 97%
6 Clinical Nurse Specialist
% of Days 73%
2 Speech Language Pathologist
% of Days 71%
1 Dietitian
% of Days 80%
1 Dental Services Staff
% of Days 71%
1 Administrator
% of Days 67%
2 Physical Therapy Aide
% of Days 65%
1 Nurse Practitioner
% of Days 59%
1 Physical Therapy Assistant
% of Days 70%
3 Other Dietary Services Staff
% of Days 54%
1 Qualified Social Worker
% of Days 49%
2 Occupational Therapy Aide
% of Days 29%
3 Respiratory Therapy Technician
% of Days 27%
4 Occupational Therapy Assistant
% of Days 54%
1 Medical Director
% of Days 72%
1 RN Director of Nursing
% of Days 2%

Penalties and fines

Includes penalties issued in 2024

Federal penalties imposed by CMS for regulatory violations, including civil money penalties (fines) and denials of payment for new Medicare/Medicaid admissions.

Source: CMS Penalties Database (Data as of Jan 2026)

Total fines amount $78K Rank #86 / 89Federal fines — State benchmarkedThis home is ranked 86th out of 89 homes in Virginia. Shows this facility's cumulative CMS federal fine dollars versus the Virginia average among facilities with fines, and where it ranks among 89 skilled nursing facilities in the pool. Lower total dollars mean a better rank.Click the rank badge to see the full State ranking.Click here to see the full State ranking.
50% higher than Virginia average

Virginia average: $52K

Number of fines 1
43% fewer fines than Virginia average

Virginia average: 1.8

Payment Denials Info Serious action where Medicare and/or Medicaid temporarily stops payments for new residents until issues are fixed. 0
100% fewer payment denials than Virginia average

Virginia average: 0.1

Fines amount comparison
This facility $78K
Virginia average $52K
Penalty History

Penalties are imposed by CMS for violations of federal nursing home regulations.

1 penalty in the past 3 years

Sep 18, 2024 · $78K

Civil Money Penalty Info Fines imposed for noncompliance, which can be assessed per day or per instance of violation. Sep 18, 2024
$78K

Last updated: Jan 2026

Quality of care over time

These measures show how residents usually do over time at this home, based on health outcomes and preventive care.

High-risk clinical events score Info A composite score based on pressure ulcers, falls with injury, weight loss, walking ability decline, and activities of daily living decline. 11.8
16% worse than Virginia average

Virginia average: 10.1

Functional decline score Info A composite score based on activities of daily living decline, walking ability decline, and incontinence. 19.0
In line with Virginia average

Virginia average: 19.7

Long-stay resident measures
Need for Help with Daily Activities Increased Info Percent of long-stay residents whose need for help with daily activities has increased 16.8%
In line with Virginia average

Virginia average: 16.8%

Walking Ability Worsened Info Percent of long-stay residents whose ability to move independently worsened 28.1%
42% worse than Virginia average

Virginia average: 19.7%

Low Risk Residents with Bowel/Bladder Incontinence Info Percent of low risk long-stay residents who lose control of their bowels or bladder 12.2%
46% better than Virginia average

Virginia average: 22.6%

Falls with Major Injury Info Percent of long-stay residents experiencing one or more falls with major injury 3.3%
9% better than Virginia average

Virginia average: 3.6%

High Risk Residents with Pressure Ulcers Info Percent of long-stay high risk residents with pressure ulcers 4.6%
15% better than Virginia average

Virginia average: 5.4%

Urinary Tract Infection Info Percent of long-stay residents with a urinary tract infection 0.0%
100% better than Virginia average

Virginia average: 1.5%

Lost Too Much Weight Info Percent of long-stay residents who lose too much weight 6.3%
7% worse than Virginia average

Virginia average: 5.9%

Depressive Symptoms Info Percent of long-stay residents who have depressive symptoms 7.4%
50% better than Virginia average

Virginia average: 14.9%

Antipsychotic Use Info Percent of long-stay residents who received an antipsychotic medication 9.6%
25% better than Virginia average

Virginia average: 12.9%

Pneumococcal Vaccine Info Percent of long-stay residents assessed and appropriately given the pneumococcal vaccine 78.0%
15% worse than Virginia average

Virginia average: 91.3%

Influenza Vaccine Info Percent of long-stay residents assessed and appropriately given the seasonal influenza vaccine 89.3%
5% worse than Virginia average

Virginia average: 94.0%

Short-stay resident measures
Pneumococcal Vaccine Info Percent of short-stay residents assessed and appropriately given the pneumococcal vaccine 18.8%
75% worse than Virginia average

Virginia average: 74.9%

Antipsychotic medication increase Info Percent of short-stay residents who newly received an antipsychotic medication 2.3%
93% worse than Virginia average

Virginia average: 1.2%

Influenza Vaccine Info Percent of short-stay residents assessed and appropriately given the seasonal influenza vaccine 30.5%
59% worse than Virginia average

Virginia average: 73.6%

Breakdown by payment type

Medicare

29% of new residents, usually for short-term rehab.

Typical stay 14 days

Private pay

67% of new residents, often for short stays.

Typical stay 3 - 4 months

Medicaid

3% of new residents, often for long-term daily care.

Typical stay 8 months

Facility Characteristics

Source: CMS Long-Term Care Facility Characteristics (Data as of Jan 2026)

Total residents 82
Medicare
11
13.4% of residents
Medicaid
66
80.5% of residents
Private pay or other
5
6.1% of residents
Programs & Services
Residents Group

Residents meet regularly to discuss policies, care quality, and activities

Active Resident Council

Organized group of residents that meets regularly to discuss facility policies, quality of life, and activities.

Finances and operations

Privately-owned community
Operated by a business corporation.
Home revenue
$11.3M
Profit
$927.2K
Privately-owned community Operated by a business corporation.
Home revenue
$11.3M Rank #75 / 85Revenue — State benchmarkedThis home is ranked 75th out of 85 homes in Virginia. Shows this facility's annual revenue compared to the Virginia SNF average. Higher revenue generally means more resources for staffing and capital — read alongside Payroll %.Click the rank badge to see the full State ranking.Click here to see the full State ranking.
Profit
$927.2K
Payroll costs Info The portion of the home's budget spent on staff, including nurses, caregivers, and other employees who support care and operations. Rank #78 / 85Payroll — State benchmarkedThis home is ranked 78th out of 85 homes in Virginia. Shows total annual staff payroll benchmarked to the Virginia average. Higher payroll investment relative to peers often signals better staffing and less reliance on cheaper contract labor.Click the rank badge to see the full State ranking.Click here to see the full State ranking.
$5.5M
48.6% of revenue Rank #33 / 85Payroll % — State benchmarkedThis home is ranked 33rd out of 85 homes in Virginia. Shows payroll as a percentage of revenue versus the Virginia average. Well-run Virginia SNFs typically land around 51–60% — the top third Statewide. Below 25% may signal understaffing or heavy agency use — read with Staffing ratings.Click the rank badge to see the full State ranking.Click here to see the full State ranking.
Other operating costs Info All remaining costs needed to run the home, such as food, utilities, building maintenance, supplies and administrative expenses.
$4.9M
Total costs $10.4M

What does this home offer?

Pets allowed icon
Pets allowed icon

Pets Allowed

Room sizes icon
Room sizes icon

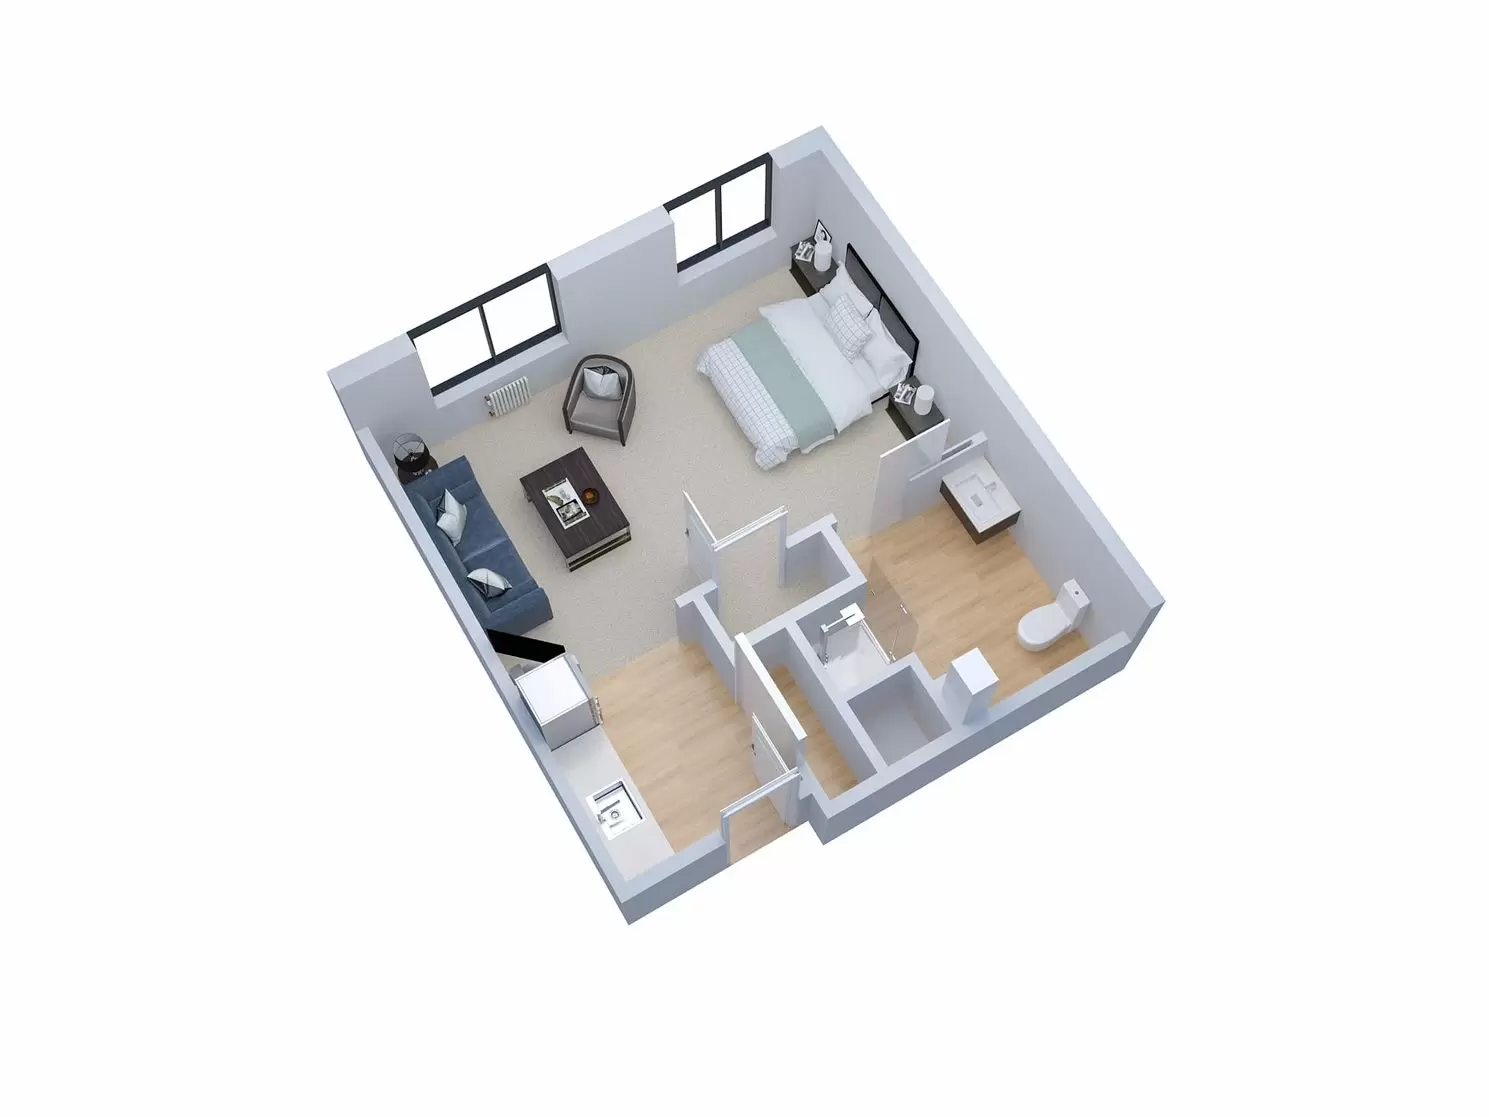
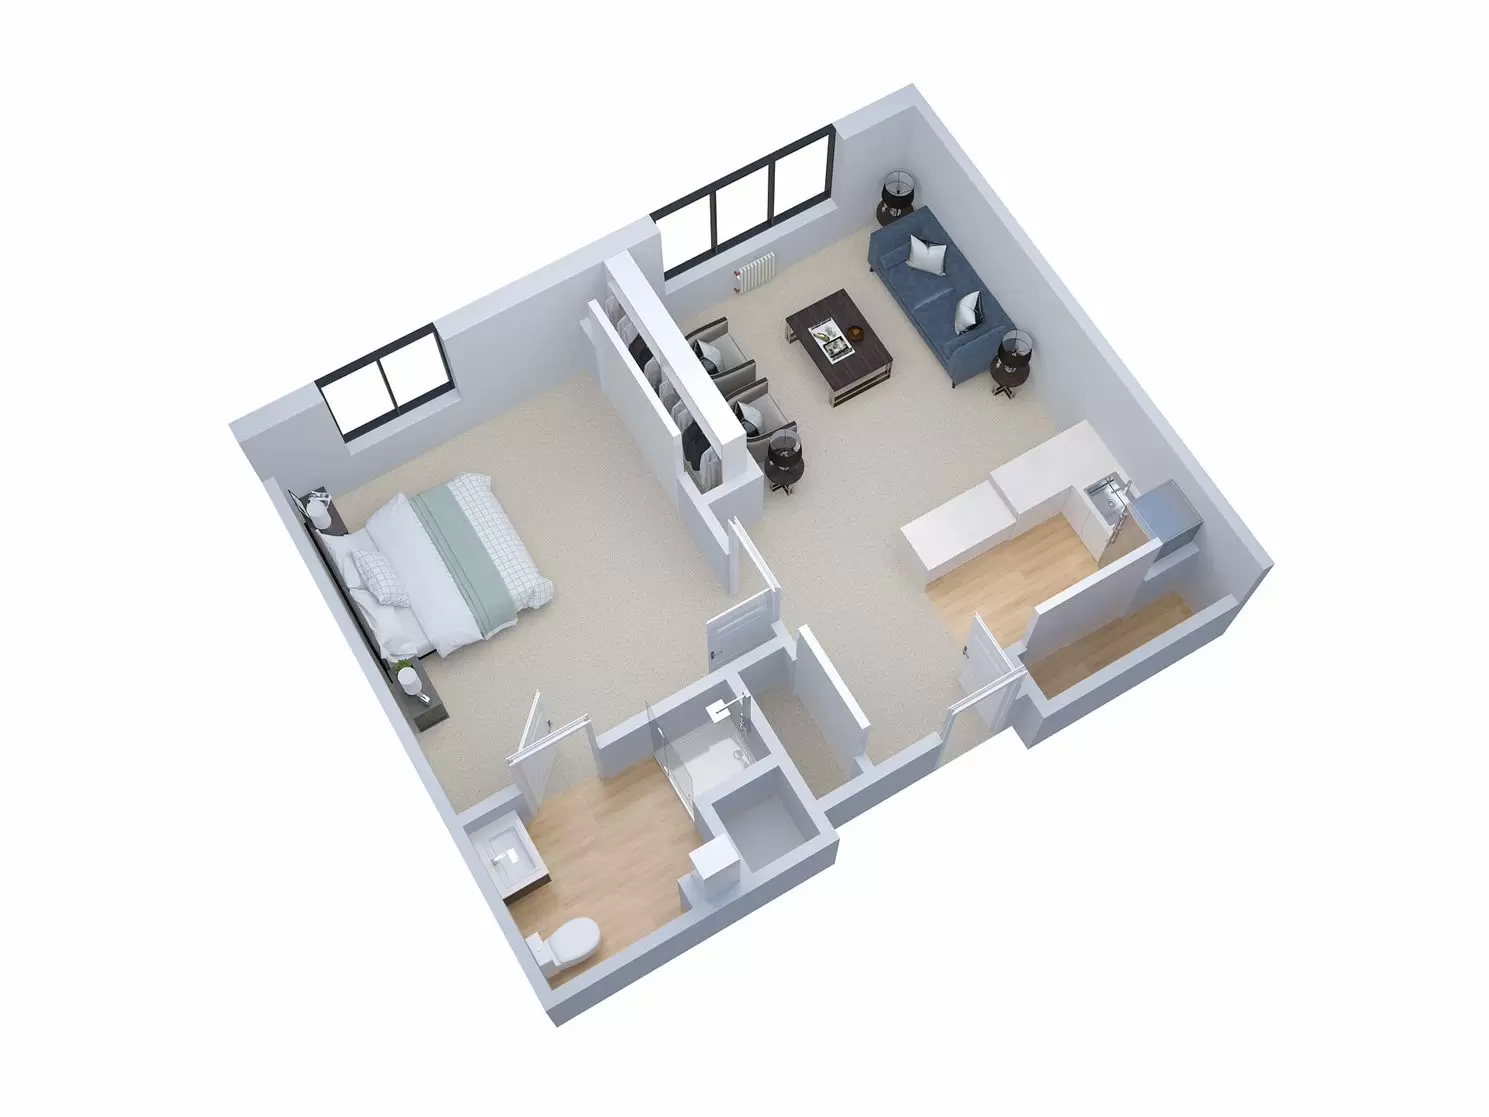
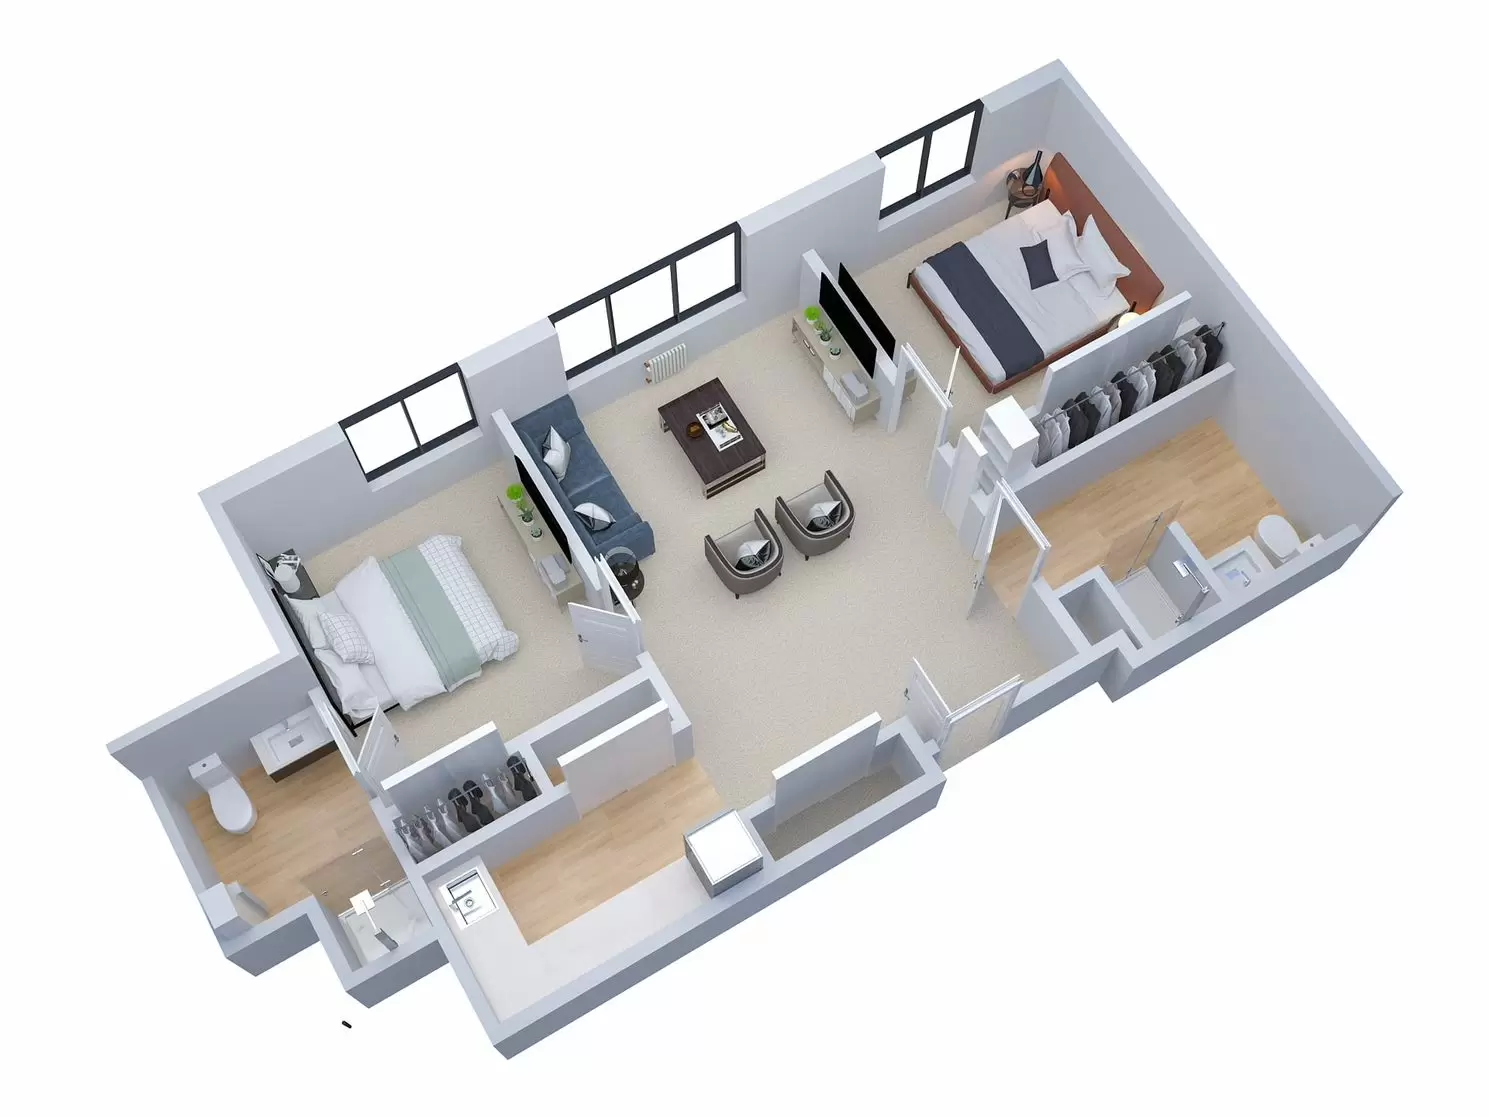
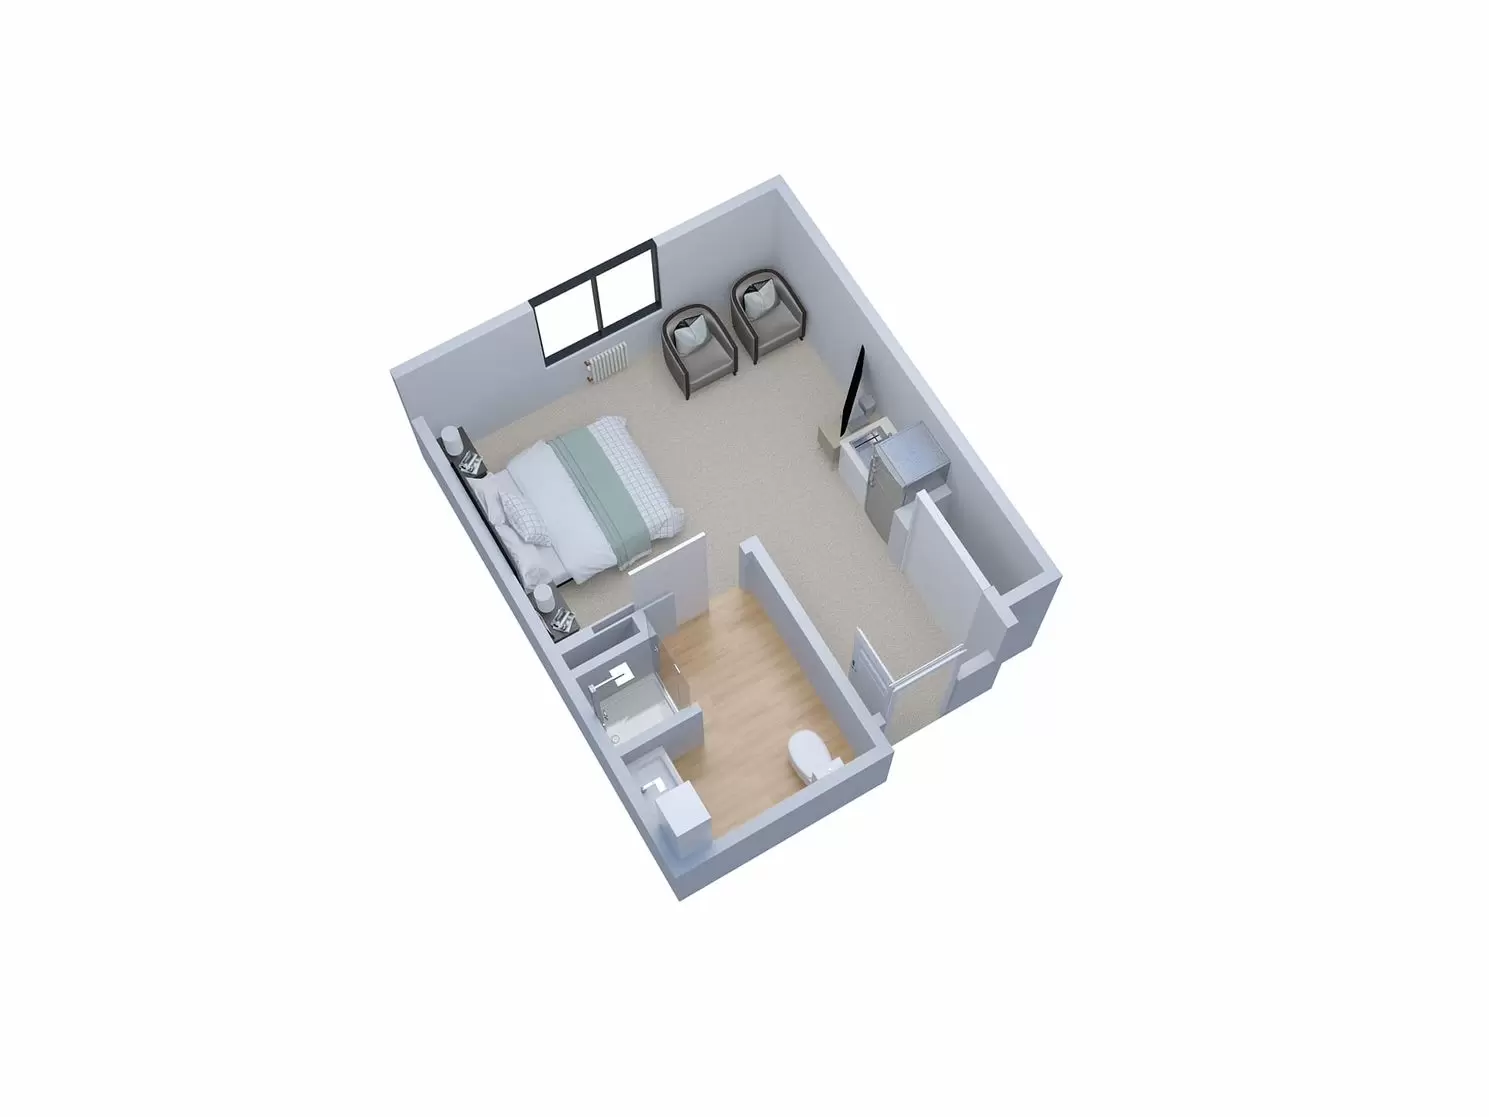
Room Sizes: 374 / 514 / 686 sq. ft

Housing options icon

Housing Options: Studio / 1 Bed / 2 Bed

Who this home usually serves

TYPE OF STAY

Primarily short stays

Residents typically stay for brief periods, with frequent admissions and discharges throughout the year.

Living Spaces & Floor Plans for Discovery Commons Virginia Beach

Discovery Commons Virginia Beach Layout1
Discovery Commons Virginia Beach Layout2
Discovery Commons Virginia Beach Layout3
Discovery Commons Virginia Beach Layout4
Discovery Commons Virginia Beach Layout5

Places of interest near Discovery Commons Virginia Beach

Address 4.2 miles from city center Info Estimated distance in miles from Virginia Beach's city center to Discovery Commons Virginia Beach's address, calculated via Google Maps. — 0.2 miles to nearest hospital (Sentara Virginia Beach General Hospital)

Calculate Travel Distance to Discovery Commons Virginia Beach

Add your location

Address

Financial Assistance for
Nursing Home in Virginia

Discovery Commons Virginia Beach is located in Virginia Beach, Virginia.
Here are the financial assistance programs available to residents in Virginia.

Get Financial aid guidance

Commonwealth Coordinated Care Plus (CCC Plus)

VA Medicaid CCC Plus

Age 65+ or disabled
General Virginia resident, Medicaid-eligible, nursing home-level care need.
Income Limits (2025) ~$2,829/month 300% FBR, individual
Asset Limits $2,000 (individual), $3,000 (couple).
VA

Managed care model; high demand in urban areas.

Benefits
Personal care (5-7 hours/day) Respite (240 hours/year) Adult day care ($65/day) Home modifications ($1,500 avg.)

Virginia Respite Care Grant Program

VA Respite Grant

Age Caregiver of someone 60+
General Virginia resident.
Income Limits ~$2,500/month individual, varies
Asset Limits $40,000 individual
VA

Limited grants; rural/urban balance.

Benefits
In-home respite (up to 30 days/year) Adult day care (~$65/day) Facility respite (up to 5 days)

Adult Services Program

Virginia Adult Services (AS)

Age 60+ (or disabled 18+)
General VA resident, need significant care (2+ ADLs), not Medicaid-eligible.
Income Limits (2025) Varies by locality; typically < ~$2,510/month 200% FPL
Asset Limits Limited assets (excludes home, car); varies by DSS.
VA

Serves ~5,000 annually; focuses on low-income independence.

Benefits
Personal care (4-6 hours/week) Adult day care (~$60/day) Chore services Assessments Respite (~5 days/year)

Auxiliary Grant Program

Virginia Auxiliary Grant (AG)

Age 65+ (or disabled 18+)
General VA resident, living in approved ALF/foster care, SSI-eligible or low-income.
Income Limits (2025) ~$1,041/month (individual, SSI level + $20 disregard); higher with medical deductions.
Asset Limits $2,000 individual
VA

Serves 4,000; personal needs allowance ($90/month).

Benefits
Cash (~$1,400-$1,700/month in 2025, varies by region) for ALF/foster care costs; basic care included

Medicare Savings Program (MSP)

Virginia Medicare Savings Program

Age 65+ or disabled
General VA resident, Medicare Part A/B.
Income Limits (2025) ~$2,510/month (QMB), ~$3,380/month (SLMB), ~$3,598/month (QI)—individual.
Asset Limits $9,430 (individual), $14,130 (couple).
VA

Includes Extra Help for Part D; no waitlist.

Benefits
Covers Part B premiums ($174.70/month) Deductibles ($240/year) Copays (~20%)

Energy Assistance Program (EAP)

Virginia Energy Assistance Program

Age 60+ prioritized
General VA resident, low-income household.
Income Limits (2025) ~$3,970/month 185% FPL
Asset Limits Not assessed.
VA

Fuel, Crisis, Cooling components; serves ~100,000 households.

Benefits
Heating/cooling aid ($300-$1,000/season) Crisis aid ($500 max) Equipment repair (~$250)

VA Aid and Attendance (A&A) and Housebound Benefits

Virginia VA Aid and Attendance/Housebound

Age 65+ or disabled veteran/spouse
General VA resident, wartime service, ADL help (A&A) or homebound.
Income Limits (2025) Net income < ~$1,984/month (veteran with dependent, A&A); pension offsets income.
Asset Limits ~$155,356 net worth
VA

High veteran population; supports rural/urban needs.

Benefits
Cash (~$1,433-$2,642/month veteran, ~$951-$1,318 spouse) for care costs

Property Tax Relief for the Elderly and Disabled

Virginia Property Tax Relief

Age 65+ or disabled
General VA resident, homeowner, income/asset limits vary by locality.
Income Limits (2025) ~$50,000-$75,000/year household, e.g., Fairfax: $72,000; Richmond: $50,000
Asset Limits Varies e.g., Fairfax: $400,000 net worth; Richmond: $100,000
VA

Offered in 90% of localities; saves ~$500-$2,000/year.

Benefits
Tax exemption/deferral (~$500-$2,000/year depending on locality)

Senior Farmers’ Market Nutrition Program (SFMNP)

Virginia SFMNP

Age 60+
General VA resident, low-income.
Income Limits (2025) ~$2,322/month 185% FPL
Asset Limits Not assessed.
VA

Vouchers (~$50-$75/season); serves ~15,000 via AAAs.

Benefits
Vouchers (~$50-$75/season) for produce at farmers’ markets

Frequently Asked Questions about Discovery Commons Virginia Beach

What neighborhood is Discovery Commons Virginia Beach in?

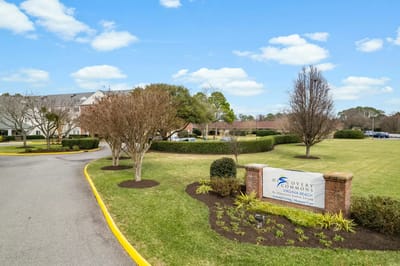
Discovery Commons Virginia Beach is in the North Virginia Beach neighborhood of Virginia Beach.

Is Discovery Commons Virginia Beach in a walkable area?

Discovery Commons Virginia Beach has a walk score of 35. Somewhat walkable. A few nearby services may be reachable on foot, but most trips require transportation.

When does Discovery Commons Virginia Beach's license expire?

According to VA state health department records, Discovery Commons Virginia Beach's license expires on November 11, 2025.

Who is the administrator of Discovery Commons Virginia Beach?

Brooke Bravo is the administrator of Discovery Commons Virginia Beach.

How many beds does Discovery Commons Virginia Beach have?

Discovery Commons Virginia Beach has 153 beds.

Has Discovery Commons Virginia Beach had any recent deficiencies or citations?

Discovery Commons Virginia Beach has had 11 recently reported deficiencies.

What is the phone number of Discovery Commons Virginia Beach?

(757) 496-8001 will put you in contact with the team at Discovery Commons Virginia Beach.

Guides for Better Senior Living

Care Cost Calculator: See Prices in Your Area

Nursing Home Data Explorer

Don’t Wait Too Long: 7 Red Flag Signs Your Parent Needs Assisted Living Now

The True Cost of Assisted Living in 2025 – And How Families Are Paying For It

Understanding Senior Living Costs: Pricing Models, Discounts & Financial Assistance

Explore Open Rooms
1 Contact details
2 What type of senior care service are you looking for?
3 What budget do you have in mind for senior care?
4 How soon do you need to find care?
5 Additional details

Thank you for your interest!

Our team will be in touch shortly to help with next steps.