Atlantic Shores
Nursing Home, Independent Living, Assisted Living & Memory Care · Virginia Beach, VA
CMS overall rating Info The Overall CMS Rating is scored from 1 to 5 stars and combines results from health inspections, staffing levels, and quality measures. Health inspections carry the most weight. Staffing and quality scores can increase or decrease the final rating based on performance compared to state and national standards.

Atlantic Shores

Nursing Home, Independent Living, Assisted Living & Memory Care · Virginia Beach, VA
CMS overall rating Info The Overall CMS Rating is scored from 1 to 5 stars and combines results from health inspections, staffing levels, and quality measures. Health inspections carry the most weight. Staffing and quality scores can increase or decrease the final rating based on performance compared to state and national standards.
Calculator: See prices in your area
Atlantic Shores accepts Medicare and private pay.

Overview of Atlantic Shores

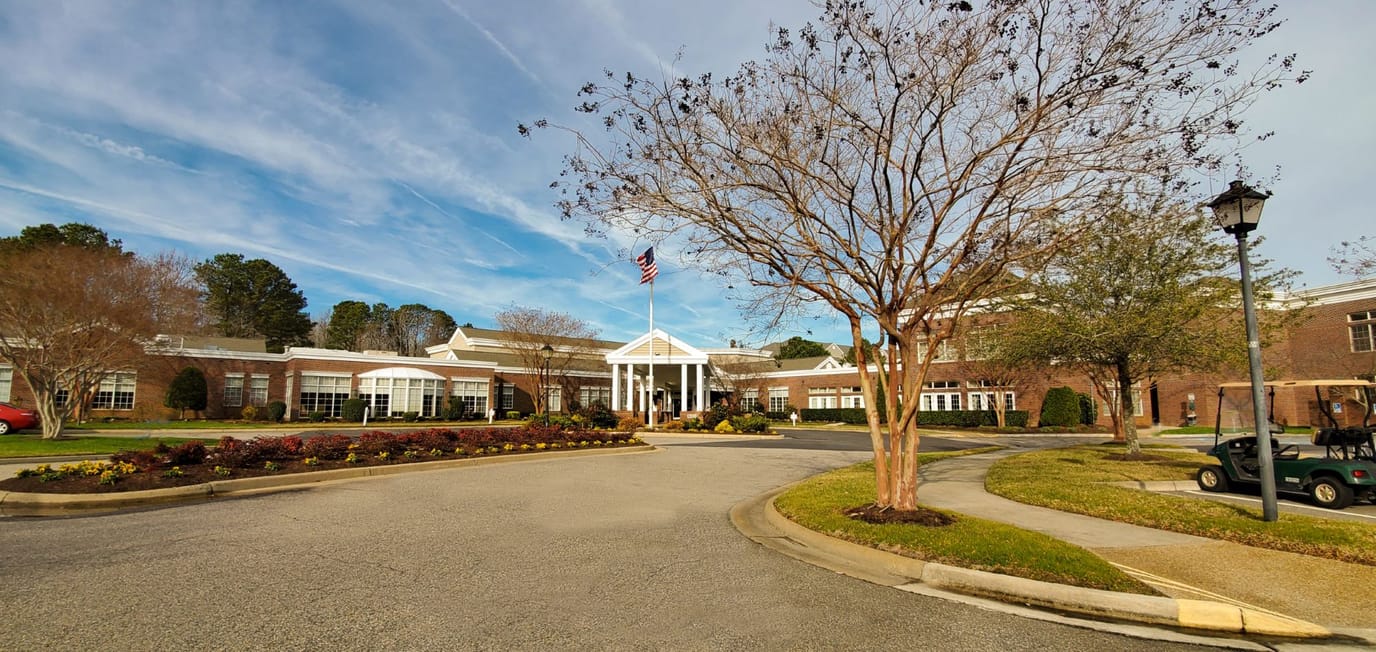
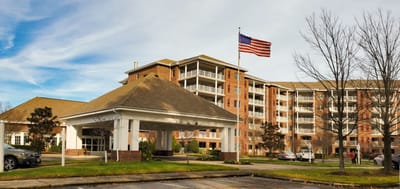
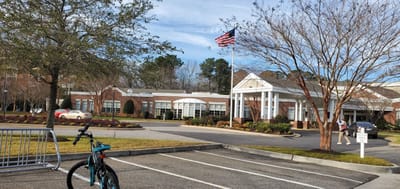
Atlantic Shores is a 55+ retirement community in Virginia Beach, VA, that offers independent living, assisted living, memory care, and skilled nursing. The community promotes a supportive and welcoming environment to ensure older adults can keep their peace of mind during their stay. Exceptional services, including housekeeping, well-balanced meals, and concierge services, are also provided, so residents have a maintenance-free lifestyle. Focusing on residents’ holistic wellness, the community also creates care plans tailored to their unique needs and preferences.

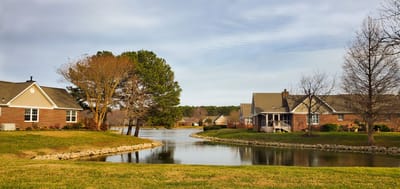
Dance, board games, and pet-friendly outings are just some of the activities that residents can participate in to stay active and have fun. Residents can also lounge and interact with their surroundings through state-of-the-art amenities, including the indoor pool, fitness center, and beautifully maintained gardens. With its scenic setting near Lake Redwing and various leisure sites, residents are guaranteed a stress-free retirement. This retirement community has high standards of care, making it one of the best choices for senior living in Virginia.

(757) 716-2000

Managed by Tripp Little

Associate Executive Director

Tripp Little oversees all day-to-day operations at Atlantic Shores, including food and beverage, housekeeping, resident services, security, and plant services. He develops budget plans to enhance community revenue and profitability while supporting and inspiring staff. Tripp joined Atlantic Shores in 2007 and brings valuable experience from private clubs and food and beverage management. He holds a BA in English and communications and is licensed as a real estate agent and a long-term care administrator.

Quality ratings

Measured by Centers for Medicare & Medicaid Services (CMS)

Overall rating Info The Overall CMS Rating combines results from health inspections, staffing levels and quality measures. Health inspections carry the most weight. Staffing and quality scores can increase or decrease the final rating based on performance compared to state and national standards.
▼ 21.5% Below VA avg.
Health Inspection Info Based on the results of the facility's three most recent standard inspections and any complaint investigations. CMS reviews the number, scope, and severity of deficiencies, with more recent findings weighted more heavily.
▼ 10.4% Below VA avg.
Staffing Info Measures average nursing staff hours per resident per day, including Registered Nurses (RNs) and total nursing staff. Ratings are adjusted based on the level of care residents require and are compared to state and national benchmarks.
▲ 10.8% Above VA avg.
Quality Measures Info Based on clinical and physical health indicators reported to CMS, such as hospital readmissions, falls, pressure ulcers, and improvements in mobility. These measures reflect how well residents' health needs are being managed.
At VA avg.

Staffing hours breakdown

Info Daily nursing hours per resident by staff type, reported to CMS. Higher is generally better — compare this facility to state and national averages to see where staffing stands.

Hours per resident per day — compared to Virginia state averages

Total nursing care / resident Info This home is ranked 25th out of 63 homes in Virginia.

Total adjusted nursing hours per resident per day, combining RN, LPN, and aide time. CMS adjusts this for case-mix so facilities can be fairly compared.
4h 35m per day
Rank #25 / 63Nurse hours — state benchmarkedThis home is ranked 25th out of 63 homes in Virginia.Shows adjusted nurse hours per resident per day benchmarked to the Virginia average, with a ranking across 63 Virginia SNFs. More hours mean more direct care. The national average is about 3.5 hrs; below 3.0 is a red flag.
This facility Virginia avg (4h 47m per day)
vs Virginia avg
-4%
Staff type Hours / day vs state avg
Total Nursing (Weekend) Info Combined nursing hours (RN + LPN + Nurse Aide) per resident per day on weekends. Staffing often drops on weekends — this figure reveals whether the facility maintains adequate coverage outside of weekday hours. 3h 42m per day

Capacity and availability

This home usually has availability

Occupancy lower than 85% suggests more openings may be available.

Lower occupancy than the Virginia average: 85.7%
Occupancy rate 71.5% Rank #45 / 66Occupancy rate — state benchmarkedThis home is ranked 45th out of 66 homes in Virginia.Shows this facility's occupancy rate versus the Virginia average, with its statewide rank out of 66. Higher occupancy signals strong local demand and financial stability.
Avg. Length of Stay 38 days
Occupancy rate
71.5% Rank #45 / 66Occupancy rate — state benchmarkedThis home is ranked 45th out of 66 homes in Virginia.Shows this facility's occupancy rate versus the Virginia average, with its statewide rank out of 66. Higher occupancy signals strong local demand and financial stability.
Avg. Length of Stay
38 days

Who this home usually serves

TYPE OF STAY

Mostly short-term rehab stays

Most residents typically stay for a few weeks or months before returning home or moving on.

Breakdown by payment type

Medicare

78% of new residents, usually for short-term rehab.

Typical stay 22 days

Private pay

22% of new residents, often for short stays.

Typical stay 3 - 4 months

Finances and operations

Privately-owned community
Operated by a business corporation.
Home revenue
$46.2M
Profit
$5.1M
Privately-owned community Operated by a business corporation.
Home revenue
$46.2M Rank #13 / 63Revenue — state benchmarkedThis home is ranked 13th out of 63 homes in Virginia.Shows this facility's annual revenue compared to the Virginia SNF average. Higher revenue generally means more resources for staffing and capital — read alongside Payroll %.
Profit
$5.1M
Payroll costs Info The portion of the home's budget spent on staff, including nurses, caregivers, and other employees who support care and operations. Rank #10 / 63Payroll — state benchmarkedThis home is ranked 10th out of 63 homes in Virginia.Shows total annual staff payroll benchmarked to the Virginia average. Higher payroll investment relative to peers often signals better staffing and less reliance on cheaper contract labor.
$18.5M
40.1% of revenue Rank #18 / 63Payroll % — state benchmarkedThis home is ranked 18th out of 63 homes in Virginia.Shows payroll as a percentage of revenue versus the Virginia average. Well-run SNFs often land around 55–65%. Below 25% may signal understaffing or heavy agency use — read with Staffing ratings.
Other operating costs Info All remaining costs needed to run the home, such as food, utilities, building maintenance, supplies and administrative expenses.
$22.6M
Total costs $41.1M
Years in operation
31 years in operation
A longer operating history, which may indicate experience navigating regulations and delivering ongoing care.
Walk Score
Walk Score: 8 / 100 Rank #60 / 66Walk Score — state benchmarkedThis home is ranked 60th out of 66 homes in Virginia.Shows how walkable this facility's neighborhood is compared to the average Walk Score across Virginia SNFs. Higher scores benefit residents, families, and staff.
Car-dependent. Most errands require a car, with limited nearby walkable options.
BBB Rating
BBB Rating: A+ (Not Accredited)
An independent rating from the Better Business Bureau based on factors such as complaint history, transparency, and business practices.
How BBB ratings work

About this community

Awards

Awards2025 Best of Gold winner by Virginia Media, Southside Gold winner in the Coastal Virginia Magazine Best of Readers’ Choice Awards, 2024 World’s Best Culture Award by Drive Culture Outcomes, Top Retirement Community by Virginia Living.

License Details

CMS Certification Number495324

Staffing

Key information about the people who lead and staff this community.

Leadership

ContactMrs. Jenny Maugeri, Executive Director

Therapy & Rehabilitation

1 service
Rehabilitation Services

Amenities & Lifestyle

Pet-Friendly
Landscaped Campus
Dining Services
Wellness Center
Community Activities
ActivitiesEvents, classes, parties, excursions are hosted throughout the year.
Specific ProgramsPrograms & Activities

Dining & Nutrition

Food DescriptionAtlantic Shores offers award-winning cuisine as part of its dining services.

What does this home offer?

Pets allowed icon
Pets allowed icon

Pets Allowed

Room sizes icon
Room sizes icon

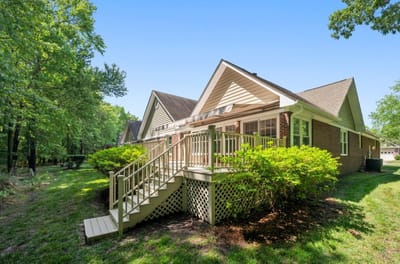
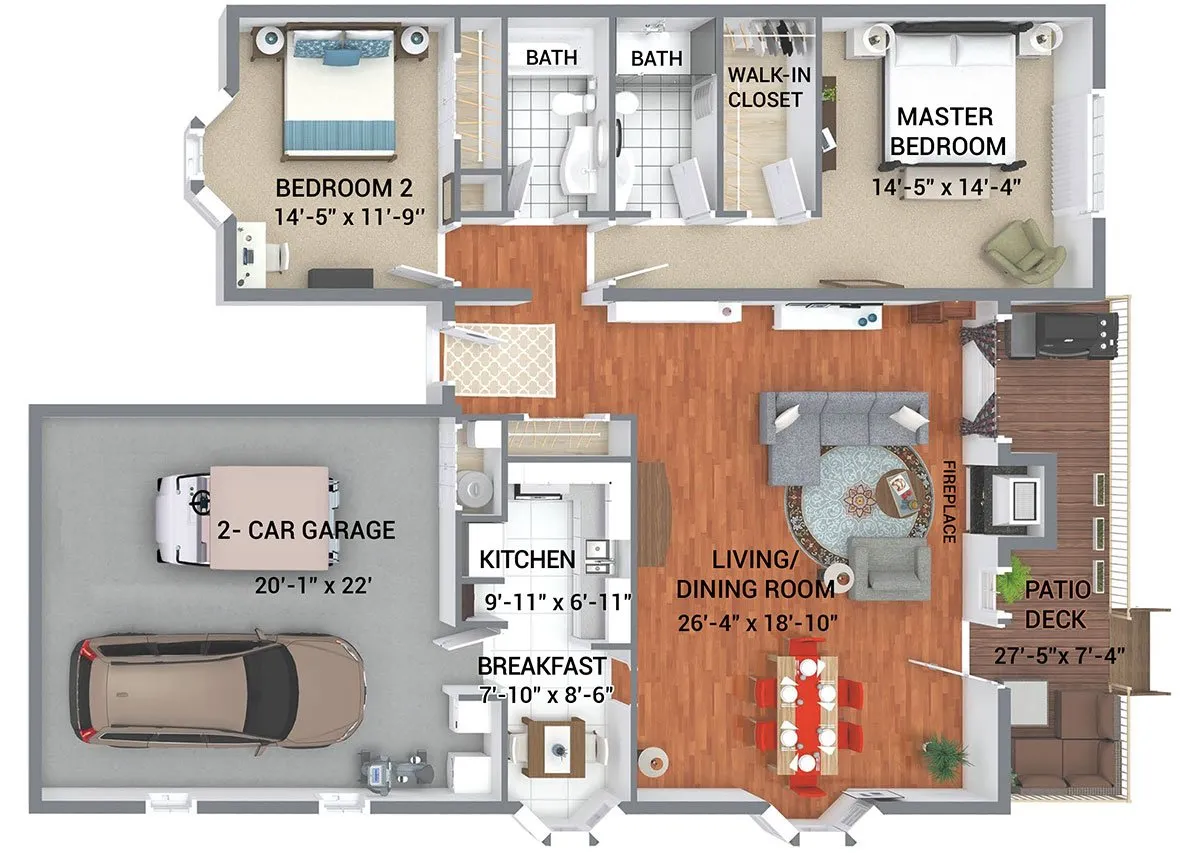
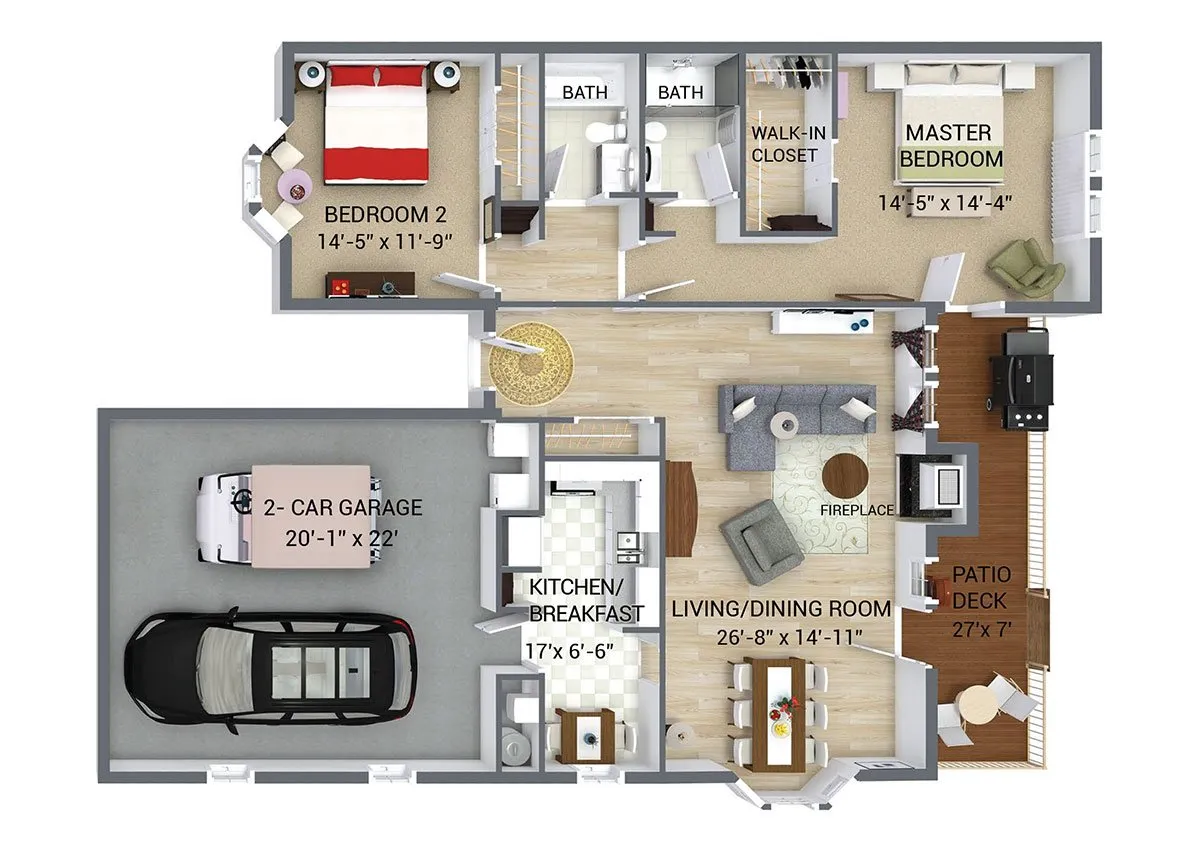
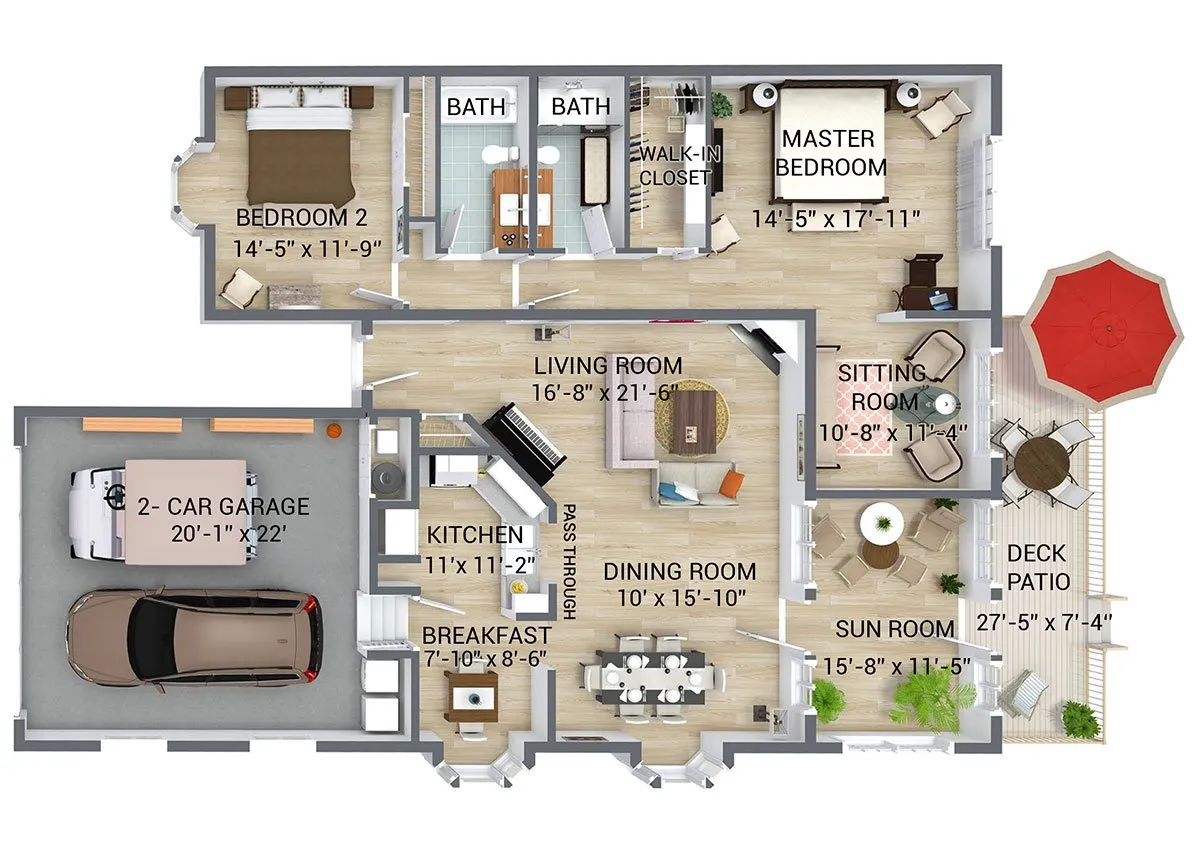
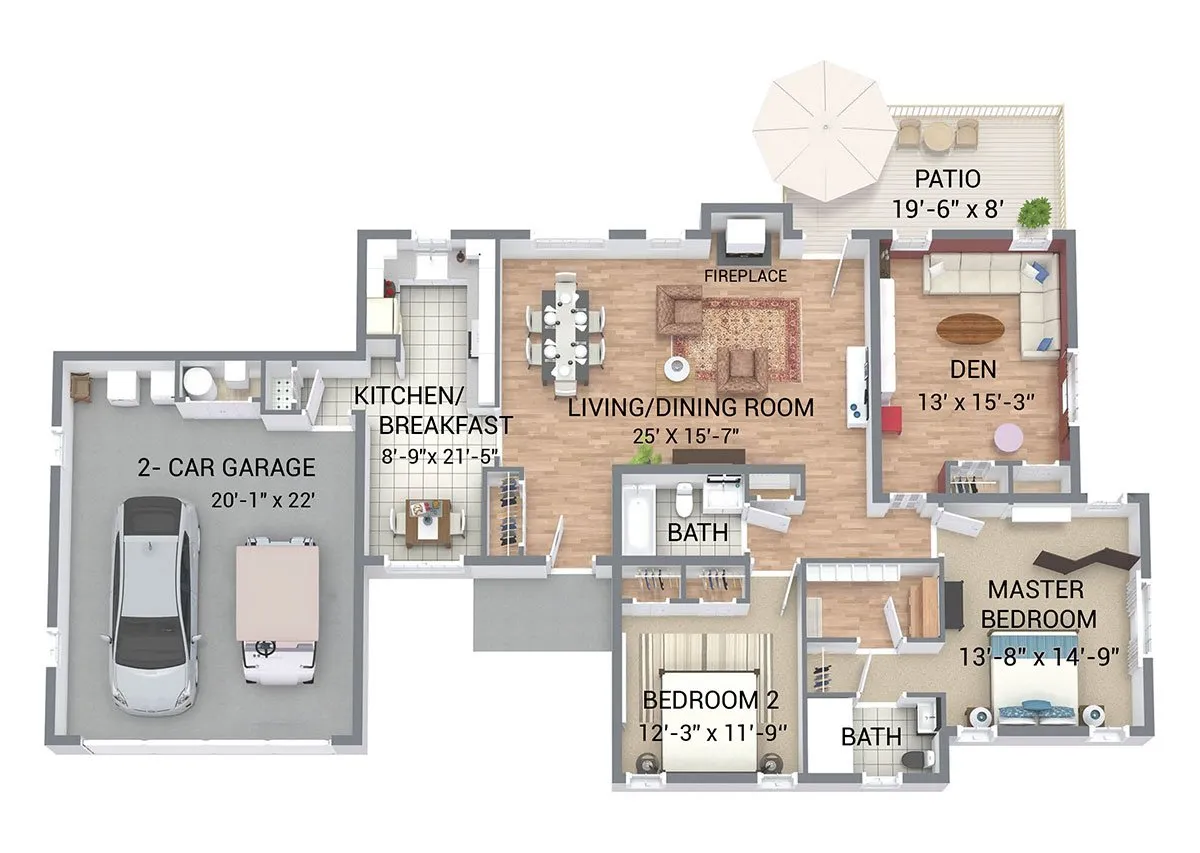
Room Sizes: 683 / 1,021 - 1,839 sq. ft

Housing options icon

Housing Options: 1 Bed / 2 Bed

Building type icon
Building type icon

Building Type: Mid-rise

Transportation services icon

Transportation Services

Fitness and recreation icon

Fitness and Recreation

Types of Care at Atlantic Shores

Independent Living Assisted Living Memory Care Nursing Home

Contact Atlantic Shores

Health Inspection History

Inspections
Total health inspections 3

Virginia average 4.2


Last Health inspection on Jan 2022

Total health citations
23 Rank #28 / 64Health citations — state benchmarkedThis home is ranked 28th out of 64 homes in Virginia.Shows this facility's total health deficiency citations benchmarked to the Virginia state average, with a ranking across all 64 VA SNFs. Lower citation counts earn a better rank.

Virginia average 38.4

Citations per inspection
7.67 Rank #33 / 64Citations per inspection — state benchmarkedThis home is ranked 33rd out of 64 homes in Virginia.Shows average deficiency citations per CMS inspection for this facility versus the Virginia mean across 64 SNFs with citation data. Lower is better.

Virginia average 8.93


Health citations are formal notices following inspections when they fail to comply with safety and care standards.

All 23 citations resulted from standard inspections.

Breakdown of citation severity (last 9 years)
Critical Health citations More info
0
100% better than Virginia average

Virginia average: 0.4


Serious Health citations More info 0
100% better than Virginia average

Virginia average: 1

0 critical citations More info Virginia average: 0.4

0 serious citations More info Virginia average: 1

22 moderate citations More info Virginia average: 36.3

1 minor citation More info Virginia average: 0.8
Citations history (last 9 years)
Infection Control moderate citation Info Issues related to preventing and controlling infections, including hygiene practices and safety protocols. Jan 06, 2022
Corrected

Infection Control moderate citation Info Issues related to preventing and controlling infections, including hygiene practices and safety protocols. Jan 06, 2022
Corrected

Nursing Services moderate citation Info Issues related to the availability and quality of nursing staff and the care they provide. Jan 06, 2022
Corrected

Nursing Services moderate citation Info Issues related to the availability and quality of nursing staff and the care they provide. Jan 06, 2022
Corrected

Living Spaces & Floor Plans for Atlantic Shores

Atlantic Shores P4
Atlantic Shores P3
Atlantic Shores P2
Atlantic Shores P1

Financial Assistance for
Nursing Home in Virginia

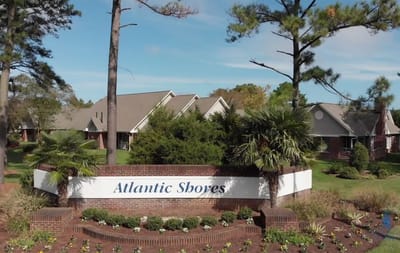
Atlantic Shores is located in Virginia Beach, Virginia.
Here are the financial assistance programs available to residents in Virginia.

Get Financial aid guidance

Commonwealth Coordinated Care Plus (CCC Plus)

VA Medicaid CCC Plus

Age 65+ or disabled
General Virginia resident, Medicaid-eligible, nursing home-level care need.
Income Limits (2025) ~$2,829/month 300% FBR, individual
Asset Limits $2,000 (individual), $3,000 (couple).
VA

Managed care model; high demand in urban areas.

Benefits
Personal care (5-7 hours/day) Respite (240 hours/year) Adult day care ($65/day) Home modifications ($1,500 avg.)

Virginia Respite Care Grant Program

VA Respite Grant

Age Caregiver of someone 60+
General Virginia resident.
Income Limits ~$2,500/month individual, varies
Asset Limits $40,000 individual
VA

Limited grants; rural/urban balance.

Benefits
In-home respite (up to 30 days/year) Adult day care (~$65/day) Facility respite (up to 5 days)

Adult Services Program

Virginia Adult Services (AS)

Age 60+ (or disabled 18+)
General VA resident, need significant care (2+ ADLs), not Medicaid-eligible.
Income Limits (2025) Varies by locality; typically < ~$2,510/month 200% FPL
Asset Limits Limited assets (excludes home, car); varies by DSS.
VA

Serves ~5,000 annually; focuses on low-income independence.

Benefits
Personal care (4-6 hours/week) Adult day care (~$60/day) Chore services Assessments Respite (~5 days/year)

Auxiliary Grant Program

Virginia Auxiliary Grant (AG)

Age 65+ (or disabled 18+)
General VA resident, living in approved ALF/foster care, SSI-eligible or low-income.
Income Limits (2025) ~$1,041/month (individual, SSI level + $20 disregard); higher with medical deductions.
Asset Limits $2,000 individual
VA

Serves 4,000; personal needs allowance ($90/month).

Benefits
Cash (~$1,400-$1,700/month in 2025, varies by region) for ALF/foster care costs; basic care included

Medicare Savings Program (MSP)

Virginia Medicare Savings Program

Age 65+ or disabled
General VA resident, Medicare Part A/B.
Income Limits (2025) ~$2,510/month (QMB), ~$3,380/month (SLMB), ~$3,598/month (QI)—individual.
Asset Limits $9,430 (individual), $14,130 (couple).
VA

Includes Extra Help for Part D; no waitlist.

Benefits
Covers Part B premiums ($174.70/month) Deductibles ($240/year) Copays (~20%)

Energy Assistance Program (EAP)

Virginia Energy Assistance Program

Age 60+ prioritized
General VA resident, low-income household.
Income Limits (2025) ~$3,970/month 185% FPL
Asset Limits Not assessed.
VA

Fuel, Crisis, Cooling components; serves ~100,000 households.

Benefits
Heating/cooling aid ($300-$1,000/season) Crisis aid ($500 max) Equipment repair (~$250)

VA Aid and Attendance (A&A) and Housebound Benefits

Virginia VA Aid and Attendance/Housebound

Age 65+ or disabled veteran/spouse
General VA resident, wartime service, ADL help (A&A) or homebound.
Income Limits (2025) Net income < ~$1,984/month (veteran with dependent, A&A); pension offsets income.
Asset Limits ~$155,356 net worth
VA

High veteran population; supports rural/urban needs.

Benefits
Cash (~$1,433-$2,642/month veteran, ~$951-$1,318 spouse) for care costs

Property Tax Relief for the Elderly and Disabled

Virginia Property Tax Relief

Age 65+ or disabled
General VA resident, homeowner, income/asset limits vary by locality.
Income Limits (2025) ~$50,000-$75,000/year household, e.g., Fairfax: $72,000; Richmond: $50,000
Asset Limits Varies e.g., Fairfax: $400,000 net worth; Richmond: $100,000
VA

Offered in 90% of localities; saves ~$500-$2,000/year.

Benefits
Tax exemption/deferral (~$500-$2,000/year depending on locality)

Senior Farmers’ Market Nutrition Program (SFMNP)

Virginia SFMNP

Age 60+
General VA resident, low-income.
Income Limits (2025) ~$2,322/month 185% FPL
Asset Limits Not assessed.
VA

Vouchers (~$50-$75/season); serves ~15,000 via AAAs.

Benefits
Vouchers (~$50-$75/season) for produce at farmers’ markets

Places of interest near Atlantic Shores

Address 110.0 miles from city center Info Estimated distance in miles from Virginia Beach's city center to Atlantic Shores's address, calculated via Google Maps. — 5.83 miles to nearest hospital (Sentara Virginia Beach General Hospital)

Calculate Travel Distance to Atlantic Shores

Add your location

Address

Staffing Data (Q2 2025)

This data corresponds to Q2 2025 and is based on CMS Payroll-Based Journal.

Total staff 171
Employees 80
Contractors 91
Staff to resident ratio 4.50:1
170% better than Virginia average

Virginia average ratio: 1.67:1

Avg staff/day 32
Average shift 7.9 hours
0% compared with Virginia average

Virginia average: 8 hours

Total staff hours (quarter) 23,014

Nursing staff breakdown

Registered Nurse

Manages medical care and health needs.

Total count 5
Average shift length Info Average shift length. Calculated as total hours divided by days worked and average staff per day. 10.1 hours

This role is partially covered by contractors.

Licensed Practical Nurse

Assists with medical care and medications.

Total count 28
Average shift length Info Average shift length. Calculated as total hours divided by days worked and average staff per day. 9 hours

This role is partially covered by contractors.

Certified Nursing Assistant

Helps with daily care and mobility.

Total count 105
Average shift length Info Average shift length. Calculated as total hours divided by days worked and average staff per day. 8 hours

This role is partially covered by contractors.

Contractor staffing

Total hours from contractors

28.1%

6,466 contractor hours this quarter

Certified Nursing Assistant: 57 Licensed Practical Nurse: 11 Speech Language Pathologist: 7 Physical Therapy Aide: 4 Therapeutic Recreation Specialist: 3 Respiratory Therapy Technician: 2 Other Physician: 2 Registered Nurse: 1 Qualified Social Worker: 1 Physical Therapy Assistant: 1 Feeding Assistant: 1 Medical Director: 1

Staff by category

Certified Nursing Assistant 48 57 105 9,159 91 100% 8
Licensed Practical Nurse 17 11 28 4,399 91 100% 9
Speech Language Pathologist 0 7 7 1,779 64 70% 8.2
Registered Nurse 4 1 5 1,101 82 90% 10.1
Physical Therapy Aide 0 4 4 983 62 68% 8.2
Other Dietary Services Staff 2 0 2 916 79 87% 7.5
Nurse Practitioner 2 0 2 520 63 69% 8
Feeding Assistant 0 1 1 504 63 69% 8
Administrator 1 0 1 488 61 67% 8
Mental Health Service Worker 1 0 1 464 58 64% 8
RN Director of Nursing 1 0 1 456 57 63% 8
Other Social Services Staff 1 0 1 430 59 65% 7.3
Respiratory Therapy Technician 0 2 2 367 59 65% 5.5
Clinical Nurse Specialist 2 0 2 328 41 45% 8
Therapeutic Recreation Specialist 0 3 3 323 32 35% 6.5
Qualified Social Worker 0 1 1 278 59 65% 4.7
Other Physician 0 2 2 200 37 41% 4
Physical Therapy Assistant 0 1 1 156 67 74% 2.3
Occupational Therapy Aide 1 0 1 112 51 56% 2.2
Medical Director 0 1 1 52 13 14% 4
105 Certified Nursing Assistant
% of Days 100%
28 Licensed Practical Nurse
% of Days 100%
7 Speech Language Pathologist
% of Days 70%
5 Registered Nurse
% of Days 90%
4 Physical Therapy Aide
% of Days 68%
2 Other Dietary Services Staff
% of Days 87%
2 Nurse Practitioner
% of Days 69%
1 Feeding Assistant
% of Days 69%
1 Administrator
% of Days 67%
1 Mental Health Service Worker
% of Days 64%
1 RN Director of Nursing
% of Days 63%
1 Other Social Services Staff
% of Days 65%
2 Respiratory Therapy Technician
% of Days 65%
2 Clinical Nurse Specialist
% of Days 45%
3 Therapeutic Recreation Specialist
% of Days 35%
1 Qualified Social Worker
% of Days 65%
2 Other Physician
% of Days 41%
1 Physical Therapy Assistant
% of Days 74%
1 Occupational Therapy Aide
% of Days 56%
1 Medical Director
% of Days 14%

Facility Characteristics

Source: CMS Long-Term Care Facility Characteristics (Data as of Jan 2026)

Total residents 38
Medicare
11
28.9% of residents
Private pay or other
27
71.1% of residents
Programs & Services
Residents Group

Residents meet regularly to discuss policies, care quality, and activities

Active Resident Council

Organized group of residents that meets regularly to discuss facility policies, quality of life, and activities.

Quality of care over time

These measures show how residents usually do over time at this home, based on health outcomes and preventive care.

High-risk clinical events score Info A composite score based on pressure ulcers, falls with injury, weight loss, walking ability decline, and activities of daily living decline. 9.7
In line with Virginia average

Virginia average: 10.1

Functional decline score Info A composite score based on activities of daily living decline, walking ability decline, and incontinence. 18.4
7% better than Virginia average

Virginia average: 19.7

Long-stay resident measures
Need for Help with Daily Activities Increased Info Percent of long-stay residents whose need for help with daily activities has increased 17.7%
5% worse than Virginia average

Virginia average: 16.8%

Walking Ability Worsened Info Percent of long-stay residents whose ability to move independently worsened 9.7%
51% better than Virginia average

Virginia average: 19.7%

Low Risk Residents with Bowel/Bladder Incontinence Info Percent of low risk long-stay residents who lose control of their bowels or bladder 27.9%
23% worse than Virginia average

Virginia average: 22.6%

Falls with Major Injury Info Percent of long-stay residents experiencing one or more falls with major injury 1.2%
68% better than Virginia average

Virginia average: 3.6%

High Risk Residents with Pressure Ulcers Info Percent of long-stay high risk residents with pressure ulcers 12.3%
129% worse than Virginia average

Virginia average: 5.4%

Urinary Tract Infection Info Percent of long-stay residents with a urinary tract infection 4.9%
220% worse than Virginia average

Virginia average: 1.5%

Lost Too Much Weight Info Percent of long-stay residents who lose too much weight 7.6%
29% worse than Virginia average

Virginia average: 5.9%

Depressive Symptoms Info Percent of long-stay residents who have depressive symptoms 1.3%
91% better than Virginia average

Virginia average: 14.9%

Antipsychotic Use Info Percent of long-stay residents who received an antipsychotic medication 19.5%
52% worse than Virginia average

Virginia average: 12.9%

Pneumococcal Vaccine Info Percent of long-stay residents assessed and appropriately given the pneumococcal vaccine 98.9%
8% better than Virginia average

Virginia average: 91.3%

Influenza Vaccine Info Percent of long-stay residents assessed and appropriately given the seasonal influenza vaccine 100.0%
6% better than Virginia average

Virginia average: 94.0%

Short-stay resident measures
Pneumococcal Vaccine Info Percent of short-stay residents assessed and appropriately given the pneumococcal vaccine 98.9%
32% better than Virginia average

Virginia average: 74.9%

Antipsychotic medication increase Info Percent of short-stay residents who newly received an antipsychotic medication 1.3%
In line with Virginia average

Virginia average: 1.2%

Influenza Vaccine Info Percent of short-stay residents assessed and appropriately given the seasonal influenza vaccine 94.8%
29% better than Virginia average

Virginia average: 73.6%

Penalties and fines

Federal penalties imposed by CMS for regulatory violations, including civil money penalties (fines) and denials of payment for new Medicare/Medicaid admissions.

Source: CMS Penalties Database

No penalties in the past 3 years

No civil money penalties or payment denials were reported in the last 3 years.

Guides for Better Senior Living

Care Cost Calculator: See Prices in Your Area

Nursing Home Data Explorer

Don’t Wait Too Long: 7 Red Flag Signs Your Parent Needs Assisted Living Now

The True Cost of Assisted Living in 2025 – And How Families Are Paying For It

Understanding Senior Living Costs: Pricing Models, Discounts & Financial Assistance

Frequently Asked Questions about Atlantic Shores

What neighborhood is Atlantic Shores in?

Atlantic Shores is in the Atlantic Shores Retirement Community neighborhood of Virginia Beach.

Is Atlantic Shores in a walkable area?

Atlantic Shores has a walk score of 8. Car-dependent. Most errands require a car, with limited nearby walkable options.

What is the occupancy rate at Atlantic Shores?

Atlantic Shores's occupancy is 71.5%.

Are there photos of Atlantic Shores?

Yes — there are 14 photos of Atlantic Shores in the photo gallery on this page.

What is the phone number of Atlantic Shores?

(757) 716-2000 will put you in contact with the team at Atlantic Shores.

Is Atlantic Shores Medicare or Medicaid certified?

Yes — Atlantic Shores is a CMS-certified provider of Medicare and Medicaid.

Explore Open Rooms
1 Contact details
2 What type of senior care service are you looking for?
3 What budget do you have in mind for senior care?
4 How soon do you need to find care?
5 Additional details

Thank you for your interest!

Our team will be in touch shortly to help with next steps.