


Occupancy rate
100%
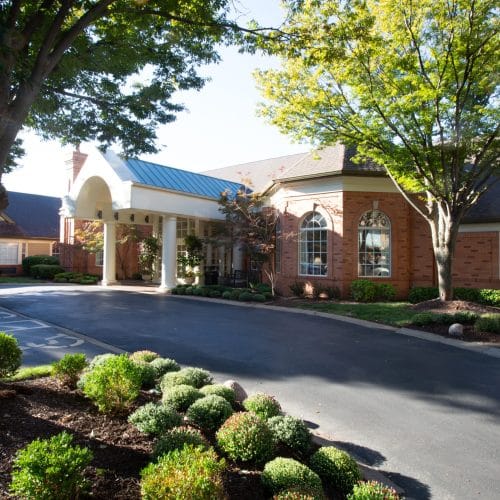
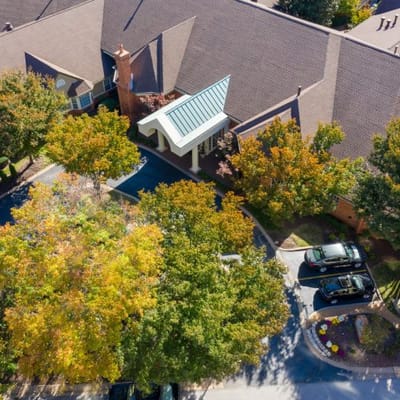


McKnight Place Extended Care is a 70-bed skilled nursing facility at Two McKnight Place in Saint Louis, Missouri. Administered by Ms. Glenda Knittel and operated by McKnight Place Extended Care, LLC, the community holds Medicare certification. The facility was recognized as a Best Long-Term Care provider by U.S.
News & World Report in 2026 and received the STL Headliner Award for Best Skilled Nursing in 2024.
The facility provides six hours twenty-five minutes of combined nursing care per resident per day, placing it third among 256 Missouri SNFs and 69% above the Missouri average of three hours forty-eight minutes. RN coverage runs 14% above average, LPN hours are 63% above average, and CNA hours are 77% above average. Weekend staffing is 76% above average, with weekend RN hours at 95% above average. Physical therapy support is triple the average.
The facility ranked 41st of 263 Missouri SNFs for total payroll investment. Overall financial performance is stable. Occupancy exceeds the state average.
CMS awarded the facility four stars overall, four stars for Health Inspection, and four stars for Staffing. However, Quality Measures earned only one star.
Among long-stay residents, hospitalizations occur in line with the state average of 2.08. Emergency department visits run 47% better than average. Falls with major injury metrics are 70% better than average. Pressure ulcers stand at 26% worse than average.
Long-stay urinary tract infection rates are 52% better than average.
Re-hospitalization rates are 19% worse than average. The rate of successful return to home or community is 29% worse than average. Ability to care for oneself at discharge is 12% below average.
Inspection history from March 2020 through April 2025 shows five standard inspections and one complaint investigation.
The March 2020 standard inspection identified 26 deficiencies. March 2023 saw a complaint investigation resulting in eight deficiencies. October 2023 brought a standard inspection with nine deficiencies. In May 2024, a second complaint investigation cited nine deficiencies.
Most significantly, April 2025 encompassed both a standard health inspection (29 deficiencies) and a concurrent complaint investigation (eight deficiencies) on the same date.
All citations were moderate or minor, with zero critical or serious severity designations. No federal penalties or civil money penalties have been imposed in the past three years. The facility’s citation rate of 5.4 per inspection ranks 148th of 261 Missouri SNFs.
The neighborhood is somewhat walkable (Walk Score 34), and the facility lies 0.179 miles from the Saint Louis city center.
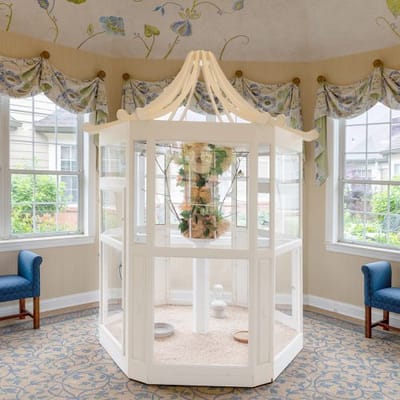
Amenities include physical, occupational, and speech therapies; on-site dentistry, podiatry, ophthalmology, and psychiatry; art and music therapy; restaurant-style dining; personal care companion services; transportation; salon; hearing aid services; catering; housekeeping; laundry; newspapers; dry cleaning; floral service; patios; walking paths; and an aviary. The facility allows pets and maintains 24-hour staffing with on-site physician services.
Families should verify corrections for the April 2025 deficiencies in medication management and kitchen sanitation, given the combined citation volume within a single survey month.
| Staff type | Hours / Day / Resident | vs state avg |
|---|---|---|
|
Registered Nurse (RN)
| 23m per day | ▼ 18% State avg: 28m per day · National avg: 41m per day |
|
LPN / LVN
| 1h 12m per day | ▲ 75% State avg: 41m per day · National avg: 52m per day |
|
Nurse Aide
| 3h 49m per day | ▲ 65% State avg: 2h 19m per day · National avg: 2h 20m per day |
|
Weekend Total Nursing
| 4h 53m per day | ▲ 60% State avg: 3h 3m per day · National avg: 3h 26m per day |
|
Physical Therapist
| 7m per day | ▲ 272% State avg: 2m per day · National avg: 4m per day |
|
Weekend RN
| 33m per day | ▲ 63% State avg: 20m per day · National avg: 28m per day |
McKnight Place Extended Care is legally operated by Mcknight Place Extended Care, LLC, and administered by Michael Barth.
In Missouri, the Department of Health and Senior Services, Division of Regulation and Licensure performs the inspections and unannounced surveys required for all long-term care providers.
Deficiencies
| This Facility | MO Average | vs. MO Avg |
|---|---|---|---|
|
Total deficiencies
| 89 | 35 | This facility has 154% more total deficiencies than a typical Missouri assisted living residence (89 vs. MO avg 35).↑ 154% worse |
|
Deficiencies per year
| 11.1 | 4.4 | This facility has 152% more deficiencies per year than a typical Missouri assisted living residence (11.1 vs. MO avg 4.4).↑ 152% worse |
|
Deficiencies per inspection
| 5.6 | 2.9 | This facility has 93% more deficiencies per inspection than a typical Missouri assisted living residence (5.6 vs. MO avg 2.9).↑ 93% worse |
Inspections
| This Facility | MO Average | vs. MO Avg |
|---|---|---|---|
|
Total inspections
| 16 | 12 | This facility has had 33% more total inspections than the Missouri average (16 vs. MO avg 12). More inspections can mean more regulatory scrutiny rather than worse care.↑ 33% more |
State average N/A
Last Health inspection on Apr 2025
State average N/A
State average N/A
Health citations are formal notices following inspections when they fail to comply with safety and care standards.
21 of 27 citations resulted from standard inspections; 4 of 27 resulted from complaint investigations; and 2 of 27 came from combined inspections (standard and complaint).
State average: N/A
State average: N/A
Reporting period: October 1 – December 31, 2025 (Q4 2025). Source: CMS Payroll-Based Journal report.
State average ratio: 0 : 0
State average: 0 hours
Manages medical care and health needs.
Assists with medical care and medications.
Helps with daily care and mobility.
Total hours from contractors
3,758 contractor hours this quarter
| Certified Nursing Assistant | 58 | 0 | 58 | 18,068 | 92 | 100% | 7.5 |
| Licensed Practical Nurse | 20 | 0 | 20 | 5,625 | 92 | 100% | 9 |
| Medication Aide/Technician | 4 | 0 | 4 | 1,991 | 92 | 100% | 10.7 |
| Other Dietary Services Staff | 4 | 0 | 4 | 1,756 | 92 | 100% | 7.2 |
| Registered Nurse | 8 | 0 | 8 | 1,560 | 88 | 96% | 8.8 |
| Physical Therapy Aide | 0 | 6 | 6 | 914 | 76 | 83% | 3.2 |
| Qualified Social Worker | 0 | 5 | 5 | 758 | 66 | 72% | 4.5 |
| RN Director of Nursing | 2 | 0 | 2 | 671 | 59 | 64% | 7.4 |
| Respiratory Therapy Technician | 0 | 5 | 5 | 653 | 69 | 75% | 2.8 |
| Speech Language Pathologist | 0 | 8 | 8 | 645 | 71 | 77% | 2.7 |
| Physical Therapy Assistant | 0 | 5 | 5 | 640 | 76 | 83% | 3.7 |
| Dietitian | 1 | 0 | 1 | 462 | 59 | 64% | 7.8 |
| Administrator | 1 | 0 | 1 | 458 | 58 | 63% | 7.9 |
| Nurse Practitioner | 1 | 0 | 1 | 449 | 57 | 62% | 7.9 |
| Mental Health Service Worker | 1 | 0 | 1 | 349 | 45 | 49% | 7.8 |
| Occupational Therapy Assistant | 0 | 1 | 1 | 55 | 35 | 38% | 1.6 |
| Occupational Therapy Aide | 0 | 1 | 1 | 48 | 19 | 21% | 2.5 |
| Medical Director | 0 | 1 | 1 | 45 | 9 | 10% | 5 |
Federal penalties imposed by CMS for regulatory violations, including civil money penalties (fines) and denials of payment for new Medicare/Medicaid admissions.
Source: CMS Penalties Database
No penalties in the past 3 years
No civil money penalties or payment denials were reported in the last 3 years.
These measures show how residents usually do over time at this home, based on health outcomes and preventive care.
State average: 10.9
State average: 19.5
State average: 19.8%
State average: 20.6%
State average: 18.1%
State average: 4.0%
State average: 5.0%
State average: 2.7%
State average: 5.6%
State average: 12.8%
State average: 22.0%
State average: 85.2%
State average: 90.9%
State average: 2.08
State average: 2.35
State average: 66.6%
State average: 2.2%
State average: 63.5%
State average: 25.3%
State average: 13.4%
State average: 0.8%
State average: 53.7%
State average: 50.6%
Quality measures are calculated from Minimum Data Set (MDS) assessments. For most measures, lower percentages indicate better care quality.
57% of new residents, usually for short-term rehab.
43% of new residents, often for short stays.
Source: CMS Long-Term Care Facility Characteristics (Data as of Jan 2026)
Residents meet regularly to discuss policies, care quality, and activities
Part of a Continuing Care Retirement Community offering multiple care levels
Organized group of residents that meets regularly to discuss facility policies, quality of life, and activities.
Data sourced from CMS Long-Term Care Facility Characteristics quarterly report. Payer mix reflects the current resident census by primary payment source.
Historical financial and operational data for McKnight Place Extended Care from 2015–2023, based on CMS SNF Cost Reports.
Key figures below are for fiscal year ending in 12/2023.
Based on CMS SNF Cost Report for fiscal year ending in 12/2023.
Most residents typically stay for a few weeks or months before returning home or moving on.
Most new residents arrive under Medicare (57% of admissions), and a typical Medicare stay runs around 25 days.
Coverage residents most often arrive under.
Coverage residents most often leave under.
![]() Two Mcknight Pl, Saint Louis, MO 63124-1900
Two Mcknight Pl, Saint Louis, MO 63124-1900
Add your location
The information below is reported by the Missouri Department of Health and Senior Services, Division of Regulation and Licensure.
| Laclede Groves | NH AL IL MC | St. Louis | - | 251 | - | 35 | - |
| Republic Nursing and Rehab | NH | Republic | - | 127 | - | 48 | Private / Semi-Private Rooms |
| Chaffee Nursing Center | NH HOS SNF | Chaffee | - | 71 | - | 25 | Studio |
| Heisinger Bluffs | NH AL IL MC RC SNF | Jefferson City | - | 111 | - | 32 | 1 Bed / 2 Bed / 3 Bed |
| McKnight Place Extended Care | NH SNF | Saint Louis | - | 70 | - | 34 | - |
McKnight Place Extended Care has a walk score of 34. Somewhat walkable. A few nearby services may be reachable on foot, but most trips require transportation.
According to MO state health department records, McKnight Place Extended Care's license number is 052154.
According to MO state health department records, McKnight Place Extended Care's license expires on September 20, 2026.
McKnight Place Extended Care's occupancy is 100%.
No, McKnight Place Extended Care has a no-pet policy.
McKnight Place Extended Care is registered as a for-profit in MO.
Michael Barth is the administrator of McKnight Place Extended Care.
Care Cost Calculator: See Prices in Your Area
Nursing Home Data Explorer
Don’t Wait Too Long: 7 Red Flag Signs Your Parent Needs Assisted Living Now
The True Cost of Assisted Living in 2025 – And How Families Are Paying For It
Understanding Senior Living Costs: Pricing Models, Discounts & Financial Assistance


